Methodology for Evaluating the Usability of User Interfaces in Mobile Services Pedro Concejero (1), Daniel Tapias (2), Juan José Rodríguez (1), Juan Carlos Luengo (2), Sebastián Sánchez (2) (1) Telefónica Investigación y Desarrollo Emilio Vargas, 6; E-28043 Madrid (Spain)
(2) Telefónica Móviles España - Universidad de Alcalá Ronda de la Comunicación s/n E-28050 - Madrid (Spain)
[email protected],
[email protected]
Abstract In this paper we present a usability measure adapted to mobile services, which is based on the well-known theoretical framework defined in the ISO 9241-11 [ISO 9241 (1988)] standard. This measure is then applied to a representative set of services of the Telefónica’s portfolio for residential customers. The user tests that we present were carried out by a total of 327 people. Additionally, in section 3 we describe the application of the methodology to a particular service and section 4 presents the results of the experiments. These results show highly significant differences in the three usability measures considered, though all of them have the same trend. The worst performers in all cases were the WAP and i-mode user interfaces (UI), while the best performers were the SMS and web based UIs closely followed by the voice UI. Finally, in section 5 we analyse the results and present our conclusions.
1. Introduction
following objectives [Helander, M. (1998)]:
The definition of usability as well as the development of a methodology for measuring the usability are themes that have been and continue to be widely discussed [Frokjaer, E. et al. (2000)][ Hornbik, K. (2006)][ Nielsen, J. (1993)]; going from definitions in which usability is related to the concept of quality [Bevan, N. (1995)] to the broad definition of usability presented in the ISO 9241-11 standard [ISO 9241 (1988)]. Authors in [Frokjaer, E. et al. (2000)] concluded that "effectiveness, efficiency, and satisfaction should be considered independent aspect of usability and all be included in usability testing." In this paper, we focus on the second point: can usability be measured in such a way that we can compare the usability of different user interfaces or different services or just different versions of either the same user interface or the same service? We strongly believe that usability can be measured quantitatively as we show with the data obtained through the user tests that have been carried out with 327 people. The paper is organized as follows: in section 2 we present the theoretical framework of the usability measure we have developed and tested; section 3 shows the application of the methodology to a particular service; section 4 presents the results of the user tests and in section 5 we present the conclusions and the work we are currently concluding.
2. Theoretical framework of the Usability Measure The usability of services is a core attribute from the beginning of the design phase in Telefónica, with the
2317
-
-
Usability must be quantifiable and not an opinion. Usability must be in the same level as other quality attributes in software engineering, as reliability or performance. It is essential to reach early consensus on the usability definition and criteria in the design team. Usability objectives must be weighted and prioritised as a function of the global objectives of the system. Objectives must be clearly separated of methods and implementations.
Therefore, we have developed a methodology which is an adaptation of the well-known theoretical framework defined in the ISO 9241-11 [ISO 9241 (1988)] standard to services. In the particular case of mobile services, the usability of a service can be formulated (1) as a function of the usability of the mobile phones used to access the service (U(phones)) and the usability of the service itself (U(service)). i.e.:
Usability = α·f[U(service), U(phones)]
(1)
where the usability of the service (2) is computed as the weighted sum of the service usability in each of its user interfaces (voice, DTMF, WAP, i-mode, SMS, etc.): N
U(service) = ∑ βinterface·U(interface)
(2)
interface=1
and the usability of the phones (3) is computed as the weighted sum of the usability of the different phones utilised by the users:
-
M
U(phones) = ∑ γphone·U(phone)
(3)
phone=1
The usability of the phone refers to the usability of the functionalities and resources of the phone that are used to access the particular service that is being evaluated. βinterface and γphone are the weights, so that ∑ βinterface = 1 and ∑ γphone = 1. Usually βi represents the percentage of accesses to the service from the interface “i”, but when the measure is taken before launching the service, we assume that all the weights are equal, and then, βinterface = 1/N (where N is the total number of different user interfaces). In the same way, γp is the percentage of phones type “p”, though this parameter is not used in the work presented in this paper since we are focusing on the measure of U(service). The measure of the usability of the service is computed as the combination of three different measures: effectiveness, efficiency and user satisfaction, where: -
Effectiveness is directly related to the success or failure of the user in reaching the goal; i.e.: it measures the probability of the user to accomplish the goal. - Efficiency measures the number of required resources to reach the goal. Instead of simple measures (for example: time, number of clicks, number of downloaded pages, etc.) we defined the step, as the basic measure. This is the set of actions required to accomplish a meaningful part of the task (i.e., introduce a telephone number). - Satisfaction measure refers to the user cognitive state, which is consequence of the experience on the usage of the service. This state is always relative to the user expectations with respect to the service and has an important influence in the willingness of the user to use the service again. Satisfaction was mesaured by means of a subjective questionnaire composed of the following items, with a 1 to 7 agreement scale (1 means no agreement, 7 means total agreement): - The use of this service has been satisfactory for me. - I would recommend this service to my friends, colleagues, ... - I would use this service frequently. - I would find useful this service in my work or private life. - The service is easy to use. - The learning process to handle the service has been easy for me. - My interaction with the service has been clear and understandable. - I have found that the service was flexible in the interaction. - The service can be used without help. - The service can be used without the need to learn many things. - The use of the service is consistent.
2318
I feel with the control of the service when I am using it.
Additionally, the developed methodology defines the following essential concepts: -
Functionality: the components implemented or to be implemented in a service or system that allow the user to achieve an objective.
-
Context of use: this is formed by all the variables and situations that form the environment in which the user is immerse when using the system. This concept includes other users, equipment, physical and social environment.
-
Use case (or usage scenario): it is a representation of all conditions and actions that the user has to carry out in order to perform an interaction.
-
Test case: it represents a concrete situation with which you validate the system and the user requisites that are specified in a use case. It includes work scenario, objective, test procedure, and evaluation of the test.
With all these concepts two aggregates are built: the use case model, representing all user types and all possible use cases, and the tests model, which selects a representative set of the use case model together with their associated test cases.
3. Application of the Methodology to a Particular Service In this section we show the detailed application of the described methodology to the Yavoy service. Yavoy is the commercial name for the Telefónica Movistar Ring Back Tone (RBT) service; i.e.: this service allows a mobile phone user to replace the ringing tone that people hear when call him/her with a musical hit. The subscription and configuration of the service can be done via internet, SMS, WAP/i-mode or voice. There are currently about 1,750,000 service subscribers. The usability trials were carried out with 90 users whose ages ranged from 18 to 62 years old. All the tests were made in the Telefónica usability laboratory [Rodríguez J. J., et al. (2005)], where the participant was together with an experimenter who proposed the goals and the details about the services under test, and were video-recorded in order to have the possibility of reviewing the time and number of pages measures once the experiment had finished. The measures were made in real time from the control room, which is separated of the laboratory, therefore preventing the user from being disturbed with the measuring process. Two different video channels were recorded: a close-up of the user and a close-up of the screen of the phone. The 9 goals defined to measure the usability where: 1. 2. 3. 4.
Accessing the service, Purchasing a specific RBT, Customize the downloaded RBT, Download a second RBT,
5. 6. 7. 8. 9.
Customize the second specific RBT, Change the RBT of the latest customization, Delete the customization of the second RBT, Customize the RBT for a group, and To look up for the renewal date of the specified RBT.
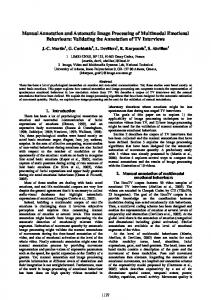
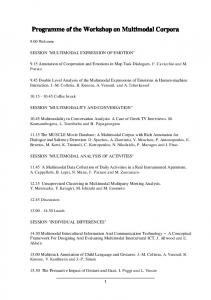
The effectiveness for a particular goal was computed as the percentage of users that were able to accomplish the proposed tasks as proposed to the participant by the experimenter. The efficiency was measured in terms of steps to achieve the goal. Figures 1 and 2 are provided as illustrations of the definition of steps for goal 2 above in two different user interfaces.
and products, and made the tests with their own mobile telephone. Once they signed the informed consent 1and received the instructions to make the tests, the participant’s own SIM card was changed with a SIM provided by the usability expert, so that he or she did not have to care at all about costs of using the services. In this way, we also ensured that the user knew about the use of the phone, and did not introduce strange effects when collecting the experimental data. All available types of user interface for each one of the services were tested in the trials. In some cases, tested services had two or three types of the user interfaces. For instance, the “greetings” service (“Saludos”) was deployed only via voice and SMS, while RBT has all four different user interfaces. A total of 327 people were recruited and participated in the tests, 205 males and 122 females. Average age for males was 29,67 years (± 8,16), and for females 28 (± 6,62). Minimum age for participants was 18 years old, and maximum age 62 years old. We defined 3 user groups as a function of age, and its distribution is shown in table 1. This distribution is representative of the customer population of Telefónica Móviles, though it also shows that it is more difficult to recruit users beyond 35 years old.
Figure 1: Steps to purchase a RBT by SMS
In total, 29 combinations of service and user interface were tested in the different phases. Services are representative of the complete portfolio for residential customers, as for instance, Voicemail, Chat, Ring Back Tones, Messages, etc. Whenever possible, the trials included all the user interfaces available for each service tested. Tasks proposed to the user varied according to the requirements of the particular user interface, but with the same goals.
Figure 2: First 3 steps to purchase a RBT by web user interface Finally, the user satisfaction was measured using a 12 questions questionnaire and three additional open questions. The efficiency and the user satisfaction were normalised to get scores ranging from 0 to 100.
4. Results 4.1 Introduction In this section we show the results of the usability measures we made in several services of Telefónica following the procedure illustrated in sections 1 and 2. The duration of the trials was limited to no more of 1 hour per user, during which time the user was requested to carry out different tasks as described above. All tests were carried out in the usability labs [Rodríguez J. J., et al. (2005)], and were designed, performed and controlled by the usability team.
Count
Percent
Age group 1 (18-24 years)
105
32.11%
Age group 2 (25-33 years)
143
43.73%
Age group 3 (34-62 years)
79
24.16%
Table 1: Distribution of participants per age group User interfaces as used in these analyses were: WAP and i-mode, voice (using the speech recognition technology used by the service), SMS (providing written commands to the service) and web (using a browser on a PC platform). Each user interface was tested by a different number of users, as shown in table 2. Table 2 also shows the number of users per age groups and user interface. We can see a balanced distribution of ages per user interface, with the only exception of SMS, which was tested by a significantly smaller group. This is a condition that we have to observe when interpreting the statistical analyses results.
4.2 Users and Services All users were subscribers of Telefónica Móviles services
2319
1
http://www.apa.org/monitor/jun04/ethics.html
User interface
Age group 1 (18-24 years)
Age group 2 (25-33 years)
Age group 3 (34-62 years)
Total
WAP and i-mode
45
70
19
134 (41.0%)
Voice recogniti on
25
31
24
80 (24.5%)
SMS
8
9
4
21 (6.4%)
Web
27
33
32
92 (28.1%)
Total
105
143
79
327
rate of 92.86%. The average effectiveness for voice recognition was close to this result, with a value of 91.44%, and almost equal to web interface (91.34%). WAP and i-mode (82.78%) results were significantly smaller when compared with the other two. Additionally, the multiple comparison tests (using Tukey-Kramer and Scheffé procedures) were significant, thus allowing us to conclude that WAP and i-mode user interfaces were systematically less usable than the other types of user interfaces tested in the experiments. Efficiency data were analyzed using exactly the same procedures. Results again showed that assumptions for ANOVA did not hold, so we took the same precautions than with the results described above. ANOVA provided highly significant results (F3, 313=6.64, prob< 0.001). Kruskal-Wallis results confirmed the conclusions (χ2 3= 15.50, prob.= 0.0014).
Table 2: Distribution of user interface per age group 4.3 Comparison of User Interfaces for Service Access in Terms of Effectiveness, Efficiency and Satisfaction
The trends in efficiency were similar to those found with effectiveness. Highest average was obtained with SMS user interfaces (83.79), followed by web user interface (78.16) and voice recognition (77.72), and again the lowest average was obtained by WAP and i-mode user interface (68.75). These differences were statistically significant even with the strictest tests, such as Bonferroni or Scheffé multiple comparisons.
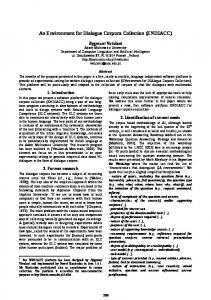
For the comparison of the three usability measures considered (effectiveness, efficiency and satisfaction), we performed one-way ANOVA with the statistical software NCSS 2007. Assumptions of ANOVA were always tested, i.e., the normality of data and the homoscedasticity of distributions. We found that assumptions did not hold in our distributions, though this is usual in this kind of Human Factors experimental data. Therefore, to avoid erroneous conclusions due to this effect, we also performed non-parametric tests equivalent to ANOVA, as the Kruskal-Wallis test. Exploratory analyses were carried out, of which the most representative are the Box-andwhisker plots shown in Figure 3. We filtered out 10 data, out of the 327 initially available, due to missing information (very often due to the service being unavailable temporally).
Satisfaction was measured using the 12-items questionnaire described in section 2. With these data, we obtained that normality of residuals assumption could be confirmed, but not homoscedasticity of distributions. We again performed both ANOVA and Kruskal-Wallis analyses. The former provided highly significant results (F3, 313=6.30, prob< 0.001), which were confirmed by the later (χ2 3= 13.27411, prob.= 0.004).
ANOVA results for effectiveness were significant (F3, 313= 5.86, prob.< 0.001). Due to the problems with the assumptions of this model, Kruskal-Wallis one-way ANOVA on ranks analysis was also performed, with a χ2 3= 16.84 , prob.=0.0007, which allowed us to conclude that there were statistically significant differences between some of the user interfaces included in the analyses.
We found the same trends with this usability measure when we looked at the different user interfaces. WAP and i-mode user interfaces received the lowest average (58.06), followed by voice recognition (66.31) and web access (67.00), and the best performer was the SMS user interface (72.22). Tukey-Kramer multiple comparisons procedures confirmed that WAP and i-mode were significantly worse than any of the other user interfaces in this usability measure.
Statistical results showed that the user interface with the highest effectiveness was SMS, with an average success
Box Plot Box Plot efficiency efficiency
BoxPlot effectiveness 100.00 100.00
100 100
75 75
75.00 75.00
75 75
eficienc ia2
eficacia2
0.75
50 50
0.50
0.25 25 25
0.00 00
1
1 WAP + i-mode
3
3 voice voice
4
4 SMS SMS
interface
5
50.00 50.00
25 25
0.00 0.00
00
5 web web
100 100 75.00 75.00 75.00
50 50
25.00 25.00
100.00 100.00 100.00
satis_recalculada
1.00 100 100
Box Plot Plot Box Plot Box
satisfaction satisfaction
50.00 50.00 50.00
25.00 25.00 25.00
0.00 0.00 0.00
1
1 WAP WAP ++ i-mode i-mode
3
voice voice
interface interface
4
SMS SMS
55
web web
75 75
50 50
25 25
00
111
WAP++ WAP i-mode i-mode
333
voice voice voice
interface interface interface
Box-and-whisker plots plots of of usability usability measures measures per per user user interface interface Figure 3: Box-and-whisker
2320
444
SMS SMS SMS
555
web web web
5.
Conclusion
The results show highly significant differences in the three usability measures considered, with the same trend for each one of the usability measures. Some of the distribution shapes of these measures are highly skewed, which means that the results of parametric significance tests have to be carefully interpreted [Kirk, R. E. (1995)]. The main problem arises when we have an unbalanced number of data per cell, which is very typical of this kind of experiments, in usability testing and in many other social science fields, where it is impossible to have perfectly balanced data per design cell. In these cases, having alternative significance tests is compulsory, and checking the consistency of the results by different approaches is what allows the experimenter to extract conclusions. In our case, the fact that both non-parametric (KruskalWallis) and parametric (ANOVA) tests provide highly significant results, allows us to conclude, with a high level of trust, that user interfaces of the Telefónica services provide different effectiveness, efficiency and satisfaction. And a very important result of all the tests is that the differences between the user interfaces in each of the usability measures follow the same trend as can be observed in Figure 4. 100
this user interface is probably the most effective and efficient. On the other hand, the richer graphical user interfaces of web services, as used in a PC display, can provide also very good usability results, though there seems to be a trend to a smaller efficiency in comparison with SMSbased user interfaces. Our results with voice user interfaces can also explain why users prefer this type of interaction instead of DTMFbased user interfaces. Last, WAP and i-mode user interfaces are, at least at the moment when these tests were carried out, the least usable and satisfactory for many users.
6. References Bevan, N. (1995): Measuring Usability as Quality of Use. Software Quality Journal 4 (1995), pp.: 115-150. Frokjaer, E. et al. (2000): Frokjaer, E., Hertzum, M., Hornbaek, K.: Measuring Usability: Are Effectiveness, Efficiency and Satisfaction Really Correlated?, Proceedings of SIGCHI Conference on Human Factors in Computing Systems. The Hague, The Netherlands. Pages: 345-352. 2000. Helander, M. (1998): Handbook of Human-Computer Interaction. 2nd Ed. Amsterdam: North-Holland. Hornbik, K. (2006): Current Practice in Measuring Usability: Challenges to Usability Studies in Research. International Journal of Human Computer Studies Archive. Volume 64, Issue 2, February 2006.
95 90 85 80
ISO 9241 (1988): Ergonomic requirements for office work with visual display terminals (VDT’s). Geneva: International Standards Organization.
75 70 65
effectiveness efficiency satisfaction
60 55
Kirk, R. E. (1995): Experimental Design: Procedures for the Behavioral Sciences. Third Edition. Pacific Grove, CA: Brooks/Cole, 1995.
50 wap/i-mode
voice
web
SMS
Figure 4: Means plot of usability measures per type of user interface. The worst performers in all cases are WAP and i-mode user interfaces. Voice recognition user interfaces are systematically and significantly better than the former. Web user interfaces are only slightly better than voice user interfaces. Finally, the best performer in all measures is the SMS user interface. The fact that best performers are SMS and web access requires more discussion. First of all, participants in the tests received clear instructions about how to begin the test. This is critical for SMS-based interfaces, and this might not happen in real usage contexts. Another well documented fact is that users in laboratory situations are more motivated to accomplish the goals and to pay more attention to important details and explanations. From our results, it is clear that in lab situations, and once that users begin receiving clear step-by-step instructions in the SMS,
2321
Nielsen, J. (1993): Usability Engineering. Academic Press, Boston, 1993. Rodríguez J. J., et al. (2005): Rodríguez J. J., Concejero P., De Diego S., Collado, J. A., Tapias, D., Sánchez A. J.; Laboratorio de Usabilidad de Telefónica Móviles España. Boletín de Factores Humanos de Telefónica I+D, No. 27, August 2005. http://www.tid.es/documentos/boletin/numero27_3.pdf