Resistance spot welding is an important and widely used method for ... experiments that distinguish the different processes are the welding machine used, the.
Methods for Classifying Spot Welding Processes: A Comparative Study of Performance Eija Haapalainen, Perttu Laurinen, Heli Junno, Lauri Tuovinen, and Juha Röning Intelligent Systems Group, Department of Electrical and Information Engineering, PO BOX 4500, FIN-90014 University of Oulu, Finland {Eija.Haapalainen, Perttu.Laurinen, Heli.Junno, Lauri.Tuovinen, Juha.Roning}@ee.oulu.fi
Abstract. Resistance spot welding is an important and widely used method for joining metal objects. In this paper, various classification methods for identifying welding processes are evaluated. Using process identification, a similar process for a new welding experiment can be found among the previously run processes, and the process parameters leading to high-quality welding joints can be applied. With this approach, good welding results can be obtained right from the beginning, and the time needed for the set-up of a new process can be substantially reduced. In addition, previous quality control methods can also be used for the new process. Different classifiers are tested with several data sets consisting of statistical and geometrical features extracted from current and voltage signals recorded during welding. The best feature set classifier combination for the data used in this study is selected. Finally, it is concluded that welding processes can be identified almost perfectly by certain features.
1
Introduction
Resistance spot welding is one of the most important methods for joining metal objects. It is in widespread use in, for example, the automotive and electrical industries, where more than 100 million spot welding joints are produced daily in the European vehicle industry only [19]. Different combinations of welding machines used and materials welded constitute distinctive welding processes. In other words, welding processes could also be called production batches. In this study, various classification methods for identifying welding processes were examined for potential use in the quality control of spot welding. The research done in the field until now has concentrated on quality estimation of individual welding spots, and typically, only one welding process at a time has been considered. The objective of our research, however, has been to utilise information gathered from previously run processes to produce new welding spots of good quality. For this purpose, process classification is needed. In this paper, the aim is to search for viable features for classification and to find the classifier that would give the best results in classifying welding processes. This study is a follow-up for a previous
article by the authors, in which self-organising maps were used to identify welding processes [9]. The aim of this study was to compare the characteristics of a sample from a new welding process to information gathered from previously run processes, to find a similar process and then to apply the process parameters leading to high-quality welding joints. With this approach, good welding results can be achieved right from the beginning, and the time needed for the set-up of a new process can be significantly reduced. In addition, if a similar process is found, the quality control methods that proved viable in the previous process can also be used in the new process. The research on computational quality assessment techniques in resistance spot welding has concentrated on quality estimation using neural networks and regression analysis. Artificial neural networks and regression models have been generated based on the dynamic resistance pattern by, for example, [2] and [3]. In addition, studies using self-organising maps [8] and Bayesian networks [12] have been made. Selforganising maps have also been used for the detection and visualisation of process drifts by [20]. In this paper, the term ‘process’ is used differently from the previous studies discussing process control of spot welding. In our study, the properties of welding experiments that distinguish the different processes are the welding machine used, the materials welded and the thicknesses of the materials. However, changes in current, electrode force and electrode wear are thought to be internal changes of processes. In other studies, the term is used to refer precisely to the internal changes, including differences in electrode wear or shunting [14]. In addition, the term ‘process identification’ can be misunderstood. In our study, the term refers to finding similar processes stored in a database, whereas in different application areas, such as the studies of [11] and [6], the term is used to refer to finding mathematical models for processes. In this paper, different classifiers are evaluated for their suitability to process identification. Welding samples are described using various geometrical and statistical features that are calculated from current and voltage signals recorded during welding. The features were chosen so as to represent the characteristics of the curves as precisely as possible.
2
The Data
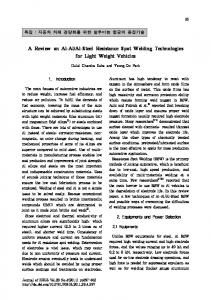
The data used in this study were supplied by two welding equipment manufacturers. There are altogether 20 processes, of which 11 have been welded at Harms+Wende GmbH & Co.KG [7] and 9 at Stanzbiegetechnik [17]. A total of 3879 welding experiments were covered. The experiments were done by welding two metal objects together using a resistance spot welding machine, (Figure 1a)). An example of a welded part is shown in Figure 1b). Each of the observations contains measurements of current and voltage signals recorded during the welding. The signals were measured at a sampling frequency of 25600 Hz.
a)
b)
Fig. 1. a) Metal objects are joined using resistance spot welding. b) An example of a welded part
The raw signal curves contained plenty of oscillatory motion and a pre-heating section, and they were therefore pre-processed before further processing. The preheating parts of the curves were cut off, so that all that remained was the signal curves recorded during the actual welding phase. In addition, the curves were smoothened using the Reinsch algorithm [15], [16]. An example of a signal curve before and after pre-processing is shown in Figure 2. b)
a)
Fig. 2. a) A raw signal curve. The pre-processing section is outlined with a rectangle. b) The same curve after pre-processing
3
The Features
Since it was not feasible to use all the data points of the two signal curves relating to a single welding experiment in the classification, a more compact way to describe the characteristics of a curve had to be developed. This was resolved by extracting geometrical and statistical features of the curves. The geometrical features were chosen to locate the transition points of a curve as precisely as possible. The statistical features included the median of the signal, and the arithmetic means of the signal values calculated on four different intervals based on the transition points. In addition, the signal curve was divided into ten intervals of equal length, and the means of the signal values on these intervals were used as features. There were altogether 12 geometrical and 15 statistical features. The features extracted are demonstrated in Figures 3 and 4.
a)
b)
Fig. 3. a) The geometrical features on an artificial voltage curve. b) An example on how the geometrical features often partially overlap in practice. On this voltage curve, the features ‘peak’ and ‘max’ overlap
In practice, it often happens that some of the geometrical features overlap, and that the overlapping features vary from one curve to another. However, this can also be regarded as a characteristic of the curve. In Figure 3a) all the geometrical features are demonstrated on an artificial curve simulating the real data. On this curve, the features do not overlap, but in other respects the curve is notably similar to genuine signal curves. Figure 3b) shows an example of the features calculated on a real signal curve. In Figure 4, the calculation of the ten means is demonstrated.
Fig. 4. Ten means of a current curve calculated on intervals of equal length
Eight data sets were formed out of the feature data to be tested with the classifiers. The first contained all of the features, while the second consisted of only the ten means. Since the number of features was rather high, and it was not known for sure that all of them contained information relevant to the classification, the feature data were compressed using principal component analysis (PCA). The aim was to pack most of the classification-related information into a relatively small number of features, to reduce the dimension of the feature space. This was done for both of these data sets, and two more sets were thereby obtained. Finally, the last four data sets were obtained by normalising each of the previous sets to have an average of zero and a standard deviation of one.
4
Classification Methods
Classification of the welding processes was carried out using five different classifiers. Since the distribution of the data was unknown, different types of classifiers were tested. The classifiers were chosen to represent both parametric and non-parametric methods. Linear Discriminant Analysis (LDA) and Quadratic Discriminant Analysis (QDA) rely on parametric estimation of multivariate normal densities. These are introduced in [13]. It should be recognized, however, that LDA and QDA are there called by the names Sample NLDR and Sample NQDR, respectively. The third classification method, Mahalanobis Discrimination (which we abbreviate as MD) is similar to the QDA method, with the exception that it classifies merely based on Mahalanobis distances. The latter method is also parametric, unlike the other two classifiers used, the k-nearest neighbour classifier (kNN) [4] (with a small value of the parameter k) and Learning Vector Quantization (LVQ) [10]. These non-parametric methods are based on modelling of the classes using prototypes and classifying according to the shortest distance to a prototype. In order to evaluate the classifiers, the data were divided into training and test data sets, which consisted of 2/3 and 1/3 of the data, respectively. The training data set was used to train each of the classifiers, and the test data set was used to evaluate their performance. a)
b)
Fig. 5. a) A surface plot of the results of tenfold cross-validation of the parameter k and the number of principal components used. b) Results of tenfold cross-validation of the number of LVQ codebook vectors for the different feature sets
Before the actual classification, suitable initial parameter values for the kNN and LVQ classifiers had to be discovered. For the kNN classifier, the best value of the parameter k and the number of principal components used was sought out using tenfold cross-validation of the training data. In Figure 5a), a surface plot of the results of the cross-validation is shown for one of the feature sets. It can be read from the plot that classification accuracy does not improve substantially after the inclusion of the five principal components. Likewise, it can be seen that the value 3 of the parameter k yields good results in the classification. The results for the other feature sets are similar.
The number of LVQ prototype vectors, called codebooks, was also determined by tenfold cross-validation of the training data. The results are shown in Figure 5b). It can be seen how an increase in the number of codebook vectors affects the accuracy of classification. The parameter value 2200 was selected because it seems to yield good classification results for all data sets.
5
Results
The classifiers were tested with the eight data sets, and the results for the test data are shown in Table 1. The percentages in the cells indicate the ratios of correctly classified processes; the cells left empty indicate invalid classifier - feature set combinations. Table 1. Comparison of classification accuracies for the 20 processes with different classifiers and feature sets. LDA = linear discriminant analysis, QDA = quadratic discriminant analysis, MD = Mahalanobis discrimination, kNN = k-nearest neighbours classifier and LVQ = learning vector quantization
All features All features, 5 pc’s All features, normalised All features, normalised, 5 pc’s 10 means 10 means, 5 pc’s 10 means, normalised 10 means, normalised, 5 pc’s
kNN, k=3
LVQ, 2200 codebooks
LDA
QDA
MD
92.96
-
-
84.13
84.52
62.46
75.23
72.37
83.20
82.51
92.96
-
-
94.74
94.89
71.05
85.45
86.30
93.50
92.41
90.87
96.36
97.14
98.53
98.07
82.12
94.27
94.35
97.76
97.06
90.87
96.36
97.14
95.43
96.13
76.16
89.32
88.31
94.58
94.12
Classification accuracy appeared to be dependent on both the feature set and the classifier used. The QDA method seems to yield better classification results than the LDA method, and it can thus be concluded that the data support rather quadratic than linear decision boundaries. In addition, the MD method that classifies merely on the grounds of Mahalanobis distances performs approximately equally well as the QDA
method. However, none of these classifiers compares with the two prototype classifiers, kNN and LVQ. The kNN and LVQ classifiers gave the best classification results, and they performed approximately equally well. The performance of the three parametric methods was, generally speaking, inferior to that of the non-parametric ones. This can be explained by the diversity of the data. The non-parametric methods performed better because they do not have any assumptions concerning the distribution of the data. These five classifiers tested yielded excellent process identification results, and there was hence no need to expand the study to other classifiers. The kNN classifier turned out optimal for this study due to its easy implementation in contrast to the LVQ classifier. The kNN classifier with 10 signal means as features was chosen as the best classifier - feature set combination with classification accuracy of over 98 %. Detailed results of the kNN (k=3) classifier for the 20 processes are shown in the 3-D bar chart of Figure 6, which illustrates the confusion matrix of the test data.
Fig. 6. A 3-D bar chart visualising the confusion matrix of the kNN (k=3) classifier
6
Conclusions
Various classification methods were evaluated for the identification of resistance spot welding processes. Signal curves recorded during welding were pre-processed, and a number of statistical and geometrical features were extracted. The features were chosen to describe the characteristics of the curves as precisely as possible. Different combinations of the features were tested with all the classifiers. It was discovered that the kNN and LVQ classifiers yielded the best classification results with classification accuracy of over 98 %. After this, it was concluded that the kNN classifier was optimal for this classification task. The best classification results were obtained using a data set consisting of means of the signal curves calculated on ten intervals of equal length. In the future, the work with process identification will be continued with classification of experiments that originate from processes not represented in the training data. In addition, the results of this study will be put to use on real spot welding production lines.
7
Acknowledgments
We would like to express our gratitude to our colleagues at Fachochschule Karlsruhe, Institut für Innovation und Transfer, in Stanzbiegetechnik and in Harms + Wende GmbH & Co.KG for providing the data set and the expertise needed at the different steps of the research project and for numerous other things that made it possible to accomplish this work. Furthermore, this study has been carried out with financial support from the Commission of the European Communities, specific RTD programme “Competitive and Sustainable Growth”, G1ST-CT-2002-50245, “SIOUX” (Intelligent System for Dynamic Online Quality Control of Spot Welding Processes for Cross(X)-Sectoral Applications). It does not necessarily reflect the views of the Commission and in no way anticipates the Commission’s future policy in this area. Finally, we would like to thank Professor Lasse Holmström at the Department of Mathematical Sciences at the University of Oulu for the many words of advice and the ideas he has contributed to our study.
References 1. Aittokallio, T., Nevalainen, O., Pursiheimo, U., Saaresranta, T., Polo, O.: Classification of Nasal Inspiratory Flow Shapes by Attributed Finite Automata. Computers and Biomedical Research. Vol. 32. (1999) 34-55 2. Aravinthan, A., Sivayoganathan, K., Al-Dabass, D., Balendran, V.: A Neural Network System for Spot Weld Strength Prediction. UKSIM2001, Conference Proceedings of the UK Simulation Society (2001) 156-160 3. Cho, Y., Rhee, S.: Primary Circuit Dynamic Resistance Monitoring and Its Application on Quality Estimation During Resistance Spot Welding. Welding Researcher (2002) 104-111 4. Devijver, P.A., Kittler, J.: Pattern Recognition - A Statistical approach. Prentice-Hall, London (1982) 5. Fachochschule Karlsruhe, http://www.fh-karlsruhe.de/, [Homepage of the University] (Referenced 3.11.2004) 6. Haesloop, D., Holt, B.R.: Neural Networks for Process Identification. IJCNN, International Joint Conference on Neural Networks. Vol. 3. (1990) 429-434 7. Harms+Wende, http://www.harms-wende.de/, [Web site of Harms+Wende] (Referenced 3.11.2004) 8. Junno, H., Laurinen, P., Tuovinen, L., Röning, J.: Studying the Quality of Resistance Spot Welding Joints Using Self-Organising Maps. Proceedings of the Fourth International ICSC Symposium on Engineering of Intelligent Systems (2004) 9. Junno, H., Laurinen, P., Haapalainen, E., Tuovinen, L., Röning, J., Zettel, D., Sampaio, D., Link, N., Peschl, M.: Resistance Spot Welding Process Identification and Initialization Based on Self-Organising Maps. Proceedings of the 1st International Conference on Informatics in Control, Automation and Robotics. Vol. 1. (2004) 296-299 10.Kohonen, T.: Self-organizing maps. Springer-Verlag, Berlin Heidelberg New York (1997) 11.Kulessky, R., Nudelman, G., Zimin, M.: Digital Electropneumatic Control System of Power Boiler Processes. Process Identification and Motion Optimization. Nineteenth Convention of Electrical and Electronics Engineers in Israel (1996) 507 - 510 12.Laurinen, P., Junno, H., Tuovinen, L., Röning, J.: Studying the Quality of Resistance Spot Welding Joints Using Bayesian Networks. Proceedings of Artificial Intelligence and Applications (2004) 705-711
13.McLachlan, G.J.: Discriminant Analysis and Statistical Pattern Recognition. John Wiley & Sons, Inc., New York (1992) 14.Mintz, D., Wen, J.T.: Process Monitoring and Control for Robotic Resistive Welding. Proceedings of the 4th IEEE Conference on Control Applications (28-29 Sept. 1995) 1126 1127 15.Reinsch, C.H.: Smoothing by Spline Functions, Numerische Matematik. Vol. 10. (1967) 177-83 16.Reinsch, C.H.: Smoothing by Spline Functions, II, Numerische Matematik. Vol. 16. (1971) 451-454 17.Stanzbiegetechnik, SBT, http://www.stanzbiegetechnik.at, [Web site of Stanzbiegetechnik] (Referenced 3.11.2004) 18.Technax, http://www.technaxindustrie.com/, [Web site of Technax] (Referenced 3.11.2004) 19.TWI World Centre for Materials Joining Technology: Resistance Spot Welding (Knowledge Summary), [www document], http://www.twi.co.uk/j32k/protected/band_3/kssaw001.html (Referenced 3.11.2004) 20.Zettel, D., Sampaio, D., Link, N., Braun, A., Peschl, M., Junno, H.: A Self Organising Map (SOM) Sensor for the Detection, Visualisation and Analysis of Process Drifts. Poster Proceedings of the 27th Annual German Conference on Artificial Intelligence (2004) 175188