(d) When the entire batch of samples is digesting smoothly, check that the acid is refluxing ... funnel into the volumetric flask and add water to the mark. Stopper ...
Methods for Evaluating Nitrogen Fixation by Nodulated Legumes in the Field
The Australian Centre for International Agricultural Research (ACL>\R) was established in June 1982 by an Act of the Australian Parliament. Its mandate is to help identify agricultural problems in developing countries and to commission collaborative research between Australian and developing country researchers in fields where Australia has a special research competence. Where trade names are used this constitutes neither endorsement of nor discrimination against any product by the Centre.
ACIAR MONOGRAPH SERIES
This peer-reviewed series contains the results of original research
supported by ACIAR, or deemed relevant to ACIAR's research objectives. The series is distributed internationally, with an emphasis on the Third World.
© Australian Centre for International Agricultural Research
G.P.O. Box 1571, Canberra, A.C.T. 2601. Peoples, M.B., Faizah, A.W., Rerkasem, B., and Herridge, D.F. 1989. Methods for evaluating nitrogen fixation by nodulated legumes in the field. ACIAR Monograph No. 11, vii + 76 p. ISBN 0949511 90 0 Typeset and laid out by Arawang Information Bureau Pty Ltd, Canberra. Printed by James Ferguson Pty Ltd, Hamilton, Qld.
Methods for Evaluating Nitrogen Fixation by Nodulated Legumes in the Field Editors
M.B. Peoples, A.W. Faizah, B. Rerkasem, and D.F. Herridge
Australian Centre for International Agricultural Research Canberra 1989
Principal Contributors F J. Bergersen
Division of Plant Industry, CSIRO, G.P.O. Box 1600, Canberra, A.C.T. 2601, Australia.
K. Chong
Rubber Research Institute of Malaysia, P.O. Box 10150, 50908 Kuala Lumpur, Malaysia.
A.W. Faizah
Rubber Research Institute of Malaysia, P.O. Box 10150, 50908 Kuala Lumpur, Malaysia.
D.F. Herridge
NSW Agriculture & Fisheries R.M.B. 944, Tamworth, New South Wales 2340, Australia.
M.
~orhayati
Rubber Research Institute of Malaysia, P.O. Box 10150, 50908 Kuala Lumpur, Malaysia.
M.B. Peoples
Division of Plant Industry, CSIRO, G.P.O. Box 1600, Canberra, A.c.T. 2601, Australia.
B. Rerkasem
Multiple Cropping Centre, Faculty of Agriculture, Chiang Mai UniverSity, Chiang Mai 50002, Thailand.
K. Rerkasem
Multiple Cropping Centre, Faculty of Agriculture, Chiang Mai University, Chiang Mai 50002, Thailand.
M.N. Sudin
Rubber Research Institute of Malaysia, P.O. Box 10150, 50908 Kuala Lumpur, Malaysia.
G.L. Turner
Division of Plant Industry, CSIRO, G.P.O. Box 1600, Canberra, A.C.T. 2601, Australia.
iv
Foreword
Nitrogen defidency is a widespread problem in many soils used for the production of staple cereal crops. In high potential areas of the developing world, farmers can afford nitrogen fertilisers to increase cereal production. In the less-favoured areas, an alternative, cheaper source of nitrogen in the cropping system is that fixed by the root nodule bacteria in food and forage legumes. In addition to sparing existing soil nitrogen, nitrogen fixation by these legumes can provide Significant inputs which enter the soil organic pool and are released to companion or subsequent cereal crops. Although various aspects of biological nitrogen fixation have been researched for many years, the development of improved methods for enhancing and managing this process has been hampered by the inadequacy or sophistication of methods for measuring nitrogen fixation. In order to help overcome this constraint, ACIAR has, since 1984, funded research aiming to develop Simpler, more reliable methods for measuring nitrogen fixation. The research has involved a partnership between scientists at Chiang Mai University in Thailand, the Rubber Research Institute of Malaysia, and the CSIRO Division of Plant Industry and NSW Agriculture & Fisheries in Australia. This handbook describes methods that are particularly designed for use by developing country sdentists. The authors are to be commended for the simple but complete manner in which the methods are presented. Thanks should also go to the ACIAR Communications Program, and especially Mr Reg MacIntyre who edited the publication, and to the anonymous peer reviewers who suggested a number of valuable and constructive changes. We hope that the developing country scientists using the techniques described here will gain a better understanding of the role of nitrogen fixation in cropping systems. We also hope that they will use this knowledge to design better, more productive legume-based systems for the resource-poor farmers who are the ultimate clients for the research ACIAR supports. E. T. Craswell Research Program Coordinator ACIAR
v
6
15N-isotopic techniques
50
6.1 Principles behind the method 6.2 Applications, advantages and limitiations
6.3 Methodology
50 50 55
7
Conclusion
66
8
References
68
9 Acknowledgments
73
10 Appendix
75
vii
1 INTRODUCTION
1.1 Why measure N2 fixation? The unique advantage of growing legumes in agricultural systems reflects their potential capacity to fix large amounts of atmospheric N2. Yet the formation of the symbiosis between legume and Rhizobium spp. is dependent upon many factors and cannot be assumed to occur as a matter of course. Failure to achieve an effective symbiosis in a soil low in mineral-nitrogen (N) will result in a loss of legume production, and applications of N-fertiliser of up to 160 kg ]';/ha may be required to achieve seed yields similar to those of a well-nodulated crop (Gault et al. 1984). In a soil of higher mineral-N content, the legume may compensate for poor N2 fixation by scavenging N from the soil. Although production in this situation may not be impaired, the net result of cropping with a legume deficient in nodulation is an exploitation of N reserves. Soil N fertility is lost and it represents a wasteful use of a legume in a cropping sequence (Table 1.1). Table 1.1 Interaction between soil mineral nitrogen, N2 fIXation and legume production. Soil minera\-N
N2 fIXation
Legume production
Potential benefit to soil
Low
Poor Good
Low High
None High
High
Poor Good
High High
None High
The relationship between N2 fIxation and plant or food production is direct and obvious in some cases (e.g. on a soil low in mineral-N, Table 1.1); however, the overall benefIts of including Nz-fixing legumes in cropping systems cannot be assessed unless a reliable and accurate field measurement is made of the levels of fixation achieved. Any other parameter (e.g. nodule number, legume biomass) provides only a qualitative and descriptive assessment. Below are listed several reasons why the measurement of Nz fixation is important in many aspects of legume research.
co Ecological considerations reqUire an understanding of the relative contribution of Nz-fixing components to the N-cycle.
CH) Development of sustainable farming systems. Understanding of the amount of N2 fixed by legumes as influenced by soil management or cultural practices allows development of efficient agricultural and agroforestry production systems. Measurements of N2 fixation enable an investigator to evaluate the ability of indigenous Rhizobium spp. to effectively nodulate newly introduced legumes, the symbiotic effectiveness of rhizobial inoculants and success of inoculation procedures, or the N2-fixing capabilities of legume genotypes in plant breeding programs.
(Hi)
(iv) Once the user is satisfied that nodule development is adequate, measurement of N2 fixation establishes whether a legume is achieving its potential, and thus becomes an added means of identifying constraints, such as nutrient limitations. Cv) Residual effects on subsequent crops following the grovvth of legumes are frequently attributed to N2 fixation. 11Iere may be other benefits such as improvements to soil structure or control of pests or diseases. Measurement of N2 fixation allows proper assessment of the potential benefits from the input of fixed nitrogen or sparing of soil N by the legume.
1.2 Methods to measure N2 fixation There is no single 'correct' way of measuring N2 fixation. No one technique will provide an accurate measure of Nz fixation for all legumes grown in any soil under diverse environmental conditions. Each technique has its own unique advantages and limitations, and these will be detailed in the following sections for all the most commonly used methodologies except the acetylene reduction assay. The acetylene reduction assay is a useful diagnostic tool for the detection of nitrogenase activity and has been widely used in all areas of N2 fixation research because of its high sensitivity and simplicity. However, its reliability is now questioned for even comparative studies with Acetylene reduction provides only an instantaneous measure of nitrogenase activity under the prevailing assay conditions, therefore its accuracy has always been restricted by the requirement for many repeated determinations to adjust for marked diurnal and seasonal changes in Nz-fixing activity. Further errors in the field can arise due to the use of an inappropriate calibration factor to relate ethylene production to Nz fixation, incomplete recovery of a plant's total nodule population, nodule detachment or damage prior to assay, plant disturbance, or an acetylene-induced decline in nitrogenase activity during assay (Witty and Minchin 1988). Although in situ procedures with flow-through gas systems are being devised to overcome some of these technical problems, the procedure has only limited application for the measurement of N2 fixation in the field. It is intended that this publication will complement the many books and review
articles that deal with the various technologies associated with symbiotic N2 fixation. In particular, the principles behind xylem-solute techniques, N-difference procedures, and 15N isotope dilution methods for quantifying Nz fixation will be described. The application of these techniques in the field will be discussed as will the analysis and interpretation of experimental data. In each section the reader is provided with references to the most relevant literature citations for additional detail. Much of the text will refer to studies of food legumes, although the general concepts 2
can also be applied to other legume systems. Similar methodologies eN-difference, 151\) are also utilised in studies of associative N2 fixation with non-legumes; readers are referred to a comprehensive review of tills topic by Boddey (987).
3
2 FORMATION OF THE LEGUME - RHIZOBIUM SYMBIOSIS
The contribution of a legume in any production system is dependent on the formation of nodules by strains of Rhizobium spp. effective in Nz fixation with the chosen legume host. There are three major groups of legumes which can be distinguished on the basis of compatibility with a range of strains of Rhizobium (Table 2.1). At one extreme is a group of legumes which can form an effective symbiosis with a wide range of strains. Members of this group are the tropical legumes nodulated by cowpea-type Rhizobium. These Rhizobium spp. are so widespread in tropical soils that legumes of this group seldom respond to inoculation; yet nodulation failures may still occur because of low numbers of rhizobia in the soil or high levels of soil mineral N. At the other extreme are legumes with specific rhizobial requirements. These specificities are most relevant when the legume is being introduced into new areas. Response to inoculation of these legumes is usually successful provided adequate numbers of rhizobia are applied at sowing. The third and intermediate group of legumes nodulate with many strains of Rhizobium, but effectively fix Nz with only a limited number of them. Thus inoculation and nodulation failures are more frequent because the inoculum strain is unable to compete with the ineffective but established soil populations of rhizobia. Overall, it must be remembered also that environmental conditions (temperature, water availability, soil pH, etc.), the level of availability of mineral nutrients in the soil (reviewed by O'Hara et aL 1988) and diseases of legumes may affect nodulation and/or Nz fixation, obscuring the beneficial effects which are being sought.
2.1 Inoculation There are five conditions under which soils may be devoid of Rhizobium to form an effective symbiosis with a legume, and which may warrant inoculation. (i) The absence of the same or a symbiotically related legume in the immediate past
history. (H) Poor nodulation when the same crop was grown previously. (Hi) When the legume follows a non-legUminous crop in a rotation.
(iv) In land reclamation. 4
(v) When environmental conditions are unfavourable for Rhizohium survival (e.g. if soil pH is less than 5.5 for R. meliloti or greater than 7 for R. /upini). In these situations soil amendments will be required to ensure establishment of rhizobia. Table 2.1 Legumes, grouped on the basis of nodulation and N2 fixation with a range of Rbizobium speciesa.
Nodulate effectively with a wide range of strains. Genera listed forming one loose group. Albizia Alysicarpus Aracbis Call1andm Calopogonium Cajanus Canavalia Clitoria Crotalaria Dolicbos Erytbrina
Galactia Gliricidia Indigo/era Lablab Lespedeza Macroptilium Macrotyloma Mimosa Pacbyrbizus Pongamta Neonotonta
Psophocarpus Pueraria Rhyncbosia Stylosanthes (several sulrgroups) Tephrosia Teramnus Vigna Voandzeia Zornia
Nodulate with a range of strains but often ineffectively. Genera listed forming individual groups with some crossing between groups. Sub-groups distinguishable. Acacia Adesmia Aescbynomene
Astragalus Centrosema (2 sulrgrp) Desmantbus Desmodium (2 sulrgrp)
Psoralea Sesbanla (2 sulrgrp)
Nodulate effectively with specific strains only. Genera listed forming specific groups. Cicer Coroniila Glycinemax Hedvsarum Latbyrus Lens Leucaena
Lotononis-Listia (3 sulrgrp) Lotus (3 sub-grp) Lupinus (2 sub-grp) Medicago Melilotus Onobrycbts Ornitbopus
Phaseo/us Pisum Trifolium (many sub-grp) Trigone/la Vicia
a J. Brockwell, personal communication.
TIle rhizobia to be used for inoculation may be isolated by the researcher himself from nodules, dried root material, or soil, or be requested from a Rhizobium culture collection (see Appendix 10.1; Brockwell 1980; Somasegaran and Hoben 1985). In either case the culture will require further grmvth and multiplication until there are sufficient bacterial numbers present for inoculation. [Various aspects of inoculant production and uses are reviewed in Somasegaran and Hoben (985), Thompson (980), and Vincent (982).] Alternatively, inoculant can be purchased from a commercial producer. In this instance it is desirable to select commercial inoculant of the highest quality possible. The minimum number of viable bacteria accepted in peat cultures by the Australian Inoculants Research and Control Service CGosford, N.S.W.) is 109 rhizobia per gram at manufacture and 108 per gram at the time of inoculant expiry with less than 0.1% contamination. (Australian inoculant producers who meet this standard are listed in Appendix 10.2). Not all manufacturers routinely 5
produce inoculant for all legumes; however, it may be possible to arrange for a special batch of rhizobia to be fermented for an uncommon legume species. Methods of inoculating legume seed are numerous and often determined by the aims of the experiment itself [see discussion in Brockwell (980), Gault et aL (1982), and Vincent (1982)J. Some general principles apply whatever the technique chosen: (0 If uninoculated control treatments are included, they should always be handled
before treatments in which the seed is inoculated. This reduces the risk of contamination and subsequent nodulation of the controls. (H) Inoculation levels should always be as high as feasible within the objectives of the experiment. The presence of large numbers of inoculant rhizobia reduces the scope for contamination and nodulation by naturally occurring rhizobia or strains from other inoculation treatments. (iii) Rhizobia are mobile organisms and are easily transferred by water movement, human or animal agency, or accidentally from treatment to treatment or plot to plot. Awareness of this is needed in setting up the experiment, fencing to exclude animals, weeding it, and even in walking across it. (iv) Rhizobia are incompatible with many agrochemicals applied as seed dressings. Even a fertiliser such as superphosphate can be toxic to rhizobia when mixed in direct contact with inoculated seed, because superphosphate is very acidic. (v) Rhizobia can easily be killed by heat. Inoculant therefore must be kept cool
before use. Environmental temperature at sowing, however, is also important. Some 4.6% of a soybean inoculum can be recovered from the soil 24 hours after sowing at 28 C; but only 0.2% or less might survive sowing at 38°C (Brockwell et aL 1987). Q
2.2 Evaluation of nodulation Many traits which provide a subjective evaluation of the response to inoculation or the capacity of a crop to fIX N can be assessed during field experimentation. These are useful when taken in conjunction with field measurements of Nz fi,xation and can often assist in the interpretation of the data obtained. Such parameters include earliness of nodulation, nodule number, mass and colour, distribution and longevity of the nodule population, and visual nodulation scores. Nodulation is generally assessed periodically after sowing by digging up a number of plants at random from each treatment. Nodule number and nodule mass or nodule weight per unit dry weight of the whole plant or root system are often used in trial comparisons; however, similar information can be obtained by visually scoring nodulation on a 0-5 basis taking into account nodule number, size, pigmentation and distribution. The system devised for soybean in Figure 2.1 represents an adaptation of the classification criteria used by Corbin et al. (1977) when visually ranking nodulation in field-grown chickpea. The nodule score for soybean is determined by the number of effective nodules in the crown-root zone (regarded as the region 5 cm below the 6
soil level - - - -
nodule score
o
nodule score
3
2
4
5
Fig. 2.1 Diagrammatic representation of the visual classification criteria used to evaluate the root system of soybean. Nodule score is judged by the number of effective nodules in the crown-root zone (regarded as the region 5 cm below the first lateral roots) and elsewhere on the root system. After]. Brockwell and R.R. Gault (personal communication) adaptation of the scheme devised by Corbin et aL (1977) for chickpea.
first lateral roots; this may be as much as 10 cm below soil level, depending on sowing depth) and elsewhere on the root system (Fig. 2.1). Effectiveness of nodules can generally be gauged by the degree of pink or red coloration of N2-fIxing bacteroid tissue inside each nodule. As a general rule, white or green nodules are inactive and would not be considered when classifying currently active nodulation. The rankings depicted in Figure 2.1 and described in Corbin et al. (1977) should be regarded as a guide only; they should be reconsidered for other species in different environments. Ideally, visual ratings should be consistently done by one person throughout an experiment, but jf more than one person is involved, division of labour should be on the basis of replicates and not treatments. The procedure involves carefully digging-up 20 plants at random across a crop (ensuring the root system and nodules are recovered) and scoring each plant using a predetennined classification criteria. The scores from all plants are added and then divided by 20 to obtain a mean nodule score. A mean nodule score of: 4 - 5 represents excellent nodulation; excellent potential for Nz fL'Cation 3 - 4 represents good nodulation; good potential for fixation 2 - 3 represents fair nodulation; N2 fixation may not be sufficient to supply the N demand of the crop. o 2 represents poor nodulation, little or no Nz fixation.
7
3 ANALYSIS OF NITROGEN
Regardless of the method used to measure N2 fiXation, it is necessary to determine amounts of total plant and crop N if inputs of N by N2 fixation are to be quantified in terms of kg N/ha. Evaluation and interpretation of N2 fixation data can also be assisted by measurements of soil N status. Procedures which have been found to be most useful in the authors' laboratories for accurate and reproducible measures of plant and soil N will be detailed in this chapter. The analytical methods described have been adapted to include precautions necessary to allow the precise measurement of low levels of 15N (Table 6.1; see Bergersen 1988), but they are also suitable for N analysis for all purposes.
3.1 Total plant nitrogen There are two methods upon which all commonly used analyses are based. The first is the oxidative method based on the original Dumas technique, in which organic material is oxidised in the presence of copper oxide to produce N2 gas, the volume of which is measured. Incomplete combustion can be a problem with this method (only 70-800Al of the sample is converted to N2 without mixing during combustion, 900/0 with mixing, and up to 99% conversion with addition of potassium perchlorate; Fielder 1984) and it may not be suitable for very precise determinations of low levels of 15N, particularly if there is variation in 15N abundance or dry matter N content between different plant tissues and there is insufficient care taken in subsampling (section 3.1.2.2). Commonly, the 'wet' Kjeldahl digestion is used. In this, organic and mineral N is reduced to NH3 in hot, concentrated sulphUric acid in the presence of a catalyst. The NH3 is recovered by distillation or diffusion and estimated by titration or colorimetrically (Bergersen 1980).
3.1.1 Sampling Difficulties in obtaining accurate estimates of crop dry matter and N content generally result from sampling errors rather than errors associated with subsequent analyses. The principles of plant sampling and subsampling are discussed by Hunt et aL (987). Plant samples should be collected from the field using a predetermined pattern, which should be followed for all plots or sampling areas. Generally, it is preferable to collect samples from treatment replicates as fixed lengths of rows (e.g. 1 m) or quadrat areas (e.g. 300 x 300 mm). Sometimes it will be necessary to use individual plants, but this usually gives less precision and if small numbers are involved, can bias the estimate (see Hunt et al. 1987). It is desirable also to include roots in the analyses. However, in many soils, recovery of roots may be so difficult that the analysis must be confined to above-ground plant parts, all of which must be included. 8
3.1.2 Preparing samples for analysis 3.1.2.1 Drying Plant samples must be dried to constant weight at 75°C (usually for 48 hours) in an air circulating oven. Very bulky samples should be spread on metal trays and returned to the bags when dry. Dry weight of the total sample is immediately recorded. 3.1.2.2 Subsampling and preparation for digestion Weighed, dry samples should be chopped or coarsely ground. A suitable implement is a Wiley Mill No. 3, fitted with a 1 mm screen and a hopper for feeding bulky samples. The total ground sample is then thoroughly mixed on a sheet of paper or plastic and a sub-sample of 5-10 g stored in a screw-capped container. The entire sub-sample is later ground, using a finer screen on the above mill, or preferably, ground to a fine powder in a hammer mill fitted with a 0.2 mm screen. Alternatively, a laboratory ring grinder (e.g. Roklabs Pty Ltd, Auckland, N.Z.) produces very finely ground samples. Finely-ground sub-samples are returned to the container and stored dry until analysed. Mills and grinders should be cleaned between samples using an air jet or brushed out carefully. This is particularly important when 15N analysis is to follow. Samples
for determination of natural abundance of 15N should be ground in batches at separate times from 15N enriched samples, and extreme care taken to avoid contamination between samples (see Bergersen 1988). In wet or humid climates, finely ground samples should be again dried to constant weight and thoroughly mixed before analysis. Well-mixed sub-samples of about 300 mg of finely ground plant material are weighed to within ±0.001 g and transferred to the digestion vessels (see Table 3.1 for appropriate sample size for different tissues). At all stages in preparation of samples, it must be remembered that non-uniform sub-samples are a major source of error. All material should be thoroughly mixed before sub-samples are taken, Vibration during storage leads to non-uniformity within containers, even when the contents were Originally well-mixed. The fine and coarser material which separate upon storage often differ in both N concentration and 15N abundance (G,L, Turner, unpublished data),
3.1.3 Digestion
3.1.3.1 Reagent Concentrated analytical grade sulphuriC acid (from a freshly-opened or protected bottle) Potassium sulphate (to raise the boiling point) Powdered metallic selenium
1L
100g Ig
Place the solids in a 5 or 10 L Erylenmeyer flask Selenium is toxic and care must be taken to avoid breathing fumes and to use safe disposal practices. Add the acid slowly, avoiding drips. The normal procedures for use with strong, fuming acids are 9
usually adequate. Heat the flask to 200°C in a large tray of sand, of sufficient volume to retain all the acid if the flask breaks. When dissolved completely, the liquid is straw coloured. Turn off the heat and stopper the flask with a rubber stopper bearing an air inlet tube filled with acid-soaked glass beads, to protect the flask contents from contamination with NH3 which is always present in laboratory air drawn into the flask as it cools. When cool, transfer the reagent to a tightly-stoppered bottle. (Note: Smokers are a hazard: tobacco smoke contains free NH3 and other N-containing materials. Also, volatile nitrogenous compounds should be stored well away from digestion reagent.) The reagent described above has been found to be as good as, or better than any published formulations containing other catalysts such as Hg or eu. Complete recovery of N from compounds such as tryptophane or nicotinic acid is usual when digestion is continued for 1 to 2 hours after clearing. 3.1.3.2 Apparatus Although conventional digestions in long-necked flasks are still used, as well as small-scale digestions in 100 mL Erylenmeyer flasks on temperature-controlled, electrically-heated hot plates (Bergersen 1980), the following methods are preferred when 15N analysis is to follow. Digestion vessels for plant material are standard Quickfit Pyrex tubes with standard taper (24/29 mm) tops and ground stoppers. The internal diameter is approximately 25 mm, the outside diameter 27 mm and the height 170 mm. (Note: Some manufacturers supply tubes of different dimensions; use the appropriate tubes for the hole dimensions of the digestion block.) It is convenient to transfer weighed (approximately 300 mg) samples of finely ground plant material to a set of numbered tubes; stopper and store them in a rack until digestion begins. The tubes are heated in a metal block, bored to accept the digestion tubes with a clearance of about 1 mm when cold, and to a total depth about 30 mm. The metal blocks may be heated directly from an embedded heating element as in several commerCially-available units (e.g. Fig. 3.1), or a block may rest on an electric hot plate. If workshop facilities are available, digestion blocks can be constructed of brass (more resistant to spilt acid than aluminium) or of cast iron and the surface covered with compressed insulating material to minimise radiant heating of the upper parts of the digestion tubes. Photographs and the circuit diagrams of the electronic controllers of such a unit can be obtained on request from the authors. Digestions should be carried out in a well-ventilated fume hood. As will be seen below, well-conducted digestions should generate little acidic vapour once initial oxidation is completed. The digestion block temperature should be adjusted with full load when the fume hood is operating with the door lowered to the level of the tops of the tubes (Le. maximum cooling, see Fig. 3.1). 3.1.3.3 Procedure (a) Switch on the digestion block heater and bring it to the digestion temperature, as indicated by a thermometer placed in an unused tube near the centre of the block. The tube temperature is usually a few degrees below the block temperature. Control of digestion temperature is very important. On no account 10
Fume hood door
Ele~t
mams
I
Thermocouple
Fig. 3.1 Apparatus used in the digestion of plant material for total nitrogen and 15N detenninations. See text for description.
should 320°C be exceeded and 280-31O°C has proved best. Higher temperatures than these may produce faster digestion, but there is loss of N due to thermal decomposition of (NH4)2S0 4 in the acid, even when the refluxing of acid is controlled well below the top of the tubes. Such losses, even if barely detectable, discriminate isotopically and lead to raised 15N analyses in the digests (Le. the N lost is depleted in 15K; Bergersen 1988). Digestion of 300-500 mg of plant material usually takes approximately 16 hours at 300°C. (b) When the block is hot, remove the stoppers from 4 tubes and add an appropriate
volume of digestion reagent (Table 3.1) to the weighed, finely ground sample in the digestion tube, using a bulb pipette or glass dispensing unit (such as the EMIL Pressmatic Dispenser, Mk2); do not pipette digestion acid by mouth, or allow drips to run down the outside of the tubes. (c) Place the tubes in the bot digestion block and watch carefully because initially there will be charring and frothing. Control of frothing is best achieved by adding a drop of cold distilled water from a clean glass pasteur pipette fitted with a rubber bulb. If the drop is allowed to fall into a rising froth plug, near the wall of the tube, the plug is broken or collapsed and rises no further. If this does not succeed lift the tube from the block before the upper half of the tube is contaminated. When the froth collapses, continue heating. It may be necessary to repeat the water treatment once or twice, until the initial frothing ceases. Then proceed with the next 4 samples. (Note: frothing is greater if the tubes are placed in the block before it reaches operating temperature.) (d) When the entire batch of samples is digesting smoothly, check that the refluxing no higher than 70 mm above the surface. If it is higher, reduce gestion temperature slightly, or preferably, increase the draught of air by ing the fume hood opening and/or adjusting the fume hood exhaust fan this will decrease the temperature of the upper half of the digestion 11
acid is the diadjustspeed; tubes.
Once these adjustments have been made, they should be the same for all subsequent digestions. There may be some charred material adhering to the glass above the area of the tube wall which is being washed with refluxing acid. If so, remove the tube from the block and carefully swirl the contents to wash down the charred material. This is hazardous and not usually successful without practice. Therefore, cool the tube in a rack and then wash down the walls of the tube with several minimal quantities 0-2 mL) of distilled water directed at the contaminated surface. Do not allow the tip of the wash bottle to contact the inner surface of the tube (i.e. avoid contamination). After each small volume of water, swirl the digesting fluid gently to mix with the acid, which may splutter dangerously if the water directly penetrates the surface, instead of running down the tube wall. Return the tubes to the digestion block and continue heating. If the volume of added water is too great, avoid excessive boiling by reducing the block temperature to 150°C until all the water is evaporated, then return to 310°C and continue the digestion for 1-2 hours after the digest becomes colourless. For some plant samples which contain much mineral material (especially Fe), the digest may remain yellow-straw coloured even when digestion is complete. This colour is readily distinguishable from the pale brown colour due to traces of undigested organic material which is seen just before digestion is complete. (e) When digestion is complete, remove the tubes, stopper with clean, dry stoppers and cool.
CD Next add 10 mL of distilled water gradually, with swirling, to prevent overheating. Transfer the diluted digest quantitatively to the volumetric flask (Table 3.1), using a small glass funnel (well washed between samples) and several small volumes of distilled water washed down the sides of the tube and Table 3.1 Sizes of plant samples, digestion, dilution and distillation volumes for the provision of at least 4 replicate distillates containing about 1 mg of plant nitrogen for mass spectrometer analysis. (Based on field-grown soybeans.) Dry sample (mg)
Digestion reagent
Diluted digesta
Volume distilledb
(mL)
(mL)
(mL)
1
250 250 300 300 300 500
0.5
1000
5 5 5 5 5 7 10
50 50 50 50 25 25 25
5 5 5 5 5 5 5
%N
Seed (3.5-6)C
Leaves (1.5-4.5) Entire shoot (1.5-3.5) Entire plants 0-3) Roots (0.5-1.5)
6 5 4 3 2
a Volumes of dilutions prepared in volumetric flasks. b Accurate pipetted volumes C5±o.05 mL.). C Range of expected %N values for each plant tissue.
12
Nin distillate (mg) 1.5 1.25 1.2 0.9 1.2
1.0 1.0
swirled to transfer every trace of add from the tube to the flask. Finally wash the funnel into the volumetric flask and add water to the mark. Stopper the volumetric flask and thoroughly mix the contents.
3.1.3.4 Adjustments for nitrate Plants usually contain nitrate. When its amount is small, there is usually sufficient carbon present to effect its reduction to ammonia during digestion. However, this may be variable and if there is reason to suspect that significant amounts of nitrate are present it is advisable to modify the digestion procedure. There are several suitable methods--the Simplest is to convert the nitrate into nitrosalicylic acid, which digests readily to produce ammonia. The weighed sample in the digestion vessel is well mixed with 1-3 mL of a solution of pure salicylic acid (5% w/v in concentrated sulphuriC add) for at least 20 minutes. Sodium thiosulphate (0.3-1 g) is then added and the mixture gently heated until fuming. Then it is cooled, digestion reagent is added and digestion is carried out as described preViously.
3.1.4 Recovery of ammonia by distillation and estimation by titration 3.1.4.1 Reagents A. Boric acid/indicator
(This reagent contains less boric acid than usually described. It is designed for distillations of 1-5 mg of NH;;-N when mass spectrometer analysis is to follow.) Boric add (analytical grade) 10 g Distilled water 1L Mixed indicator 10 mL (4 mL of 0.1% methyl red + 20 mL of 0.1% bromcresol green, each dissolved in 95% ethanol). When dissolved, adjust the bulk solution to neutrality with 1% NaOH (Le. until the indicator is the grey-red end point colour). B.lOM NaOH NaOH (analytical grade) Distilled water
400 g 1L
C. Phenolphthalein 0% w/v in 50% ethanol).
D. Standard borax Water at 55°C is saturated with borax (Na-borate; Analytical grade), filtered and allowed to crystallise. The crystals are recovered, redissolved in water at 55° to saturation and again crystallised. '!be crystals are recovered, and successively washed with ice-cold distilled water, dry ethanol, and dry diethyl ether, before drying on a filter paper. The crystals are finally equilibrated over a solution of 13
distilled water, saturated with NaCl and sucrose, in a closed container for at least 24 hours. They should be stored also in the same conditions. E. Standard HCl. Approximately N/28 HCI: 31.8 mL of analytical grade HC} diluted to 1 L with distilled water and stored in a tightly stoppered bottle. One mL of exactly N/28 HCl (0.03571 N) is eqUivalent to 0.5 mg N. It should be standardised as follows: Dissolve approx. 0.3 g of standard borax (weighed to ±o.OOO5 g) in 50 mL of distilled water in a volumetric flask. An aliquot of 10 mL of this solution is titrated with the acid to be standardised, using one drop of 0.1% ethanolic methyl red as indicator. weight of borax X 200 Normality of acid = 190.72 x mL of acid used Alternatively, a commercial standard solution of HC} may be used after accurate dilution to give the desired normality. 3.1.4.2 Apparatus Several commercially available stills are suitable for recovery of NH3 from Kjeldahl digests (e.g. Fig. 3.2a and b). The NH3 passing from the condenser in a stream of condensed steam is trapped in boric acid-indicator solution. An adaptation of the commercial designs which has proved superior for use when 15N analysis is to follow, is shown in Fig. 3.2d. The increased volume of the sample chamber diminishes the hazards of alkaline mist, entrapped in the steam flow, affecting the titration which follows distillation. The other stills are available as standard items from suppliers of Quickfit glassware. The steam generator is assembled with Fig. 3.2c as a guide, from any standard laboratory glassware. If ground glass joints are not available, improvisations with rubber stoppers and glass tubing are quite satisfactory. Although an electric heating mantle is preferred because boiling can be better-controlled (C, Fig. 3.2c) heating with a gas burner is acceptable, providing boiling is steady. This is assisted by the use of oven-dried anti-bumping granules added to the steam generator as required. Flow and temperature of the condenser cooling water should be such that condensate drips from the condenser at about 30°C. If this cannot be done easily, reduce the flow of steam by adjusting the heating rate, or by partially venting the steam from the generator. Titration is done in the standard way with a suitable burette, graduated to read in units of 0.01 mL. Suitable types may also be fitted with a reagent reservoir and filling mechanism. While this is an advantage, it is not an essential feature. Alternatively an electronically or manually controlled piston burette may be used. These can give more precision to titrations, making titration error a negligible part of the overall error of estimating N. A suitable instrument is the Dosimat (655 Dosimat; Metrohm, Herisau, Switzerland, which can if desired be coupled to an automatic unit for pH titration; Metrohm Titrator E526). 14
s
1:I
(a)
(b)
Waste Distilled water
t
X, -Vent Steam~~~
3 (d)
(c)
.
Waste
I
Modified Markam still
Waste
Fig. 3.2 Apparatus used in the distillation and recovery of ammonia (after Bergersen 1980). (a) Quickfit semi-micro Kjeldahl assembly (digestion flask (A) of 50 or 100 mL capacity). Cb) Quickfit Markham still (type 46 Mc). (c) A steam generator assembly including a 2-3 litre distillation flask (B) heated with an electric mantle (C), and a supply of distilled water connected through a two-way stopcock (Xl)' (d) Modified Markham still. See text for description.
3.1.4.3 Distillation Ca) Before use, the still should be thoroughly cleaned. A chromic acid wash, followed by rinsing in 10% Cv/v) Hel and several washes in hot water, followed by several rinses in distilled water, is suggested. The steam generator flask should be cleaned in similar fashion, before filling with distilled water to half its volume. Add 0.5 to 1 rnL of concentrated H2SOiL of water to prevent contamination of the steam from traces of dissolved NH 3. The level of water in the steam generator should not be allowed to fall below 50% of the initial volume. Pass steam through the distillation assembly for 10 minutes before the first distillation. 15
(b) Place 10 mL of boric acid-indicator in a 150 mL Erylenmeyer flask (F, Fig. 3.2)
and place under the condenser outlet with the tip immersed in the solution. (c) Allow steam to flow through the still continuously by opening X 2 and closing Xl (Fig. 3.2c) on the steam generator, until the entire still is hot and all condensed droplets on the inner surfaces have been vaporised or flushed off with freshly condensing water. (d) Place 5 mL (see Table 3.1, so that sample contains at least 1 mg N) of diluted digest in the entry port (S, Fig. 3.2a, b, d). Run the liquid into the still by raising the stopper slightly and rinse in slowly with water and a drop of phenolphthalein indicator solution. (e) Slowly and as in (d) add sufficient lOM NaOH to render the digest alkaline to phenolphthalein (pH > 11). For 5 mL of digested plant material, 8 mL is usually sufficient. (t) Continue passing steam until at least 80 mL of distillate has collected in the
receiving flask. Then lower the flask and rinse off the tip with distilled water from a wash bottle. This large collection volume ensures completeness of recovery, but it should be increased if the volume of sample is greater than 5-10 mL. Observe the precautions noted above, with reference to condensate temperature. Cg) Remove the flask for titration of the distillate. Ch) Vent the steam generator by opening Xl and dose the steam line X2 (Fig. 3.2c). Fill the entry port with distilled water. As the steam condenses in space E (Fig. 3.2c), the partial vacuum which is generated sucks the residue of the distillation into E. Immediately lift the stopper (S, Fig. 3.2a, b, d) and run in the distilled water and repeat this washing twice. Finally, discharge waste and washings collected in J (Fig. 3.2b, d) through the waste lines and restart the steam flow as soon as possible. Note: This procedure may leave some residual NaOH adhering to the glass inside the apparatus. Because of this it is essential that the condenser tip be immersed before adding the next sample so that loss of :N'H3 by premature distillation is avoided (see Cb) above). It is also essential that all condensed steam in the upper part of the apparatus be removed in the flow of hot steam before adding the next sample. Hang-up of NH3 dissolved in condensed water can be a problem, slowing completion of recovery. When samples containing 15N are being distilled, additional precautions must be observed in order to avoid possible contamination from trace amounts of highly labelled NH3 remaining in the still. Some workers advise the distillation of about 15 mL of ethanol between samples to remove traces of NH3 adhering to the glass surfaces of the still. In our laboratory, no cross-contamination between enriched samples has been encountered with the modified Markham still (Fig. 3.1 d), provided a total of about 80 mL of distillate is collected for each sample. Samples for measurement of natural abundance of 15N should be distilled in apparatus dedicated to this purpose. Samples enriched in 15N should be processed with a different still and it is also advisable to distil a blank between samples: the upper parts of the apparatus should not be allowed to cool whilst contaminated with residual NH3 from an imperfectly recovered sample. 16
3.1.4.4 Titration When sufficient distillate has been collected (80-100 mL), the tip of the condenser is rinsed into the flask and the contents immediately titrated with standard HCI until the indicator reaches the grey-red end point. The titration volume is recorded and one more drop added, after which the indicator should have reached a definite pink-red colour. The calculation of N present is: normality of standard. HCI x 0.5 x titration (mL)
mgN-
0.03571 The titrated distillate is a source of N for estimation of lSN. If this is to follow, each distillate should be acidified with 1-2 drops of 1% H2S04 and its volume reduced by boiling until it contains apprOximately 1 mgN/mL. (Note: avoid concentrating samples to dryness; see Table 6.1.) Samples may then be stored in sealed containers until analysis.
3.1.5 Colorlmetrlc estimation ofN in distillates The most convenient colorimetric assay for ammonia-nitrogen is described below. ~g N in a 1 mL sample.
This procedure reliably measures up to 14
3.1.5.1 Reagents A.
B.
Phenol Na nitroprusside Distilled H2 0
50 g 0.25 g 1L
NaOH 25 g 2.1 g Na hypochlorite (28.2 mL of B.D.H. Analar solution containing IN hypochlorite in O.IN NaOH or an eqUivalent volume of another convenient source of hypochlOrite in NaOH.) Distilled H 20 1L
For use, dilute both A and B (1 part) with 4 parts of distilled H 20. C. Standard (NH4)ZS04 (20 ~g N/mL) (NH~2S04
0.0943 g
(analytical grade)
11.
H 20
3.1.5.2 Procedure Make the distillate to 100 mL in a volumetric flask. If the quantities recommended in Table 3.1 have been used, the distillate will contain about 1 mg of N, so 1.0 mL of the distillate should contain about 10 ~g of N. Place 1.0 mL in a 20 mL volume test 17
tube. Prepare a set of standards in similar tubes by pipetting 0 (blank), 0.25, 050, 0.75 and 1.0 mL of solution C and adding sufficient water to bring volumes to 1.0 mL. Add 5 mL of each of diluted reagents A and B to each tube and leave the colour to develop for at least 30 minutes. Record the optical absorbance at 625 nm with a suitable spectrophotometer, prepare the standard curve and read off the values of the distillates from this, and calculate the N present in the distillate as follows: Ilg N from standard curve mg N in distillate = 10
3.2 Total son nitrogen Studies of N2 fIxation in the field are frequently aided by knowledge of the soil N status. The follOWing methods are suitable for use when 15N analysis is to follow.
3.2.1 Sampling These analyses are similar to analysis of total N in plant samples and the same principles of sampling and subsampling apply. There are however, some important differences. They are based on weighed oven-dried samples of soil, bur in addition the relationship between bulk density and moisture content needs to be recorded. To do this, samples are usually taken with a cylindrical coring device of known diameter to a defined depth. This volume of soil is weighed accurately, broken up and well mixed, sieved and a weighed sub-sample (3-5 g for top soil) is taken for drying, weighing and digestion. Samples from lower in the profile (below 30 cm) will usually contain less N. Soil samples which are too wet for sieving and sub-sampling are usually slurried with water and a sub-sample of known proportion by volume used for the analysis.
3.2.2 Digestion Digestion reagent (see Section 3.1.3.1) (5-10 mL) is added to the dry soil sample in a standard Kjeldahl flask and digested with frequent agitation to break up the mineral material which remains as a dense mass in the bottom of the vessel. Tube digestions are only possible if a digestor block is available with large holes to accept tubes of 40-50 mm diameter. When digestion is complete, the entire contents are washed into a 500 mL round-bottom flask with a single side-arm (A, Fig. 3.3) and the residue extracted with several portions of water, allowed to settle and the supematant decanted and added to the digest.
3.2.3 Distillation and estimation of N Distillation and titration or colorimetric analysis are done as described above (Sections 3.1.4 and 3.1.5).
3.3 Extractable mineral nitrogen Of greater importance in N2 fixation studies is the level of soil mineral N (nitrate and ammonium). Mineral N is labile and subject to isotopically discriminating biological and chemical reactions during transport and storage. Furthermore, the levels of N 18
Fig. 3.3 Modified apparatus used in the extraction and steam distillation of nitrogen from soil. See text for description.
Steam
I
LLu:.J cm 5
o
extracted can change rapidly following sampling (WestfaIl et al. 1978). The following procedures have been found to minimise these effects and give good isotopic agreement between the mineral N extracted from soil and the N assimilated by plants from the same soiL
3.3.1 Sampling Samples are collected as cores as described (3.2.1) above. They are immediately chilled in ice, stored at -lOoe as soon as possible thereafter and kept frozen until thawed for analysis. Alternatively, the biological and chemical reactions referred to above may be prevented by adding the extraction reagent and mixing thoroughly immediately after sampling (e.g. see Herridge et al. 1984). The salts in the extractant effectively prevent biological modifications of the mineral N. In this case, parallel cores are taken for estimations of fresh weight, dry weight and bulk denSity.
Note: Air-dried samples should be avoided, since air-drying elevates the ammonium to nitrate ratio (which may be differentially enriched in 15N) and increases analytical errors by substantially raising the levels of mineral N extracted (see Westfall et al. 1978). If soil samples are too wet for sieving and mixing when taken from the coring device, a 300 g bulk sample is mixed with 100 mL of distilled H2 0 to form a 19
slurry. Two aliquots (140 g each) of the slurry are weighed and 60 mL of 35M KCI added to bring the aqueous suspension to 2M. Record the total volume of liqUid added.
3.3.2 Extraction 3.3.2.1 Reagents A. Extractant
2M KCI (7455 g/L) B. Alkali Prepare a quantity of freshly-calcined heavy magnesium oxide (heat to 400-450°C overnight, in shallow layers in ceramic dishes. Cool and store in a tightly-stoppered bottle in a desiccator for no more than 1 week to avoid formation of MgC0 3). Immediately before use, prepare a suspension, 121% (w/v) in distilled H20. C. Devarda's Alloy (BDH Laboratory Chemicals, Poole, England)
Grind finely in a pestle and mortar. (Note: this material is sometimes of variable quality and the amount used may need to be increased in order to ensure completion of the reduction of nitrate to ammonia. Grinding finely increases the effectiveness.) D.
Boric Acid/Indicator: As described in 3.1.4.2A.
3.3.2.2 Apparatus A. Erlenmyer flasks (500) mL with rubber stoppers.
B. Reciprocating or wrist-action shaker. C. Glass funnels and Whatman No. 1 filter paper..
D. Steam distillation apparatus such as illustrated in Figure 3.3. Alternatively an equivalent apparatus may be assembled from Quickfit components.) The double splash-head shown in Figure 3.3 minimises the danger of alkaline mist entering the steam flow during Devarda's alloy reductions. The steam generator used with the Markham still (Fig. 3.2c) is used to supply steam at the port indicated. E. Wide-mouthed 10 mL delivery pipette made by filing away the tip of a standard pipette. 3.3.2.3 Procedure Shake 100 g of sieved dry soil (or equivalent weight of wet soil) with 100 mL (v) of
20
2M KCl for 1 hour in stoppered flasks. Filter the slurry and measure the volume of the extract (x mL and correct all results on the basis of v/x). If the soil is infertile, or is from lower levels of the soil profile, it may be necessary to increase the weight extracted in order to recover sufficient N for isotopic analysis. Keep the ratio of soil to extractant as above (lOO g/100 mL). 3.3.3 Distillation of NH3
Place the extract in the flask of the distillation apparatus and place 10 mL of boric acid-indicator in a 150 mL Erlenmeyer flask beneath the condenser outlet. Then add by wide-mouthed pipette, through the steam side-arm 10 mL of the MgO suspension, so that it runs beneath the surface of the extract. Connect the steam line and pass steam vigorously until at least 80 mL of distillate is collected. Remove the collecting flask and replace with another. 3.3.4 Reduction of nitrate and distillation of NH3
With the condenser tip immersed, carefully add 0.5 g of Devarda's Alloy through the steam sidearm. Immediately connect the steam line and recommence distillation until a further 80 mL is collected. Caution: At this stage it is important to avoid rendering the steam flow alkaline with mist caused by the effervescence. This will produce titration errors. The problem is usually indicated by unexpectedly large titrations and/or unusual colour changes in the indicator during distillation. If these are noted, redistillation of the distillate as for ammonia (Section 3.3.3) is indicated.
3.3.5 Estimation of N This is done by titration (as in Section 3.1.4.4) or colorimetrically (3.1.5).
21
4 XYLEM-SOLUTE TECHNIQUE
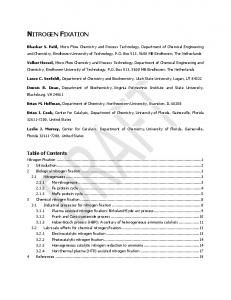
4.1 Principles behind the method Xylem sap carries N-containing compounds from the roots to the shoots of field-grown legumes originating from (i) nodules as assimilation-products of N2 fixation, and (ii) soil mineral N taken up by the roots (Fig. 4.1). If there are well established differences in xylem N-solute composition between fully symbiotic plants and non-nodulated plants which are totally dependent upon soil N, it should be possible to devise an assay system based on analysis of xylem sap to assess the extent to which plants rely on N2 fixation or soil mineral N. Nitrate and ammonium ions are the two most important forms of N taken up by plant roots in both fertilised and unfertilised soils. In most arable, agricultural soils where nitrification takes place rapidly, nitrate is believed to be the predOminant N source for plant growth. Solutes derived from soil mineral N under these conditions will be transported in the xylem as free nitrate or as organic products of nitrate reduction (principally the amino acid asparagine) in the root (Fig. 4.1). Ammonium nutrition, however, could become important when legumes are used as catch-crops in rice-based cropping systems or when grown in acid soils or in soils with a high C : N ratio. In these instances ammonium must be rapidly incorporated into organic compounds (largely amino acids) to avoid its toxic action in cells and will be exported to the shoot in the xylem in this form. A wide range of different N-solutes have been identified in xylem exudates collected from effectively nodulated legumes solely dependent upon N2 fixation for growth. However, generally one or two N-rich molecules, characteristic of the species, dominate the spectrum of organic N compounds transported to the shoots in xylem sap (Fig. 4.2). Many legumes of tropical origin (Table 4.1) transport the bulk of their fixed N from nodules in the form of the ureides, allantoin and allantoic acid (e.g. soybean, Fig. 4.2). Ureides have also been detected as minor components of xylem sap in some species (Table 4.1), but since exudate samples were collected in some instances from field-grown plants whose symbiotic status was unknown, the significance of ureides to the N-economy of these plants remains uncertain. In most of the other legumes which have been studied, nodule products are exported predominantly as the amides, asparagine and glutamine (e.g. groundnut, Fig. 4.2).
4.1.1 Ureide-exporters Root nitrate reductase activity characteristically assumes a minor role in assimilating nitrate in legume species which export ureides from their nodules. As a
22
N-TRANSPORTTO SHOOT
N-TRANSPOAT TO SHOOT
bl AMIDE-EXPORTER
ai UREIDE-EXPORTER
NODULE
I\OOULE
NO,
ROOT
Fig. 4.1 Pathways of nitrogen transport from the nodulated root systems of Ca) ureide-exporting, and Cb) amide-exporting legumes reliant on both symbiotic N2 fIxation and nitrate uptake from soil for growth. The areas indicating nitrate reduction are proportional to the relative extents of nitrate metabolism occurring within the roots of species from each class of legume (after Ledgard and Peoples 1988).
consequence, much of the nitrate taken up is transported to the shoot in an unreduced form (Fig. 4.l.a). The composition of xylem exudate of nodulated plants therefore changes progreSSively from one dominated by ureides to one dominated by nitrate and amino compounds as the plant's dependence upon N2 fixation declines in response to increased uptake of nitrate by the roots (Fig. 4.3a, b). Such changes in Aylem N-solute composition have been found to be so predictable that the relative abundance of ureides (estimate of ureide-N as a proportion of total xylem sap N, e.g. Fig. 4.3c) of field-collected samples has been used as a measure of the Nz-fixing status of a number of legumes within this broad group of plant species (Herridge et al. 1984; Norhayati et al. 1988; Rerkasem et al. 1988).
4.1.2 Amide-exporters The response of amide-exporting legumes to changes in N-source is less well defined than ureide-producing species since the products of Nz fixation and nitrate uptake are essentially the same (Fig. 4.1b). Some amide-exporters have a high capacity for nitrate reduction in their roots and the spectrum of N-compounds transported in the xylem stream is not greatly altered if the source of N for groVv'th is changed from atmospheric Nz to soil mineral N (see Hansen and Pate 1987; Peoples et al. 1987). In other species however, the proportion of the nitrate reduced in the roots is much lower and there is a progressive increase in xylem nitrate and decrease in amide and amino acid content as plants increaSingly rely upon uptake of nitrate from the rooting-medium (Fig. 4.4a). Cnder these conditions, the relative level of 23
Table 4.1 Occurrence of ureides in xylem sap of nodulated legumesa.
Species in which ureides are major components of solute Nb
Species in which ureides have been detected as a minor componentC
Species in which ureides have not been detected
Albizia lophantba Cajanus cajan Calopogontum caeruleum Centrosema spp. Codariocalyx gyroides Cyamopsis tetragonoloba Desmodium discolor rensonii uncinatum Glycinemax Hardenbergia spp. Lablab purpureus Macroptilium atropurpureum Macrotyloma uniflorum Pueraria javanica phaseoloides Phaseo/us vulgaris lunatus Psophocarpus tetragonolobus Tedbegi spp. Vigna angularis mungo radiata triloba unguiculata umbellata Voandzeia subterranea
Albizia /alcataria Bossaiae aquifolium Erythrina variegata Flemingia congesta Gltricidta sepium Pisum arvense Sesbanta rostrata sesban Stylosanthes bamata Vicia erviJia sattva Viminaria juncea
Acacia alata auricula/armis extensa insauvts pulcbeJla Arachis bypogaea Bauhinia spp. Caesalpinia calothyrsus Calliandra spp. Cicer ariettnum Clitoria spp. Derris el/iplica Juncea spp. Lathyrus cicera sativus Leucaena spp. Lens culinaris Lotus corniculatus Lupinus albus angusli/altus cosentinii mutabilis Medicago minima sativa Mimosa pigra Pisum sattvum Sesbanta grandiflora Trifolium pratense subterraneum repens Vicia monantba /aba Zornia spp.
a Information adapted from Norhayati et al. 1988; Peoples et al. 1988b; unpublished data of M.B. Peoples, RR Gault, D.F. Herridge and B. Palmer. b 40% or more of total N of xylem sap estimated to be in ureides. c 10-25% of total N of xylem sap collected from glasshouse-grown or field plants estimated to be in ureides.
24
r····--- Groundnut - . .----
, -______ Soybean _______ ..~
100
asn 75 c
en
~
!
o
other
4-
50
o
.
asn
ureide
Cl.
E o u
asn 25
E Ql
>X
o
11
.....
~
detached
Fig. 4.2 The proportional composition of nitrogenous compounds in xylem exudates of fully symbiotic groundnut (Aracbis bypogaea L.) and soybean (Glycine max [L] Merr.) grown in water-culture. Xylem exudates were collected as bleeding sap from plants decapitated at either the top of the root, or at a site on the root below the lowest nodule, or from detached nodules (after Peoples et aL 1986, 1988a). Asn ~ asparagine, gin:; glutamine, asp = aspartic acid, 4--Megln :; 4-Methylene glutamine, other = other amino acids.
nitrate detected in xylem exudate may be regarded as being indicative of the contribution of soil N to plant growth (e.g. Fig. 4.4b). Before xylem-solute techniques can be utilised in the measurement of N2 fixation by field-grown legumes, three basic requirements are essential: (i) a means of sampling xylem N-solutes; (ii) a calibration curve which relates xylem solute composition to legume reliance on
N2 fixation in the presence of soil N; and (iii) an understanding of the advantages and possible limitations in the application of
the methodology.
25
Vacuum-extracted sap
Root bleeding sap 100
c: 0
:-2
N0 3
80
(J)
'::~;
a
0 Q.. -
E .::!! o r.n 60 (.)
60~
40[
~
~z
r.n?j(
40
EQ.l
>X
20:
20
I
amino acids
amino acids 0: 20
40
60
80
100
0
20
40
60
80
100
% plant N increment from N2 100,-------------------,
c
% plant increment from N2 8
4
2
N0 3 concentration in rooting medium (mM)
Fig. 4.3 Changes in the N-solute composition of xylem sap collected as Ca) root-bleeding exudate, or Cb) vacuum-extracted from stems of nodulated soybean fed a range of constantly maintained levels of nitrate, and (c) the relationship between the abundance of ureides and plant dependence upon N2 fixation. Relative ureide contents of root-bleeding sap (RBS) and vacuum-extracted sap (VES) are expressed as a proportion of total sap N (ureide-N + o:.-amino-N + nitrate-N). Derived from the data of Herridge (1984), after Peoples et al. C1988a).
4.2 Sampling of N-solutes It is possible to collect xylem exudate as it bleeds spontaneously from intact root stumps of crop legumes following decapitation of the shoot from both glasshouse-grown plants and from plants growing in the field in the humid tropics (e.g. Norhayati et al. 1988). It may be difficult, however, to recover root-bleeding exudate from field-grown plants in other environments. Pre-watering field plots may assist plants to bleed but this is not always convenient nor does it guarantee success. As a result, alternative methods for sampling xylem exudate have been examined. One technique for sampling N-solutes involves preparing aqueous extracts from plant tissue (Herridge 1982; Peoples et al. 1987). However, the procedure requires
26