J. Mar. Biol. Ass. U.K. (2007), 87, 313–320 Printed in the United Kingdom
doi: 10.1017/S0025315407055154
Methods for investigating measurement error in cetacean line-transect surveys Rob Williams*∫§, Russell Leaper†, Alexandre N. Zerbini‡ and Philip S. Hammond* *Sea Mammal Research Unit, Gatty Marine Laboratory, University of St Andrews, St Andrews, Fife, KY16 8LB, Scotland, UK. Present address: Pearse Island, Box 193, Alert Bay, BC, V0N 1A0, Canada. †International Fund for Animal Welfare, (IFAW), 87–90 Albert Embankment, London, SE1 7UD, UK. ‡National Marine Mammal Laboratory, Alaska Fisheries Science Center, NOAA Fisheries, 7600 Sand Point Way NE, Seattle, WA, 98115-6349, USA. §Corresponding author, e-mail:
[email protected]
∫
Line-transect estimates of abundance generally assume that distances and angles to animals are measured without error. Biased distance measurements will lead to corresponding bias in abundance estimates. Efforts to address this have been made, but measuring distance to cetaceans at sea remains problematic. Four distanceestimation experiments were conducted to explore relationships between estimated and measured distance. Heteroscedasticity was found in all four cases. Preliminary evidence suggested that an observer differed in the ability to judge distance to fixed, continuously-visible cues and ephemeral, cetacean cues, which calls into the question the common practice of using marker buoys as cetacean proxies in distance-estimation experiments. Two studies found visual estimates to be positively biased, and two studies found reticule measurements to be negatively biased. Suitable correction factors were developed to address systematic bias from visual estimates, but these varied widely among observers and were sometimes non-linear. Errors in three studies showed positive skew, suggesting that ranges were overestimated to a larger degree than they were underestimated. If reticule and photogrammetric measurements yield log-normally distributed errors generally, then a least-squares regression will always overestimate the correction factor, underestimate range, and overestimate abundance. Photogrammetric methods to measure range to cetaceans performed well, and their use is encouraged. When measurements cannot be made to all sightings, however, it is recommended that experiments be conducted that generate sufficient sample size (of the target species, across typical survey conditions, and beyond the maximum range that most estimates will be made during the survey) to assess error distributions, examine evidence for non-linearity, and to consider inter-observer differences. Distance experiments, and training on survey protocols, can be conducted using ships of opportunity prior to the beginning of a dedicated survey, which would improve observer efficiency while reducing the costs of dedicated vessel time.
INTRODUCTION A fundamental assumption underlying distance sampling techniques is that the relative locations of animals can be determined without error (Chen, 1998; Buckland et al., 2001; Palka & Hammond, 2001). In general, line-transect methods have been considered to be robust to small random errors in distance estimates, as long as no systematic bias is present (Chen, 1998; Chen & Cowling, 2001). However, more recent work has challenged this relaxed assumption. Marques & Buckland (2004) found that random error in perpendicular distance measurements caused overestimation of density in both simulated and real datasets. Addressing measurement error in sightings surveys for cetaceans is critical since observers are generally poor at judging distance accurately at sea (Schweder, 1997; Baird & Burkhart, 2000) but distance estimates are a key data item in analysis. The probability of detection as a function of distance must be estimated from the sightings data. For analysis based on perpendicular distances, bias in distance estimates leads to a proportional bias in the resulting estimate of effective strip Journal of the Marine Biological Association of the United Kingdom (2007)
width. Errors in distance data also result in increased variance and may lead to the fitting of an inappropriate detection function. Researchers have compared true and estimated distances to wooden stakes, and found systematic bias that took the form of underestimating distance (Alpízar-Jara et al., 2001). This problem with distance estimation caused much greater bias in the resulting abundance estimates than did another common source of error in line-transect surveys, namely the tendency for observers to introduce random errors by rounding estimates to preferred values. For radial distance methods based on counts within an area, bias in the final abundance is approximately inversely proportional to the square of any bias in distance estimates. Such methods are also biased due to distance estimation error even if the distance estimates themselves are unbiased. Borchers et al. (2003) found that bias in conventional cue counting estimators of abundance becomes substantial when the error cross-validation is larger than about 10%. Thus, measurement error clearly has the potential to introduce large bias in abundance estimates from linetransect sightings surveys. However, it has received
314 R. Williams et al.
Measurement error in cetacean sightings surveys
Table 1. Summary of four distance-estimation experiments conducted during this study. Study
Cue type
1
Fixed (ice, rocks, zodiacs etc.) and transient Opportunistic (whales, penguins etc.) Fixed (vegetation and life preservers) River dolphin survey Transient (whales) Cetacean survey Transient (whales) Cetacean survey
2 3 4
Survey type
surprisingly little attention at the data collection stage. Some analytical techniques have been developed to address inaccurate distance estimates (Schweder, 1997), but these post-hoc analytical approaches will always be less robust than actually obtaining accurate measurements in the first place. Most shipboard cetacean sightings surveys either rely on estimates of distance using the naked eye or from binoculars marked with reticules. (Aerial surveys often use clinometers to measure range, and are beyond the scope of this paper.) Reticule marks allow researchers on shipboard sightings surveys to measure the angle of dip from the horizon to an animal. This angle can then be used to estimate distance based on the height of the platform. Trained observers can collect unbiased distance estimates to stationary targets using reticule binoculars under good conditions (Lerczak & Hobbs, 1998). Without adequate training, however, these measurements can introduce a systematic bias that may vary among observers (Thompson & Hiby, 1985). Sightings surveys frequently devote substantial time to training and testing observers in distance estimation (e.g. Schweder, 1997; Hammond et al., 2002). However, observer training is limited by the expense of ship time and the difficulties of creating realistic experiments. Such experiments generally use fixed targets of known size that are not necessarily representative of a brief surfacing of a real cetacean under survey conditions. Cetacean sightings surveys may differ in several respects from the conditions under which experimental data typically are collected. There may be qualitative differences in the way that the human eye perceives distance to fixed, continuouslyvisible targets of constant size such as floats, and transient cues such as a whale’s blow or body. Similarly, observers using reticule binoculars may have more time to measure range to fixed targets than to cetaceans, thereby improving apparent performance. Environmental conditions such as sea state may remain constant while distance experiments are conducted, but vary throughout the survey. Correcting for bias at an analysis stage based on such experiments is not straightforward. Simple linear correction factors may be overly simplistic if underlying relationships are non-linear. Errors may be observer specific and also related to unmeasured covariates, such as sea state, target size, aspect or bearing. Addressing these problems statistically will require a large number of observations. However, the expense of ship time on systematic surveys may make it difficult to collect sufficient sample sizes. One recent technological advance is the development of photogrammetric methods for measuring range (Leaper & Gordon, 2001). This technique involves mounting a Journal of the Marine Biological Association of the United Kingdom (2007)
Eye height (m)
Region
Measurement Estimation method method Observers
13.8
Antarctica
Naked eye
1
5 9.2 18
Amazon Range-finder Naked eye Alaska Video Reticule Antarctica Video Reticule
6 1 1
Video
video camera to binoculars, and allows unbiased distance measurement to free-moving cetaceans based on the same trigonometric relationships as used for reticule binoculars. Laser range-finders were also used for surveys of river dolphins where no horizon was visible. Our paper uses these new techniques to compare measured and estimated distances from sightings surveys of a wide range of targets under a wide range of conditions. These data were used to investigate implications of distance estimation error and some issues inherent in using fixed-target experiments to correct radial distance estimates.
MATERIALS AND METHODS Data from four studies comparing distances estimated by observers with measured values were examined. Distance estimates to a variety of targets were made using naked eye or reticule binoculars and measurements were made using laser range-finding and photogrammetric methods. A summary of the four sets of experiments is shown in Table 1. The basic principles behind distance estimation using photogrammetric measurement of distance are described in detail in Leaper & Gordon (2001). Measurements of the angle of dip from the horizon to the whale can be obtained from images that include both the horizon and the whale taken with a lens of known focal length. Provided the observation height is known the angle of dip can be used to calculate distance using simple trigonometry plus a correction for refraction. Still images were obtained from sequences using digital video cameras. Observers were given no feedback on their performance during the trials and so the data can be considered as distance-estimation experiments, rather than distance-training exercises. Study 1 was carried out in conjunction with a cetacean line-transect survey conducted from a ship of opportunity in the South Atlantic sector of the Southern Ocean (Williams et al., 2006). The calibration experiment was conducted between 5 December 2001 and 12 February 2002. One observer (R.W.) conducted the experiment. While the ship was moving at cruising speed, the observer scanned from the primary platform with the naked eye. When an object was detected, the observer began recording on a hand-held video recorder and making simultaneous voice recording using an external microphone. The observer decided whether the object in question formed a fixed cue (i.e. it remained visible at the surface for the entire time it took to find it, judge distance, and record the object and the distance estimate voice note on the video cassette). Cues were deemed to be transient cues if the object submerged at
Measurement error in cetacean sightings surveys least once during this procedure. Transient cues targeted for this exercise included cetaceans, pinnipeds and penguins. Fixed cues included fur seals and penguins resting on the surface, inflatable boats and chunks of ice that were judged approximately whale-sized or smaller. When a fixed target came into view, or when an animal surfaced presenting a transient cue, the observer made a voice note of the estimated range in metres. Immediately following each video sequence of a surfacing, the observer captured a digital still image of one of the two calibration points on the ship’s bow at the same level of magnification in order to measure the focal length of the lens. At the end of the experiment, the videotape was reviewed by linking the camcorder to a personal computer equipped with WinCoder software (InterVideo, Inc.). When the voice note indicated a surfacing where a simultaneous naked-eye estimate was made, a digital still image was captured and stored as a bitmap file. The program LENRAN was used to convert these bitmaps, given the camera height and magnification calibration, into range estimates (Leaper & Gordon, 2001). Study 2 was conducted from a small (approximately 15 m length, 5 m eye height) boat during off-effort legs of a survey for boto (Inia geoffrensis) and tucuxi (Sotalia fluviatilis) in the Amazon River (S. Hedley, F. Marques, F. Trujillo and R. Williams, unpublished data). These data were different from the other three studies in being collected in restricted areas of water rather than the open sea. Thus distanceestimation and measurement methods requiring a horizon were not possible. Six forward-facing observers conducted the experiment from the main sightings platform on 1 April 2002. A data recorder chose fixed targets only to which observers judged range, because dolphins proved to offer insufficient target strength for range-finders. Each observer wrote down the trial number (22 trials), target position (i.e. ahead, port, starboard, abeam), and estimated distance, in order to retain observer independence. The data recorder measured true distance using Bushnell range-finders. Sea state was not recorded, because the river remained calm throughout the experiment. Study 3 was conducted from a 53 m ship at the discretion of the cruise leader during off-effort legs of a dedicated sightings survey for killer whales (Orcinus orca: Zerbini et al., 2006) and balaenopterid whales in the Gulf of Alaska (Zerbini et al., in press). One observer (A.Z.) conducted the study, and the experiment was conducted from a small cargo ship named ‘Coastal Pilot’ (length 53 m and camera height 9.18 m). The observer scanned using 7×50 binoculars to which a digital camcorder was mounted. At first sight of a cetacean school, a voice note was made onto the videotape to record species and reticule reading. Next, a calibration shot of the ship’s bow was taken. Reticule readings were converted to range using the same trigonometric relationships and refraction calculations as for photogrammetric measurements, based on a US Standard Atmosphere (Leaper & Gordon, 2001). Study 4 was conducted during off-effort segments of a sightings survey from the 99 m survey vessel RRS ‘James Clark Ross’ in the Scotia Sea between 5 January and 10 February 2003. One observer (R.L.) collected the data. Reticule and photogrammetric measurements were made to cetaceans using methods described for Studies 1 and 3. Journal of the Marine Biological Association of the United Kingdom (2007)
R. Williams et al. 315
A dataset was compiled from all paired observations (those estimated by eye versus those calculated using photogrammetric methods) of both fixed and transient cues. These data were analysed in program R (R Development Core Team 2003) using a variety of linear- and non-linear modelling techniques (Krzanowski, 1998) to regress estimated range on measured range. The decision to include cue type (fixed versus transient) as a covariate was driven by a variation on Akaike’s information criterion (AIC; Akaike, 1973), in which models carry a penalty for additional parameters. The variant used in this study adjusted the penalty to account for small sample size (AICc; Burnham & Anderson, 2003). Model selection was guided by the desire for an explanatory model that best fitted the data, rather than a mechanistic model to explain plausibly how the errors were generated. The objective for distance sampling is a model that produces corrected radial distance estimates that are unbiased on average (Chen & Cowling, 2001). Model selection was aided by visual methods that assessed which model fit the data best across the entire range of observations (i.e. models were favoured when diagnostic plots of their residuals showed uniform spread across the x- and y-axes). A three-stage model selection protocol was used. First, a least-squares regression was made of estimated range on measured range. If residuals indicated a relationship between range and variance, then the data were log-transformed and the model refitted. If residuals of the second model showed evidence of non-linearity, then a generalized additive model (GAM) was fitted using package mgcv for R (Wood, 2001), with variance proportional to range. Methods for GAMfitting in mgcv use cross-validation to select automatically the optimum degree of smoothing and impose penalties for unwarranted smoothing. If the estimated degrees of freedom (edf) optimized by the smoothing process in mgcv for the measured range term was greater than one, then the model was selected. If the edf was near 1, then the log-transformed linear regression was selected. In Study 1, the selected model was used to transform estimated radial distances from a survey (Williams et al., 2006). These and measured angles were used to calculate perpendicular distances, which were modelled in DISTANCE 4.0 Release 2 (Thomas et al., 2002). A halfnormal model (Buckland et al., 2001) was fitted to both sets of perpendicular distances (i.e. uncorrected and corrected) to explore how the probability of sighting an animal decreased with increasing perpendicular distance from the trackline. This estimated the extent to which correcting an observer’s ability to judge radial distance altered the estimates of strip half-widths effectively searched for whales. In Study 2, a dataset was compiled from paired observations (visual estimates versus range-finder measurement) for each observer. The decision to include the observer as a covariate was aided by AICc. In Study 3, a dataset was compiled from all paired observations (those measured using the reticule binoculars versus photogrammetric methods) to transient cues for each of three cetacean species. Species was introduced as a candidate covariate, and the decision to include the term in the model was driven by AICc. Study 4, was treated as for Study 1, where photogrammetric measurements were treated as the independent variable.
316 R. Williams et al.
Measurement error in cetacean sightings surveys
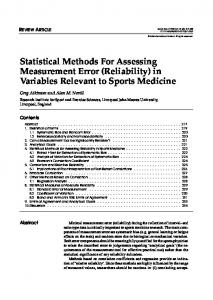
RESULTS Study 1 A total of 222 paired comparisons was made between estimates of distance by naked-eye and photogrammetric measurements to transient cues across a range of animal sizes. Of these, the majority (188) were observations of the target species of the sightings surveys (minke, humpback and fin whales). The remaining observations included small cetaceans (16), penguins (12) and fur seals (6) that were detected at closer distances. The experiment was conducted across a range of sea states from Beaufort 1–5, but with 92% of effort in Beaufort 2–4. An additional 59 paired comparisons were made to fixed cues. These included objects of known size (inflatable boats, fur seals or birds) that were continuously visible while resting at the surface of the water, and chunks of ice that were continuously visible but of unknown size. The variance of estimated distance increased with true range showing a heteroscedastic relationship (Zar, 1996). This observed heteroscedasticity indicated that leastsquares regression was not appropriate and that either a transformation or alternative model such as a GAM (Wood, 2001) was required. Plotting log(estimated distance) against log(measured distance) revealed a linear relationship with constant variance (Figure 1). The data also lent support for stratifying by cue type, and when cue type was introduced as a covariate, ΔAIC=2.07. The intercept term was not significant at the (P=0.05) level. Thus the selected model was: log(estimate)=1.0282×log(measured) to transient cues, and log(estimate)=1.0422×log(measured) to fixed cues.
Figure 1. Scatterplot showing the relationship between photogrammetric measurements and naked eye estimates to fixed (closed circles) and transient (open circles) cues. A dotted line through the origin is shown with slope=1 to show an unbiased relationship. The solid line shows the fitted values of a least-squares regression applied only to transient cues at each observed value of measured range. The selected model, log(estimate)~log(measured), produced standardized residuals that were unbiased across the range of values observed.
The log transformation appeared to adequately address the problem of heteroscedasticity in both cases. Comparing the regression coefficients for fixed and transient cues provided some evidence that the two slopes
Figure 2. Detection functions for uncorrected (upper) and corrected (lower) radial distance estimates. The detection functions were based on 72 sightings of minke whales and on 121 sightings of humpback whales. The correction factor had a large effect on estimates of effective strip width (ESW) and school density (Ds in schools.km-2) for minke and humpback whales. Correcting radial distances reduced ESW for minke whales from 799 (CV 0.10) to 658 m (CV 0.10), which increased the estimate of school density from 0.0046 (CV 0.26) to 0.0055 (CV 0.26). Correcting radial distances reduced ESW for humpback whales from 1314 (CV 0.07) to 1069 m (CV 0.07), which increased the estimate of school density from 0.0046 (CV 0.27) to 0.0057 (CV 0.27). Journal of the Marine Biological Association of the United Kingdom (2007)
Measurement error in cetacean sightings surveys
R. Williams et al. 317
Figure 3. Scatterplot (left) showing heteroscedastic relationship between laser range-finder measurements and naked eye estimates to fixed cues. Plot characters represent values for each of six observers. A dotted line through the origin with slope=1 is shown to illustrate an unbiased relationship. The solid line shows the fitted values of a least-squares regression averaged among all observers. A GAM fitted to the data with variance proportional to the mean (right; observer effect held constant as a random factor) indicated that a smooth spline of measured distance with approximately 2 df described the estimated distances best.
differed from one another, however, this was not significant at the 5% level (t277=1.752, 0.05


![[PDF] Measurement Error: Models, Methods, and ... - Google Sites](https://m.moam.info/img/260x300/pdf-measurement-error-models-methods-and-google-si_64777fe9097c474d228c1bdc.jpg)


