Molecules 2014, 19, 7714-7756; doi:10.3390/molecules19067714 OPEN ACCESS
molecules ISSN 1420-3049 www.mdpi.com/journal/molecules Article
Methods of Increasing the Performance of Radionuclide Generators Used in Nuclear Medicine: Daughter Nuclide Build-Up Optimisation, Elution-Purification-Concentration Integration, and Effective Control of Radionuclidic Purity Van So Le 1,2,*, Zoe Phuc-Hien Do 2, Minh Khoi Le 2, Vicki Le 2 and Natalie Nha-Truc Le 2 1 2
Cyclopharm Ltd., Sydney 2234, NSW, Australia Medical Isotope Techniques (MEDISOTEC), 14(1) Dwyer Street, Gymea 2227, NSW, Australia; E-Mails:
[email protected] (Z.P.-H.D.);
[email protected] (M.K.L.);
[email protected] (V.L.);
[email protected] (N.N.-T.L.)
* Author to whom correspondence should be addressed; E-Mail:
[email protected]; Tel./Fax: +61-2-9531-7597. Received: 16 April 2014; in revised form: 16 May 2014 / Accepted: 5 June 2014 / Published: 10 June 2014
Abstract: Methods of increasing the performance of radionuclide generators used in nuclear medicine radiotherapy and SPECT/PET imaging were developed and detailed for 99 Mo/99mTc and 68Ge/68Ga radionuclide generators as the cases. Optimisation methods of the daughter nuclide build-up versus stand-by time and/or specific activity using mean progress functions were developed for increasing the performance of radionuclide generators. As a result of this optimisation, the separation of the daughter nuclide from its parent one should be performed at a defined optimal time to avoid the deterioration in specific activity of the daughter nuclide and wasting stand-by time of the generator, while the daughter nuclide yield is maintained to a reasonably high extent. A new characteristic parameter of the formation-decay kinetics of parent/daughter nuclide system was found and effectively used in the practice of the generator production and utilisation. A method of “early elution schedule” was also developed for increasing the daughter nuclide production yield and specific radioactivity, thus saving the cost of the generator and improving the quality of the daughter radionuclide solution. These newly developed optimisation methods in combination with an integrated elution-purification-concentration system of radionuclide generators recently developed is the most suitable way to operate the generator effectively on the basis of economic use and improvement of purposely suitable quality and specific activity of the produced daughter radionuclides. All these features benefit the economic use of
Molecules 2014, 19
7715
the generator, the improved quality of labelling/scan, and the lowered cost of nuclear medicine procedure. Besides, a new method of quality control protocol set-up for post-delivery test of radionuclidic purity has been developed based on the relationship between gamma ray spectrometric detection limit, required limit of impure radionuclide activity and its measurement certainty with respect to optimising decay/measurement time and product sample activity used for QC quality control. The optimisation ensures a certainty of measurement of the specific impure radionuclide and avoids wasting the useful amount of valuable purified/concentrated daughter nuclide product. This process is important for the spectrometric measurement of very low activity of impure radionuclide contamination in the radioisotope products of much higher activity used in medical imaging and targeted radiotherapy. Keywords: radionuclide generator; radioisotope concentrator; mean progress function; optimal build-up time; effective specific activity; radionuclidic purity; nuclear medicine; radiopharmaceutical; 99mTc; 68Ga
1. Introduction Today most radionuclide generators are used for nuclear medicine purposes. The generators routinely used in daily nuclear medicine diagnosis and therapeutic treatment are 99Mo/99mTc, 113Sn/113mIn, 81 Rb/81mKr, 82Sr/82Rb, 68Ge/68Ga, 62Zn/62Cu, 188W/188Re, 9°Sr/9°Y, and 166Dy/166Ho among which the 99 Mo/99mTc generator is used most effectively. Other generator systems are used to some extent or are under development. More than 80% of diagnostic imaging procedures of nuclear medicine based on 99m Tc-radiopharmaceuticals are performed world-wide every year. The short-lived gamma or positron emitting radioisotopes produced from radionuclide generators are effectively used in diagnostic nuclear medicine and in biomedical research, while the generator-produced long-lived beta- and alpha-emitting radioisotopes are used in radiotherapy. The 99mTc generator is a well-known example and most widely used in single-photon emission computed tomography (SPECT) and the 68Ga and 82Rb in positron emission tomography (PET) for diagnostic imaging. Expansion of the use of radionuclides produced from radionuclide generators is always desirable, subsequently benefiting superiority of the SPECT and PET-based molecular imaging technique. Usually, a radionuclide generator, or colloquially a “radioisotope cow” is a device used to extract the short-lived daughter nuclide generated from the radioactive decay of long-lived parent nuclide. As such, it can be easily transported over long distances to radiopharmacies where its decay product daughter radionuclide is extracted for daily use. The safe utilisation of the nuclide generators is definitely controlled by the quality factors required by the health authorities. However, the acceptability of a radionuclide generator to be used in nuclear diagnostic/therapeutic procedures and the quality of SPECT imaging diagnosis and/or endo-radiotherapy are controlled by the generator design and its operation management/“daughter nuclide milking” schedule. The efficacy of a radionuclide generator used in nuclear medicine depends on the concentration and specific radioactivity (SA) of the daughter nuclide in the solution produced from the generator, because the volume and the mass of bio-medically active radiolabelled agents used in one
Molecules 2014, 19
7716
given injection dose of daughter nuclide-labelled radiopharmaceuticals are limited to avoid any possible side/adverse effect for the metabolic system of the patient body. Daughter nuclide concentration is determined by the radioactivity yield of each “milking”/elution of the generator and the final volume of the daughter nuclide solution. This solution volume is fixed and defined by the generator design which is dictated by a given radiochemical processing process. However, the specific radioactivity of (SA) of the daughter nuclide is affected by the “milking” schedule only. Additionally, the cost-effective utilisation of the generator is controlled by the daughter nuclide yield obtained for the whole lifetime of a given generator, which is the sum of yields obtained in each “milking” (elution/separation) and is determined by the “milking” schedule (the daughter nuclide build-up time schedule) of the generator. In conclusion, for an established design of generator system, the build-up time schedule of the daughter nuclide for the generator operation management will determine not only the concentration and specific radioactivity of the daughter nuclide solution obtained from the generator but also the cost-effective utilisation of the generator system. Thus the effective utilisation of the generator is experienced as a result of proper “milking” management based on the optimal schedule of the daughter nuclide build-up time. Similarly, the optimisation in the daughter nuclide decay time schedule versus radioactivity of the sample for a radionuclidic purity test is also addressed for the optimal management of the generator utilisation. Therefore the report on this issue is also included in this article. With the success in the development of the integrated elution-purification-concentration systems (RADIGIS-Radioisotope Generator Integrated System) and the radioisotope concentrator device ULTRALUTE® to achieve a small volume (~1.0 mL) of the product solution of daughter nuclide obtained from the variable design of the generator systems as reported in our previous papers [1–10], the optimisation methods of radionuclide generator operation management as mentioned above will in turn become the most important subject to be discussed in the series of our generator development projects. It is realized that no report on the optimisation of daughter nuclide build-up time (stand-by time of the generator for each “milking”) for the generator operation have been available in the literature until now. Our present work is focused on providing the optimisation methods first time developed for the radionuclide generator operation management to increase the effectiveness of the radionuclide generator utilisation. 2. Theoretical Approach and Method Development 2.1. Daughter Nuclide Build-Up Optimisation for Improvement of Production Yield and Specific Radioactivity General consideration: For the reason of ensuring a convenient and effective radiochemical separation, the following general radionuclide decay scheme is usually used in the practice of radionuclide generator production:
(R1 is the parent nuclide; R2 is the daughter nuclide of interest; R3 is the common daughter nuclide of R1 and R2 nuclides; S is the stable nuclide.)
Molecules 2014, 19
7717
Radioactivity build-up (A2) of the daughter nuclide R2 of interest in the generator:
A2 = λ2 × N1,0 × b × (
λ1 λ2 − λ1
) × (e− λ1 ⋅t − e− λ2 ⋅t )
(1)
(λ1 and λ2 are the decay constants of the parent and daughter nuclides, respectively; N1,0 is the atom numbers of the parent nuclide at the build-up time time t = 0; b is the branch decay ratio of the parent nuclide R1 leading to the daughter nuclide R2.) The maximal build-up time tmax for nuclide R2 (at which the maximal activity build-up (yield) of the R2 nuclide in the generator is available):
tmax = [ln(λ2 / λ1 )] / (λ2 − λ1 )
(2)
As shown in Figures 1 and 2, it is the fact that at the start of the Ri build-up the convex exponential increase of radioactivity A2 is faster than the linear increase of build-up time t. However, the increase of the value A2 will slow down after a certain time period. This relationship can be used for an optimisation of the radioactivity build-up versus build-up time (or the standby time) of the daughter nuclide R2 in the generator, which will be formulated in Sections 2.1.1, 2.1.2, and 2.1.3. Specific radioactivity definitions used for optimisation assessment: The followings can be justified based on the above general radionuclide decay scheme: • If R2 ≠ R3 ≠ S (R2, R3 and S are the nuclides of different chemical elements) then R2 and R3 are radionuclides available in a carrier-free state and their elemental specific radioactivity (SA) is invariable for all the time. In this case, the SA value can be evaluated without acknowledgement of the atom numbers of given nuclide using the following equation [11].
SACarrier-free = 6.022 ×10²³ × λRi (Bq/Mol)
(3)
• In the case of R2 ≡ R3 ≠ S (R2 and R3 are the radionuclides of the same chemical element; S is a stable nuclide of another element), both the R2 and R3 radionuclides are available in a carrier-included state and their elemental specific radioactivity is variable with the build-up time (99Mo/99mTc system shown below as an example). With an assumption of ignoring the insignificant amount of stable nuclide S formed in the system, the atom numbers (N) of all daughter radionuclides R2 and R3 generated from the parent nuclide R1 is N = N R2 + N R3 = N1,0 − N1 = N1,0 × (1 − e − λ1 ⋅t )
This N value will be used for the calculation of elemental specific radioactivity in the following process of optimisation assessment. • In the case of R2 ≈ R3 ≈ S (R2, R3 and S are the isotopes of different chemical elements which have a similar chemical property of interest for a specific application such as the coordinative radiolabelling of radiopharmaceuticals, the R2 and R3 radionuclides are available in a non-elemental carrier-included state and the specific radioactivity of radionuclide R2, named as “Effective Specific Radioactivity” (ESA), is variable with the build-up time (68Ge/68Ga system shown below as an example). The effective specific radioactivity is conveniently defined as the radioactivity of a specified radioactive daughter nuclide (R2 or R3) per the total atom numbers of three
Molecules 2014, 19
7718
nuclides R2, R3, and S. The atom numbers (N) of all related daughter nuclides which are generated from the parent nuclide R1 is N = N R2 + N R3 + N S = N1,0 − N1 = N1,0 × (1 − e − λ1 ⋅t )
This N value will also be used for the calculation of ESA values in the following process of optimisation assessment. Figure 1. 99mTc build-up in the 99Mo/99mTc generator system: 99Mo activity (a); 99mTc activity (b); Specific radioactivity of 99mTc (c); Total atom numbers N or molarities of Tc (n); tmax is the maximal build-up time for nuclide 99mTc; topt(t) and topt(SA) are the optimal build-up time values calculated in the optimisation process of the radioactivity build-up versus standby time and/or versus specific activity of the daughter nuclide 99mTc, respectively (Sections 2.1.1 and 2.1.2; Table 1).
As shown in the two last cases above, both values of SA and ESA of the carrier-included radionuclide Ri can be calculated using the same following equation:
SARi = ESARi =
ARi N
λ2 × N1,0 × b × ( =
λ1
λ2 − λ1
) × (e− λ1 ⋅t − e− λ2 ⋅t )
N1,0 ⋅ (1 − e
− λ1 ⋅t
)
, where Ri is R2 or R3
(4)
As shown in Figures 1 and 2, it is the fact that at the start of the Ri build-up the total atom numbers N (or molarities) of three daughter nuclides R2, R3, and S will increase convexly slower than the exponentially increasing activity A2 of the daughter nuclide R2. However, the value of N (or molarities) will increase faster than that of A2 after a certain time period, because the increase of N value (or
Molecules 2014, 19
7719
molarities) is only affected by the decay of the parent nuclide R1, while A2 value is controlled by both the decays of the parent and daughter nuclides. This relationship can be used for an optimisation of the radioactivity build-up versus N value (or molarities) of the daughter nuclide R2. Taking into account the above mentioned Equation (4) for the calculation of SA and ESA values, the mean progress function for optimisation of the daughter nuclide build-up versus specific activity will be formulated in Section 2.1.2. Figure 2. 68Ga build-up in the 68Ge/68Ga generator system: 68Ge activity (a); 68Ga activity (b); Effective specific radioactivity of 68Ga (c); Total atom numbers N or molarities of Ga +Zn (n); tmax is the maximal build-up time for nuclide 68Ga; topt(t) and topt(SA) are the optimal build-up time values calculated in the optimisation process of the radioactivity build-up versus standby time and/or versus specific activity of the daughter nuclide 68Ga, respectively (Sections 2.1.1 and 2.1.2; Table 1).
The following examples are typical decay schemes used in the radionuclide generators of practical application. They are used for demonstration of the optimisation methods developed in this report. 99 Mo/99mTc system: The decay scheme of 99Mo/99mTc system used in the 99mTc-generator production processes is presented as follows:
(Identification with previous general decay scheme: 99Mo is R1; 99mTc is R2; 99Tc is R3; 99Ru is S.)
Molecules 2014, 19
7720
As shown, the formation of 99Ru stable nuclides is insignificant due to the small branch-decay factors of the 99mTc (b = 9 × 10⁻⁷) and long lived 99Tc nuclides to form 99Ru nuclide. This scheme shows that 99mTc is in a carrier-included state and the total numbers of Tc-nuclides at the build-up time t is described as follows: N Tc = N Tc − 99 + N Tc − 99 m = N Mo − 99,0 − N Mo − 99 = N Mo − 99,0 × (1 − e − λMo−99 ⋅t )
(5)
The elemental specific activity of carrier-included 99mTc in the 99mTc generator system or in the 99m Tc-eluate is calculated by a combination of Equations (1) and (5) as follows:
SATc −99 m
=
A = Tc −99 m = NTc
λ2 ⋅ N Mo −99,0 ⋅ b ⋅ (
λ2 ⋅ N1,0 ⋅ b ⋅ (
λ1
) ⋅ (e − λ1 ⋅t − e− λ2 ⋅t )
λ2 − λ1
=
N1,0 ⋅ (1 − e− λ1 ⋅t )
λMo −99 ) ⋅ (e − λ λTc −99 m − λMo −99
Mo −99 ⋅t
− e − λTc−99 m ⋅t )
SATc −99 m =
λTc −99 m ⋅ b ⋅ (e − λ ⋅t − e − λ ⋅t ) λ 0.6144 ⋅10−7 ⋅ ( Tc −99 m − 1) ⋅ (1 − e− λ λMo −99 Mo −99
(6)
→
N Mo −99,0 ⋅ (1 − e− λMo−99 ⋅t )
Tc −99 m
Mo−99 ⋅t
(Ci/μmol) )
(Note: Specific radioactivity of carrier-free 99mTc is 521.32 Ci/μmol.) 68
Ge/68Ga system: The decay scheme of processes is presented as follows.
68
Ge/68Ga system used in the
68
Ga-generator production
(Identification with previous general decay scheme: 68Ge is R1; 68Ga is R2; 68Zn is S.)
This scheme shows that 68Ga is in a carrier-free state and its specific radioactivity is a constant value (2776.4 Ci/μmol, calculated using Equation (3). As shown in the 68Ge/68Ga decay scheme, 68Ga decays to 68Zn relatively rapidly. There is a defined amount of 68Zn2+ ions that accumulate on the sorbent and then can possibly be eluted into the 68Ga eluate during the generator elution operation. Zn2+ ions have the coordination chemistry property similar to 68Ga3+ ions in the reaction of 68Ga-radiolabelling with macrocyclic ligands in the targeting radiopharmaceutical preparation process, such as the preparation of radiopharmaceuticals 68Ga-OTATATE, 68 Ga-DOTATOC, and 68Ga-DOTANOC for tumour imaging [12]. So the presence of Zn2+ ions in the 68 Ga solution will definitely influence the 68Ga–labelling yield of 68Ga-radiopharmaceuticals. Due to the similarity in the incorporation into labelled compounds between 68Zn and 68Ga, the impact on the radioisotope dilution of the 68Ga atoms with 68Zn atoms is considered thus much as with the non-radioactive Ga atoms which would be present in the 68Ga solution. In this case the use of ESA value of the 68Ga-solution will be useful and all related radiochemical assessments should be performed with ESA value instead of the elemental specific radioactivity (SA) value of the carrier-free 68 Ga solution. In this case ESA value is calculated using Equation (4) as clarified above.
Molecules 2014, 19
7721
The total numbers of 68Ga and 68Zn nuclides at the build-up time t is described as follows: N = N Ga − 68 + N Zn − 68 = N Ge − 68,0 − N Ge − 68 = N Ge − 68,0 ⋅ (1 − e − λGe−68 ⋅t )
(7)
The ESA value of 68Ga nuclide is calculated as follows:
ESAGa −68 =
=
AGa −68 N Ga −68+ Zn −68
λ2 ⋅ NGe −68,0 ⋅ b ⋅ (
λ2 ⋅ N1,0 ⋅ b ⋅ ( =
λ1
λ2 − λ1
) ⋅ (e− λ1 ⋅t − e − λ2 ⋅t )
λGe −68 ) ⋅ (e − λ λGa −68 − λGe−68
Ge−68 ⋅t
− e− λGa−68 ⋅t )
λGa −68 (e− λ ⋅t − e− λ ⋅t ) λ 0.6144 ⋅10−7 ⋅ ( Ga −68 − 1) ⋅ (1 − e − λ λGe−68 Ge−68
(8)
→
N Ge−68,0 ⋅ (1 − e − λGe−68 ⋅t )
ESAGa −68 =
=
N1,0 ⋅ (1 − e− λ1 ⋅t )
Ga −68
Ge−68 ⋅t
(Ci/μmol) )
2.1.1. Mean Progress Function for Optimisation of the Daughter Nuclide Build-up versus Buildup Time (or Standby Time) This function is formulated based on the fact that at the start of the daughter nuclide build-up the convex exponential increase of the activity A2 of daughter nuclide R2 is faster than the linear increase of the build-up time t. However, A2 value will increase more slowly than t value after a certain time period. The mean progress function for optimisation of the daughter nuclide build-up versus stand-by time is formulated as follows. Notation: f(A,t) is the mean progress function for optimisation of the daughter nuclide build-up versus stand-by time t. topt(t) is the optimal build-up time for the daughter nuclide build-up versus stand-by time; A = A2 is the build-up radioactivity of the daughter nuclide R2 and other notations are the same as in Equation (1). The meaning of this mean progress function is that the progressive increase in the daughter nuclide activity build-up is related to the build-up time progress needed for increasing one unit of the daughter nuclide build-up activity on average for the build-up time period t. In other words, the progressive increase in the daughter nuclide activity build-up is compared with the quotient of the build-up time increase per unit of daughter nuclide build-up activity:
λ2 ⋅ N1,0 ⋅ b ⋅ (
λ1
) ⋅ (e − λ1 ⋅t − e − λ2 ⋅t )
λ2 − λ1 A f ( A, t ) = = = (t / A) [t / λ ⋅ N ⋅ b ⋅ ( λ1 ) ⋅ (e − λ1 ⋅t − e − λ2 ⋅t )] 2 1,0 λ2 − λ1
[λ2 ⋅ N1,0 ⋅ b ⋅ (
λ1
λ2 − λ1 t
) ⋅ (e − λ1 ⋅t − e − λ2 ⋅t )]2
(9)
To find the stationary point (maximum point) of this function, we differentiate, set the derivative equal to zero and solve the equation to find out the time value tmax,f(A,t) at which the value of the function f(A,t) reaches the maximum:
Molecules 2014, 19
7722
df ( A, t ) λ λ = {t ⋅ 2[λ2 N1,0b( 1 )(e − λ1 ⋅t − e− λ2 ⋅t )] ⋅ [λ2 N1,0b( 1 )(−λ1e − λ1 ⋅t + λ2 e− λ2 ⋅t )] dt λ2 − λ1 λ2 − λ1 − [λ2 N1,0b(
λ1
2
λ2 − λ1
)] (e
− λ1 ⋅t
−e
− λ2 ⋅t 2
) } / [ N1,0 (1 − e
− λ1 ⋅t
(10a)
2
)]
At the time point t = tmax,f(A,t) the derivative of the f(A,t) function is equal to zero:
df ( A / t ) =0 dt From the Equation (10a), by replacing t = tmax,f(A,t) it is re-written as follows:
{tmax, f (At, ) ⋅2[λ2N1,0b(
λ1
−λ1⋅tmax, f ( At, )
λ2 −λ1
)(e
−λ2⋅tmax, f ( At, )
−e
)]⋅[λ2N1,0b(
λ1
−λ1⋅tmax, f ( At, )
)(−λ1e
λ2 −λ1 λ −λ ⋅t −[λ2N1,0b( 1 )]2(e λ2 −λ1
1 max, f ( At, )
−λ2⋅tmax, f ( At, )
+λ2e
)]
−λ2⋅tmax, f ( At, ) 2
−e
) }=0
Re-arranging this equation, the followings are obtained: −λ1⋅tmax, f ( At, )
−λ2⋅tmax, f ( At, )
tmax, f (At, ) ⋅ 2(−λ1e
−λ2⋅tmax, f ( At, )
2λ2tmax, f (At, )e (
+λ2e
−λ2⋅tmax, f ( At, )
+e
−λ1⋅tmax, f ( At, )
) −(e
−λ2⋅tmax, f ( At, )
−e
−λ1⋅tmax, f ( At, )
= 2λ1tmax, f (At, )e
2λ2tmax, f (A,t) +1 (λ2−λ1)tmax, f ( At, ) ) −e =0 2λ1tmax, f (At, ) +1
) =0→
−λ1⋅tmax, f ( At, )
+e
→
(10b)
Finally, the time value tmax,f(A,t) will be obtained as a result of the solution of Equation (10b). As clarified by the meaning of the f(A,t) function described above, it is stated that the time value tmax,f(A,t) is the optimal build-up time topt(t) of the daughter nuclide build-up activity (A) versus the build-up time t, or tmax,f(A,t) = topt(t). By replacing the value topt(t) into Equation (10b), the following is obtained:
(
2λ2topt (t ) + 1 ( λ −λ ) t ) − e 2 1 opt ( t ) = 0 2λ1topt (t ) + 1
(11)
This identification/attribution is based on the fact that the function of daughter nuclide build-up activity will develop from the fast growing state with the increasing values of function f(A,t) = A/(t/A) to the slow-down state with the decreasing f(A,t) = A/(t/A) values via a transient point Aopt(t) (so-called optimal build-up activity) achievable at the optimal build-up time point topt(t). As an explanatory example, the 99mTc-build-up optimisation of 99Mo/99mTc generator system is shown in Figure 3. The topt(t) values of 50 parent/daughter nuclide pairs calculated using Equation (11) are reported in the section “Results and Discussions” (Section 4.1 and Table 1).
Molecules 2014, 19
7723
Figure 3. 99mTc build-up optimisation of 99Mo/99mTc generator system: b, 99mTc activity build-up (Referred to curve b of Figure 1); d, Mean progress function of 99mTc-build-up versus stand-by time; f is the time function f(t) = t. tmax is the maximal build-up time for nuclide 99mTc; topt(t) is the optimal time value calculated with Equation (11) in the optimisation process of the radioactivity build-up versus standby time of the daughter nuclide 99mTc.
2.1.2. Mean Progress Function for Optimisation of the Daughter Nuclide Build-up versus Specific Activity Taking into account the above mentioned formulations for the specific activity values SA and ESA, the mean progress function for optimisation of the daughter nuclide build-up versus specific activity is formulated based on the fact that at the start of the daughter nuclide build-up, the total atom numbers (N = N1.0(1 − e−λ1t) of the daughter nuclides R2, R3, and S will increase slower than the activity A2 of the daughter nuclide R2. However, the atom number value N of the daughter nuclides will increase faster than the value A2 after a certain time period, because N value is only affected by the decay of the parent nuclide R1, while A2 value is controlled by both the decays of the parent and daughter nuclides. The mean progress function for optimisation of the daughter nuclide build-up versus specific radioactivity is formulated as follows: Notation: f(A,SA) is the mean progress function for optimisation of the daughter nuclide build-up versus specific radioactivity. topt(SA) is the optimal build-up time for the daughter nuclide build-up versus specific radioactivity; N is the nuclide atom numbers as clarified in Section 2.1; A = A2 is the build-up radioactivity of the daughter nuclide R2 and other notations are the same as in Equation (1).
Molecules 2014, 19
7724
The meaning of this mean progress function is that the progressive increase in the daughter nuclide activity build-up is related to the total daughter nuclide atom numbers grow-up needed for increasing one unit of the daughter nuclide build-up activity on average for the build-up time period t. In other words, the progressive increase in the daughter nuclide activity build-up is compared with the quotient of the total daughter nuclide atom number increase per unit of daughter nuclide build-up activity:
f ( A, SA) =
λ1
λ2 ⋅ N1,0 ⋅ b ⋅ (
A A = (1/ SA) ( N / A)
) ⋅ (e − λ1 ⋅t − e − λ2 ⋅t )
λ2 − λ1 = λ1 − λ ⋅t − λ ⋅t [ N / λ2 ⋅ N1,0 ⋅ b ⋅ ( ) ⋅ (e − e )] λ2 − λ1
f ( A, SA) =
1
→
[λ2 ⋅ N1,0 ⋅ b ⋅ (
λ1
λ2 − λ1
) ⋅ (e − λ1 ⋅t − e − λ2 ⋅t )]2
(12)
N1,0 (1 − e − λ1 ⋅t )
2
To find the stationary point (maximum point) of this function, we differentiate, set the derivative equal to zero and solve the equation to find out the time value tmax,f(A,SA) at which the value of the function f(A,SA) reaches the maximum:
λ λ df ( A, SA) = {N1,0 (1 − e − λ1 ⋅t ) ⋅ 2[λ2 N1,0b( 1 )(e − λ1 ⋅t − e− λ2 ⋅t )] ⋅ [λ2 N1,0b( 1 )(−λ1e − λ1 ⋅t + λ2 e− λ2 ⋅t )] λ2 − λ1 λ2 − λ1 dt − N1,0 λ1e − λ1 ⋅t ⋅ [λ2 N1,0b(
λ1 λ2 − λ1
(13a)
)]2 (e− λ1 ⋅t − e − λ2 ⋅t ) 2 } / [ N1,0 (1 − e− λ1 ⋅t )]2
At the time point t = tmax,f(A,SA) the derivative of the f(A,SA) function is equal to zero:
df ( A, SA) =0 dt From Equation (13a), by replacing t = tmax,f(A,SA) it is re-written as follows: {N1,0 (1 − e
− λ1 ⋅tmax, f ( A ,SA )
) ⋅ 2[(λ2 N1,0b(
λ1 − λ ⋅t )(e λ2 − λ1
1 max, f ( A , SA )
− N1,0 λ1e
−e
− λ2 ⋅tmax, f ( A ,SA )
− λ1 ⋅tmax, f ( A ,SA )
)] ⋅ [(λ2 N1,0b(
⋅ [λ2 N1,0b(
λ1 − λ ⋅t )(−λ1e λ2 − λ1
1 max, f ( A , SA )
λ1 − λ ⋅t )]2 (e λ2 − λ1
1 max, f ( A ,SA )
−e
+ λ2 e
− λ2 ⋅tmax, f ( A ,SA )
)]
− λ2 ⋅tmax, f ( A ,SA ) 2
) }=0
Re-arranging this equation, the following are obtained: (1 − e (λ2e
− λ1 ⋅tmax, f ( A ,SA )
− λ2 ⋅tmax, f ( A ,SA )
) ⋅ 2(−λ1e
− λ1e
− λ1 ⋅tmax, f ( A ,SA )
− λ1 ⋅tmax, f ( A ,SA )
+ λ2 e
− λ2 ⋅tmax, f ( A ,SA )
λ ⋅tmax, f ( A ,SA )
)(e 1
) = λ1e
− 1) − 0.5λ1 (e
− λ1 ⋅tmax, f ( A ,SA )
− λ1 ⋅tmax, f ( A ,SA )
⋅ (e
−e
− λ1 ⋅tmax, f ( A ,SA )
− λ2 ⋅tmax, f ( A ,SA )
−e
− λ2 ⋅tmax, f ( A ,SA )
)=0
)→
(13b)
Finally, the time value tmax,f(A,SA) will be obtained as a result of the solution of Equation (13b). As clarified by the meaning of the f(A,SA) function described above, it is stated that the time value tmax,f(A,SA) is the optimal build-up time topt(SA) of the daughter nuclide build-up activity (A) versus specific activity SA, or tmax,f(A,SA) = topt(SA). By replacing the value topt(SA) into Equation (13b), the following is obtained: ( λ2 e
− λ2 ⋅topt ( SA )
− λ1e
− λ1 ⋅topt ( SA )
)(e
λ1 ⋅topt ( SA )
− 1) − 0.5λ1 (e
− λ1 ⋅topt ( SA )
−e
− λ2 ⋅topt ( SA )
)=0
(14)
Molecules 2014, 19
7725
This identification/attribution is based on the fact that the function of daughter nuclide build-up activity will develop from the fast growing state with the increasing values of function f(A,SA) = A/(N/A) to the slow-down state with the decreasing f(A,SA) = A/(N/A) values via a transient point Aopt(SA) (so-called optimal build-up activity) achievable at the optimal build-up time point topt(SA). As an explanatory example, the 99mTc- build-up optimisation of 99Mo/99mTc generator system is shown in Figure 4. The topt(SA) values of 50 parent/daughter nuclide pairs calculated using Equation (14) are reported in the section “Results and Discussions” (Section 4.1 and Table 1). (Note: In the case of carrier-free daughter radionuclides, the atom numbers value N is decreased during increased build-up of the daughter nuclide due to its decay, so, no mean progress function f(A,SA) will exist). Figure 4. 99mTc build-up optimisation of 99Mo/99mTc generator system: b, 99mTc activity build-up (Referred to curve b of Figure 1); c, Specific radioactivity of 99mTc (Referred to curve c of Figure 1); n, the total atom numbers N or molarities of Tc; e, Mean progress function of the 99mTc-build-up versus specific activity of 99mTc; tmax is the maximal build-up time for nuclide 99mTc; topt(SA) is the optimal time value calculated in the optimisation process of the radioactivity build-up versus specific activity of the daughter nuclide 99mTc.
2.1.3. Method of Early Elution Schedule for Increasing the Daughter Nuclide Production Yield and Effective Utilisation of Parent Nuclide The daughter nuclide activity yield of the radionuclide generator can be increased by performing an optimal regime of multiple “early” elutions (the generator is more frequently eluted) which are performed at any time before maximal build-up of the daughter nuclide. This idea has been proved in our previous papers [5,7,10] which reported the method for evaluation of the effectiveness of “early”
Molecules 2014, 19
7726
elution regime in comparison with a single elution performed at maximal build-up time for the 99m Tc-generator system. Actually, this is a general method which can be used for all radionuclide generators using different parent/daughter nuclide pairs. For general application of this method, the daughter nuclide-yield ratio (Ry) is set up and a general equation of Ry value assessment for the radionuclide generator systems is derived. Ry is defined as a quotient of the sum of daughter nuclide build-up activity (or elution yields) eluted in all i “early” elutions divided by the maximal daughter nuclide build-up activity A2(max) (or elution yield) which would be eluted from the generator at maximal build-up time tmax: i =n
Ry =
A i =1
2( Ei )
(15)
A2(max)
where A2( Ei ) and A2(max) are the daughter nuclide build-up activities (or elution yields) at the elution time t( Ei ) and tmax, respectively (Ei is indexed for the ith elution). The build-up time period (tb) for each “early” elution is given as tb = (tmax/i), where i is the integer number of the “early” elutions. Daughter nuclide-yield ratio (Ry) calculation for a multiple “early” elution schedule: The total daughter nuclide-elution yields eluted in all i elutions is the sum of the daughter nuclide -activities (A2(Ei)) achieved at different “early” elution i. The equation for evaluation of this amount is derived from Equation (1) and described as follows: i =n
A2( Ei ) = λ2 × i =1
x = i −1
[N
1,0
× e − λ1 ⋅ x⋅tb × b × (
x =0
λ1 λ2 − λ1
) × (e − λ1 ⋅tb − e − λ2 ⋅tb )]
(16)
The maximal daughter nuclide-activity build-up/yield of the radionuclide generator is described using Equations (1) and (2) as follows:
A2(max) = λ2 × N1,0 × b × (
λ1 λ2 − λ1
) × (e− λ1 ⋅tmax − e− λ2 ⋅tmax )
(17)
The daughter nuclide-yield ratio (Ry) derived from Equations (16) and (17) is the following: i =n
Ry =
A i =1
2( Ei )
A2(max)
(e− λ1⋅tb − e− λ2 ⋅tb ) x =i −1 − λ1 ⋅ x⋅tb = − λ1 ⋅tmax ⋅e (e − e− λ2 ⋅tmax ) x =0
(18)
where, i is the number of the early elutions needed for a practical schedule of the generator elution, as an example, planned for a series of consecutive imaging scans. The build-up time (tb) for each “early” elution is determined tb = (tmax/i). x is the number of the elutions which have been performed before starting a daughter nuclide-build-up process for a consecutive elution. At this starting build-up time point it is assumed that no residual daughter nuclide atoms have been left in the generator from a preceding elution (i.e., the daughter nuclide-elution yield of the preceding elution is assumed 100%). The examples of 99Mo/99mTc and 68Ge/68Ga systems for the demonstration of method developed are shown in Figures 5 and 6, respectively. The Ry values of the early elution schedule for these systems are evaluated and reported in Section 4.1.2 (Results and Discussion).
Molecules 2014, 19 Figure 5. Kinetics of radioactive decay/99mTc-activity build-up in the generator eluted with an early elution schedule: a, 99Mo-activity; b, 99mTc-activity build-up from beginning; i, 99mTc-activity growth/eluted at 6-h elutions; c, Specific Activity of 99mTc in the system of 99mTc-radioactivity build-up from beginning (the detailed discussion is available in Section 4.1.2).
Figure 6. Kinetics of radioactive decay/68Ga-activity build-up in the generator eluted with an early elution regime: a, 68Ge-activity; b, 68Ga-activity build-up from beginning; i, 68Ga-activity growth/eluted at 2.1-h elutions; c, Effective Specific Activity of 68Ga in the system of 68Ga-radioactivity build-up from beginning (the detailed discussion is available in Section 4.1.2).
7727
Molecules 2014, 19
7728
2.2. Method of Radioisotope Concentrator Design for Use in the Optimisation of Generator Elution to Increase the Performance of Radionuclide Generators: Concentrating 99mTc Solution Eluted from 99 Mo/99mTc Generator as a Case The radioisotope concentration process not only has positive impact on the extension of useful generator lifetime, but also is capable to increase the effectiveness of 99mTc and 99Mo utilisation by performing consecutive early elutions of the generator at any time before maximal build-up of the 99m Tc daughter nuclide. The 99mTc activity yield of the generator can be increased by performing an optimal regime of multiple consecutive “early” elutions (the generator is more frequently eluted) combined with a process of 99mTc-eluate concentration. We have developed a method of assessment of concentration factor values for the design of radioisotope concentrators. This method relies on the basic parameters currently used in the chromatographic processes such as the retention time/volume and the distribution coefficient of the solute [5,6]. This evaluation is an important guide for designing the concentrator with optimal operation conditions. A standardization method of concentration factor evaluation is to use an elution performed with normal saline solution (0.9% NaCl) as a reference. In this case, the normal saline plays both the role of a generator eluate containing solute (99mTc), which is fed/loaded onto the following concentration column to be concentrated and that of the eluate of final concentrated 99mTc-product saline solution which is stripped from the concentration column. This approach is also useful for the evaluation of the effectiveness of one concentration process (Sorbent-eluent system) in comparison with other concentration systems which could or would be performed under similar (normalized) conditions of the experiments. In general, the performance of the concentration process is characterized with the concentration factor n. For the concentration process of a solute recovery yield (k), the following mass balance is established:
n= n=
c2 c1
c2 V = k× 1 c1 V2
(19)
where V1 and V2 are the solution volumes before and after concentration, respectively. c1 is the solute concentration in the solution before the concentration and c2 is the solute concentration in the solution after the concentration using a given concentration process. In individual case of 99mTc concentration, c1 is the 99mTc radioactivity concentration in the eluate eluted from the 99mTc generator and c2 is the 99mTc radioactivity concentration in the 99mTc solution concentrated using a given concentration process. Relating the above equations, the following is derived:
V2 × c2 = k × c1 × V1
(20)
Except being concentrated by the evaporation of solvent or by electrolysis, all chromatographic column concentration processes are described by the following basic equations:
Molecules 2014, 19
7729
For a sorbent (e.g., ion-exchange resin) characterized with a volume of solid substrate used in the concentration column:
V1 = Vm + KV × VS
(21)
For a sorbent (e.g., alumina) characterized with a specific surface area of solid substrate used in the concentration column:
V1 = Vm + K S × S
(22)
where: _
S = mc × S 1
_
VS = mc × VS = mc ×
ρ Re
KV = ρ Re × KW (More details about these equations referred to the reference [6].)
The following is received by relating Equations (21) and (22):
KV ×VS = K S × S KS value is calculated by putting the value of KV, VS, and S into this equation:
KS =
KW
(23)
_
S
where KS (mL/m2), KV (mL/mL), KW (mL/g) is the area, volume, weight distribution coefficient of the solute (99mTcO4−) in a given sorbent-solution system, respectively; S is the surface area of the sorbent (m2); Vs is the volume of the dry resin (mL); mc is the weight of the dry resin/sorbent loaded in the column (g); _
S is the specific surface area of the sorbent (m2/g); _
VS is the specific volume of the resin (mL/g);
ρRe is the weight density of the resin (g/mL). Based on the above equations (assuming the dead volume of the concentration column Vm LU > LC can be stated. Although LU is the most likely to be identified with a minimum detectable activity (MDA) and that basing on expected counts it tells the fact that we might detect the activity, in this work LD is a preferable choice to be discussed for the reason of pre-evaluation of the radionuclidic impurity analysis performance for an individual radioactive product, which is 68Ga solution as an example. The decision limits (LD, LU, LC) were calculated using the following equations and spectrum counts. The calculation was made for the photo peak area of gamma rays with emission yield Y (γ rays/one decay) and counting efficiency ε and for 95% confidence. LC (counts) = 1.645 × [B (1 + n/2m)]1/2 LC (cps) = (LC/t); LC (Ci) = [C × LC (cps)] Upper limit, LU (counts) = A + 1.645 × [A + B (1 + n/2m)]1/2 LU (cps) = (LU/t); LU (Ci) = [C × LU (cps)] Detection limit, LD (counts) = 2.71 + 3.29 × [B (1 + n/2m)]1/2 LD (cps) = (LD/t); LD (Ci) = [C × LD (cps)] Conversion factor C: C = [1/(Y × ε × 37 × 109)]; Counting time t is in seconds. Critical limit,
Molecules 2014, 19
7740
Peak region: -
Channel numbers of the peak region: Gross counts in the peak region of n channels:
n G
Background region: -
Channel number on the right side of peak region: Counts belongs to m channels: Channel number on the left side of peak region: Counts belongs to m channels:
m s1 m s2
Sum of background region counts, S = (s1 + s2) Background correction, B = (n × S)/(2 × m) Net peak area (counts), A = G − B The detection limit values were evaluated with ORTEC gamma-ray spectrometer coupled with HP Ge detector. This instrument was calibrated using 152Eu standard source. The obtained evaluation results reported in Section “Results and Discussion” are used for the optimisation of decay time and radioactivity of the QC sample used for post-delivery quality control process (Section 4.3). 4. Results and Discussion
4.1. Optimisation for Improvement of Production Yield and Specific Radioactivity
4.1.1. Daughter Nuclide Build-up Optimisation and New Characteristic Parameter of Formation-Decay Kinetics of Parent/Daughter Nuclide System (Referred to Sections 2.1.1 and 2.1.2) The results of optimisation assessment for 50 parent/daughter nuclide pairs of different half-lives are reported in Table 1 and in Figures 9–11. The diagrams of the build-up time ratio (topt(t)/tmax) and daughter nuclide activity ratio (A2,opt(t)/A2,max) plotted against decay constant ratio (λ2/λ1), which are based on the results of the optimisation of the daughter nuclide activity build-up versus build-up time reported in Table 1, are shown in Figure 9. The plots show defined characteristics of daughter nuclide build-up kinetics in relation with the decay constant ratio (λ2/λ1) of parent/daughter nuclide systems. The diagram in Figure 9 reveals a maximum value (topt(t)/tmax) = 0.5 at the ratio value (λ2/λ1) = 1 and a variation in the (topt(t)/tmax) values from 0.05 to 0.5 for the whole range of different parent/daughter nuclide pairs. Accordingly, a maximum value (A2,opt(t)/A2,max) = 0.823 at the ratio value (λ2/λ1) = 1 and a variation in the (A2,opt(t)/A2,max) values from 0.714 to 0.823 for the whole range of different parent/daughter nuclide pairs are presented. Both diagrams in Figure 9 show a beautiful symmetric shape irrespective of the daughter nuclide living longer or shorter than its parent. This characteristics means that the value (topt(t)/tmax) and accordingly the value (A2,opt(t)/A2,max) only depend on the decay constant ratio (λ2/λ1) of parent/daughter nuclide systems, but not on any other specified parameter of the parent or its daughter nuclide. This statement is clearly justified by Equation (11) and thus the value topt(t) is proved as a characteristic physical parameter of the formation-decay process kinetics of given parent/daughter nuclide pair system.
Molecules 2014, 19
7741
Table 1. Optimal build-up time and radioactivity of daughter nuclide in different radionuclide generator systems: tmax, topt(t), and topt(SA) values are calculated using Equations (2), (11) and (14), respectively. A2,max, A2,opt(t), and A2,opt(SA) are the daughter nuclide activities at the build-up time tmax, topt(t), and topt(SA), respectively, which are calculated using Equation (1) and relevant build-up time values. The half-life time data are from References [19,20]. Radioisotope Parent R1-Daughter R2 99m
Tc–99Tc 93m Mo–93Mo 83m Sr–83Sr 131 Te–131I 82m Br–82Br 67 Ge–67Ga 57 Ni–57Co 125 Xe–125I 149 Nd–149Pm 95 Ru–95Tc 131m Te–131I 123 Xe–123I 52 Ti–52V 131 Ba–131Cs 47 Ca–47Sc 95 Zr–95Nb 38 S–38Cl 14 °Ba–14°La 72 Se–72As 99 Mo–99mTc 115 Cd–115mIn 97 Zr–97Nb 8 m ° Br–8°Br
Half life Parent Nuclide T1
Daughter Nuclide T2
6.02 h 6.9 h 5.0 s 25 min 6.13 min 18.7 min 36.16 h 17 h 1.73 h 1.63 h 30 h 2.08 h 1.7 min 11.8 d 4.536 d 64.05 d 169.7 min 12.74 d 8.4 d 66.02 h 53.46 h 16.9 h 4.42 h
214000 y 3500 y 1.35 d 192.96 h 35.3 h 78.26 h 270.9 d 59.89 d 53.08 h 20 h 8.04 d 13.3 h 3.76 min 9.69 d 3.351 d 34.98 d 37.24 min 40.272 h 26 h 6.007 h 4.486 h 72.1 min 17.4 min
λ2/λ1
tmax
topt(t)
(topt(t)/tmax)
(A2,opt(t)/A2,max)
topt(SA)
(topt(SA)/tmax)
(A2,opt(SA)/A2,max)
3.21 × 10⁻⁹ 2.25 × 10⁻⁷ 4.27 × 10⁻⁵ 2.16 × 10⁻³ 2.90 × 10⁻³ 3.98 × 10⁻³ 5.56 × 10⁻³ 1.18 × 10⁻² 3.26 × 10⁻² 8.15 × 10⁻² 1.55 × 10⁻¹ 1.56 × 10⁻¹ 4.52 × 10⁻¹ 1.22 1.35 1.83 4.56 7.59 7.76 11.00 11.90 14.10 15.20
170.09 152.14 0.0201 3.6984 0.8641 2.4955 272.10 110.13 8.8358 6.4218 95.425 6.6033 0.0592 369.75 134.63 1613.3 1.7401 135.65 88.231 22.849 17.460 4.9339 1.2196
10.91 12.51 0.0025 0.75 0.184 0.56 64.73 30 2.92 2.52 41.52 2.87 0.029 184.5 67 795.1 0.79 57.61 37.3 9.145 6.9 1.89 0.461
0.064 0.082 0.125 0.203 0.219 0.224 0.238 0.272 0.330 0.392 0.435 0.435 0.489 0.499 0.498 0.493 0.454 0.425 0.423 0.400 0.395 0.383 0.378
0.714 0.715 0.715 0.721 0.723 0.725 0.729 0.737 0.756 0.780 0.797 0.797 0.821 0.823 0.823 0.821 0.804 0.793 0.792 0.783 0.781 0.776 0.774
3.29 2.19 237.5 94 7.28 5.05 72.65 5.02 0.042 232.1 83.25 957.2 0.88 62.16 40.2 9.685 7.3 1.98 -
0.889 0.877 0.872 0.853 0.823 0.786 0.761 0.760 0.709 0.627 0.618 0.593 0.505 0.458 0.455 0.423 0.418 0.401 -
0.999 0.998 0.998 0.996 0.992 0.982 0.973 0.973 0.950 0.911 0.906 0.893 0.847 0.823 0.821 0.805 0.803 0.794 -
Molecules 2014, 19
7742 Table 1. Cont.
Radioisotope Parent R1-Daughter R2 125
Sb–125mTe 52 Fe–52mMn 87 Y–87mSr 132 Te–132I 62 Zn–62Cu 188 W–188Re 122 Xe–122I 1 3 ° Pd–1°3mRh 28 Mg–28Al 128 Ba–128Cs 1 3 ° Ru–1°3mRh 1 9 ° Pd–1°9mAg 81 Rb–81mKr 113 Sn–113mIn 118 Te–118Sb 178 W–178Ta 9 °Sr–9°Y 195m Hg–195mAu 68 Ge–68Ga 42 Ar–42K 144 Ce–144Pr 82 Sr–82Rb 44 Ti–44Sc 191 Os–191mIr 1 9 ° Cd–1°9mAg 137 Cs–137mBa
Half life Parent Nuclide T1
Daughter Nuclide T2
2.77 y 8.3 h 80.3 h 78.2 h 9.2 h 69.4 d 20.1 h 16.96 d 20.91 h 2.4 d 39.35 d 13.43 h 4.6 h 115.1 d 6d 21.5 d 28.82 y 40 h 271 d 32.9 y 284.9 d 25 d 48.2 y 15.4 d 453 d 30.14 y
58 d 21.1 min 2.8 h 2.3 h 9.7 min 16.98 h 3.6 min 56.12 min 2.24 min 3.6 min 56.12 min 39.8 s 13.1 s 1.7 h 3.5 min 9.3 min 64 h 30.6 s 68.3 min 12.36 h 17.28 min 1.3 min 3.9 h 4.96 s 39.8 s 2.552 min
λ2/λ1
tmax
topt(t)
(topt(t)/tmax)
(A2,opt(t)/A2,max)
topt(SA)
(topt(SA)/tmax)
(A2,opt(SA)/A2,max)
17.40 23.60 28.60 34.10 56.90 98.20 3.35 × 10² 4.37 × 10² 5.60 × 10² 9.58 × 10² 1.01 × 10³ 1.21 × 10³ 1.27 × 10³ 1.62 × 10³ 2.47 × 10³ 3.33 × 10³ 3.95 × 10³ 4.71 × 10³ 5.71 × 10³ 2.34 × 10⁴ 2.37 × 10⁴ 2.77 × 10⁴ 1.09 × 10⁵ 2.68 × 10⁵ 9.82 × 10⁵ 6.20 × 10⁶
6090.6 1.6755 14.069 12.063 0.9595 113.49 0.5049 8.2235 0.3415 0.5950 9.3456 0.1133 0.0375 18.146 0.6577 1.8148 763.72 0.1037 14.211 179.43 4.1869 0.3198 65.068 0.0248 0.2201 0.9599
2245 0.58 4.7 3.91 0.28 30.1 0.108 1.69 0.067 0.109 1.692 0.02 0.0065 3.1 0.106 0.28 116 0.0155 2.063 22.4 0.522 0.039 7.07 0.0025 0.02 0.077
0.368 0.346 0.334 0.324 0.292 0.265 0.214 0.205 0.196 0.183 0.181 0.176 0.173 0.171 0.161 0.155 0.152 0.149 0.145 0.125 0.125 0.122 0.109 0.101 0.091 0.080
0.771 0.761 0.757 0.754 0.741 0.736 0.723 0.722 0.718 0.720 0.718 0.718 0.713 0.720 0.718 0.715 0.717 0.718 0.716 0.715 0.715 0.712 0.716 0.715 0.714 0.714
2335 0.6 4.8 4 0.289 30.35 0.108 1.69 0.067 0.109 1.692 0.02 0.0065 3.1 0.106 0.28 116 0.0155 2.063 22.4 0.522 0.039 7.07 0.0025 0.02 0.077
0.383 0.358 0.341 0.331 0.301 0.267 0.213 0.205 0.196 0.183 0.181 0.176 0.173 0.170 0.161 0.154 0.151 0.149 0.145 0.124 0.124 0.121 0.108 0.100 0.090 0.080
0.786 0.774 0.765 0.762 0.753 0.739 0.723 0.722 0.718 0.720 0.718 0.718 0.713 0.720 0.718 0.715 0.717 0.718 0.716 0.715 0.715 0.712 0.716 0.715 0.714 0.714
Molecules 2014, 19
7743
The rule controlled in the relationship between the (topt(t)/tmax) and (λ2/λ1) values described in Equation (11) is independent on the fact that the daughter nuclide lives longer or shorter than its parent and that how long they live. In other words, this rule is the following: The shorter or longer the daughter nuclide lives compared with the lifetime of its parent, the shorter is the optimal build-up time topt(t) of daughter nuclide compared with its maximal build-up time tmax. The value of ratio (topt(t)/tmax) is 0.5 for any parent/daughter nuclide pair of equal lifetime. The value of ratio (topt(t)/tmax) is 0.05 for any parent/daughter nuclide pair of a lifetime difference of >3 × 10⁸ times. Accordingly, the shorter or longer the daughter nuclide lives compared with the lifetime of its parent, the smaller is the build-up activity achieved at the time topt(t) of daughter nuclide compared with its maximal build-up activity at the time tmax .The value of ratio (A2,opt(t)/A2,max) is 0.823 for any parent/daughter nuclide pair of equal lifetime. The value of ratio (A2,opt(t)/A2,max) is 0.70 for any parent/daughter nuclide pair of a lifetime difference of >3 × 10⁸ times. Figure 9. Optimal build-up time value topt(t) and radioactivity value A2,opt(t) of daughter nuclides compared with values tmax and A2,max, respectively, in function of decay constant ratio (λ2/λ1): (a) Ratio (topt(t)/tmax); (b) Ratio (A2,opt(t)/A2,max); T1 and T2 are the half-life times of the parent and daughter nuclides, respectively.
Molecules 2014, 19 Figure 10. Optimal build-up time topt(SA) and radioactivity A2,opt(SA) of daughter nuclides compared with tmax and A2,max values, respectively, in function of decay constant ratio (λ2/λ1): (a) Ratio (topt(SA)/tmax); (b) Ratio (A2,opt(SA)/A2,max); T1 and T2 are the half-life times of the parent and daughter nuclides, respectively.
Figure 11. Ratio of optimal build-up times (topt(t)/topt(SA)) and Ratio of optimal build-up radioactivity (A2,opt(t)/A2,opt(SA)) of daughter nuclides in function of decay constant ratio (λ2/λ1): (a) Ratio (topt(t)/topt(SA)); (b) Ratio (A2,opt(t)/A2,opt(SA)); T1 and T2 are the half-life times of the parent and daughter nuclides, respectively.
7744
Molecules 2014, 19
7745
It is found that at the optimal build-up time topt(t) the daughter nuclide activity varies in the range from 71.4% to 82.23% of the maximal build-up activity at the maximal time tmax, whereas the optimal build-up time topt(t) changes only from 5% to 50%. This fact leads to a useful application in the cost-effective operation of radionuclide generators that all generator elutions could be performed at the optimal build-up time topt(t) instead of being performed at the maximal time tmax. The elutions performed at optimal build-up time topt(t) result in a significant saving in the standby time of the generator, thus economic use of the generator. The following examples will clarify the effectiveness of the elution plan performed at the optimal build-up time topt(t). First example for the case of the parent and daughter nuclides of moderate difference in their half lives: The maximal build-up time of 99mTc nuclide in 99Mo/99mTc generator system is tmax = 22.86 h. The 99mTc radioactivity build-up for the elution performed at optimal build-up time topt(t) = 9.145 h is 78.3% of the maximal build-up at the time tmax = 22.86 h. This fact dictates that the elution performed at optimal build-up time topt(t) saves 13.715 h or 60% of standby time of the generator whereas the optimal 99mTc-activity build-up loses only 21.7% compared with the elution performed at the time tmax. Despite the 21.7% loss in each elution performed at the optimal time topt(t), the total yields of consecutive elutions performed at optimal 9.145-h build-up time will be 1.75 times higher than the yield of one elution performed at the time tmax as evaluated by the method of early elution schedule described in Section 2.1.3 (Results shown in Figure 12). Second example for the case of the parent and daughter nuclides of big difference in their half life: The maximal build-up time of 68Ga nuclide in 68Ge/68Ga generator system is tmax = 14.1 h. The 68Ga radioactivity build-up for the elution performed at optimal build-up time topt(t) = 2.063 h is 71.6% of maximal build-up at the time tmax = 14.1 h. This fact dictates that the elution performed at optimal build-up time topt(t) saves 12.037 h or 85.5% of standby time of the generator, whereas the optimal 68 Ga–build-up activity loses only 28.4% compared with the elution performed at the time tmax. Despite the 28.4% loss in each elution performed at the optimal time topt(t), the total yields of consecutive elutions performed at 2.063-h optimal build-up time will be 5.0 times higher than the yield of one elution performed at the time tmax as evaluated by the method of early elution schedule described in Section 2.1.3 (Results shown in Figure 12). In conclusion, it is stated that the optimal build-up time topt(t) defined by the mathematical equation:
(
2λ2topt (t ) + 1 2λ1topt (t ) + 1
)−e
( λ2 − λ1 ) topt ( t )
=0
is the second characteristic parameter of the kinetics of formation-decay process of the parent/daughter nuclide system, which has a defined physical meaning and can be effectively used in the optimal management of practical radionuclide generator operation . This parameter and the first one (the maximal build-up time tmax = [ln(λ2 / λ1 )] / (λ2 − λ1 ) ) are equally significant to better understand the kinetics of the formation-decay process of parent/daughter nuclide systems and to be used in the practice of radionuclide generator production and application as well.
Molecules 2014, 19
7746
Figure 12. Effectiveness of daughter nuclide activity utilisation of generators eluted with an early elution schedule compared with that normally eluted at the maximal time of daughter nuclide build-up (Data mark-points are experimental and dashed lines are theoretical calculation results): (a) 99mTc from 99Mo/99mTc generator; (b) 68Ga from 68Ge/68Ga generator.
The diagrams of the build-up time ratio (topt(SA)/tmax) and build-up radioactivity ratio (A2,opt(SA)/A2,max) plotted against decay constant ratio (λ2/λ1), which are based on the results of the optimisation of daughter nuclide activity build-up versus specific activity (or versus total build-up daughter nuclide atom numbers per unit of daughter nuclide build-up activity) reported in Table 1, are shown in Figure 10. The plots show defined characteristics of daughter nuclide build-up kinetics in relation with the decay constant ratio (λ2/λ1) of parent/daughter nuclide systems. The diagrams reveals the upper limits of ratio (topt(SA)/tmax) ≈ 0.96 and ratio (A2,opt(SA)/A2,max) ≈ 1 at the ratio value (λ2/λ1) < 10−9 and the lower limits of ratio (topt(SA)/tmax) ≈ 0.05 and ratio (A2,opt(SA)/A2,max) ≈ 0.714 at the ratio value (λ2/λ1) > 107. A variation in the (topt(SA)/tmax) values from 0.05 to 0.96 for the whole range of different parent/daughter nuclide pairs and the (A2,opt(SA)/A2,max) values from 0.714 to 1.0 have been noted accordingly. Both diagrams show no maximum and they are inflected at the (λ2/λ1) ratio value between (λ2/λ1) = 1 and (λ2/λ1) = 10. The values (topt(SA)/tmax) = 0.627 and (A2,opt(SA)/A2,max) = 0.911 are found at the ratio value (λ2/λ1) = 1. The rule controlled in the relationship between the (topt(SA)/tmax) values (and accordingly (A2,opt(SA)/A2,max) values) and (λ2/λ1) values described in Equation (14) is the following: The shorter the daughter nuclide lives compared with the life time of its parent, the smaller is the optimal build-up time topt(SA) of daughter nuclide compared with its maximal build-up time tmax. Accordingly, the shorter the daughter nuclide lives compared with the life time of its parent, the smaller is the build-up activity achieved at the optimal time topt(SA) of daughter nuclide compared with
Molecules 2014, 19
7747
its maximal build-up activity at the time tmax. The value of ratio (A2,opt(SA)/A2,max) is achievable in the range 0.714–1.0 for all parent/daughter nuclide pairs. These results mean that the value (topt(SA)/tmax) and accordingly (A2,opt(SA)/A2,max) only depend on the decay constant ratio (λ2/λ1) of parent/daughter nuclide systems, but not on any other specified parameter of parent or its daughter nuclides, with an assumption of using the specific activity formulation which is based on the equality between the total atom numbers of all involved daughter nuclides and the atom numbers of decayed parent nuclides N = N1,0 × (1 − e− λ ⋅t ) as described in Section 2.1 (the isomer transformations of parent nuclides to form daughter nuclides are excluded). Obviously, this assumption makes the optimal build-up time topt(SA) become a non-characteristic parameter in a general meaning. However, it still plays an important role in the practical application in the production and use of radionuclide generators, because it is specifically characterised for a specified nuclear transformation process which generates a daughter nuclide of total atom numbers equal to the numbers of decayed parent nuclides as mentioned above. This justification is clarified by a coordinative discussion on the combination of topt(SA) with the characteristic parameter topt(t) mentioned previously in this section. As shown in Figure 11, the difference between topt(t) and topt(SA) values is small for the range of half-lives T1 > T2 (or λ2 > λ1). So the use of topt(t) and topt(SA) values in the optimal daughter nuclide build-up management of practical generator production and utilisation is harmonised in term of effective and optimal generator use for an improved quality (i.e., specific activity) of daughter nuclide solution. 1
4.1.2. Early Elution Schedule for Improvement of Daughter Nuclide Production Yield and Specific Radioactivity, Elution of 99Mo/99mTc and 68Ge/68Ga Generator-Concentrator Systems as the Cases The early elution schedule method described in Section 2.1.3 is used to evaluate the total yield of daughter nuclides produced from the generator by performing multiple elutions/separations. The partial build-up radioactivities of daughter nuclides at given standby times are eluted and the sum of all radioactivities obtained is compared with the radioactivity obtained in the elution performed at maximal build-up time (tmax). The calculation (using Equations (15)–(17), Section 2.1.3) and experimental results of Ry yield ratio assessment are reported in two typical examples below. Example 1. 99Mo/99mTc generator-concentrator system: The maximal build-up time of 99mTc daughter nuclide in 99Mo/99mTc generator system is tmax = 22.86 h. 99mTc build-up radioactivities achieved in the consecutive elutions performed at optimal 99mTc-radioactivity build-ups 78.3% (at topt(t) = 9.145 h) and 80.5% (at topt(SA) = 9.685 h) are shown in Table 1 and Figure 1. Despite the optimal build-up times of 99mTc daughter nuclide in 99Mo/99mTc generator system between 40.0% and 42.3% compared with maximal build-up time as evaluated in the above mentioned optimisation assessment, more effective utilisation of hot 99mTc atoms may be found if only a partial build-up of 99m Tc in the generator is allowed to occur at a build-up time shorter than optimal build-up time (95%. Elution Time Early elution schedule of 68
Ga-concentration
2.0 h Ga -buid-up time (6 elutions/day) performed
The yield of generator
with support of
elution at 2-h
RADIGIS- Ga system
build-up time (mCi)
Elution at maximal
68
68
(mCi/mL)
concentrating process (* An
Total yield of
elution at 12 h (instead of
generator elution at
tmax = 14.1h) build-up time
maximal 68Ga-build-up
Ga-build-up time without
10
12
14
16
18
20
Total 68Ga-Activity
am
am
am
pm
pm
pm
pm
Produced
22.8
16.5
16.4
16.5
16.6
16.4
17.1
12.4
12.3
12.4
12.5
12.3
3.4
-
-
-
-
-
68
(mCi/mL)
68
8
Ga-concentration
applied with an error of 5%) time, mCi
16. 4 12. 3 3.3
-
91.3
-
* 17.1
-
-
-
-
-
16.
33.9
8
The experimental results reported in Table 3 confirm that the concentration and the yield of 68Ga solution eluted with an optimal 2-h elution-schedule (“Early Elution Schedule” combined with “Build-up time Optimisation”) are much better than that achieved with the elution performed at maximal build up time. This elution plan offers cost-effective utilisation of 68Ge/68Ga generator system because the total useful 68Ga radioactivity gathered in 6 consecutive elutions (overall time period is 12 h) is 3 times higher (Ry = 3) than that eluted once at time tmax = 14.1 h (The significant difference between practical value Ry = 3 and theoretical value Ry = 5 is coming from the over-evaluation caused by an overnight time overlap). Another advantage of consecutive elution performed at the optimal 2-h build-up time is the improvement in the quality of 68Ga solution in terms of reduction of Zn content in the 68Ga-eluate. An amount of 3.38 × 10⁻³ nmol 68Zn was evaluated at the optimal 2-h build-up time compared with the value of 0.05 nanomoles at the maximum 68Ga build-up time tmax = 14.1 h for the 18 mCi 68Ge/68Ga generator system. 4.3. Effective Control of Radionuclidic Purity: Relationship between Detection Limit, Required Radionuclidic Impurity Limit, Measurement Certainty for the Optimisation of Decay Time and QC Sample Radioactivity Used for Post-Delivery Quality Control, Quality Control of 68Ga Solution as a Case (Referred to Section 2.3)
As described in Section 2.3, the optimisation of decay time and QC sample radioactivity for the effective control of radionuclidic purity of daughter nuclide solution is determined by both the regulatory parameter L (required radionuclidic impurity limit) and technical parameters such as LD
Molecules 2014, 19
7751
(detection limit) and R (measurement certainty). LD value depends on the count base line of gamma-ray energy-spectrum (specifically, on the background counts of photo-peaks of interest). The result of LD value determination using ORTEC gamma-ray spectrometer mentioned above is shown in Figure 13. This result is used in the optimisation of decay time and QC sample radioactivity based on Equations (31)–(41) in Section 2.3 for effective radionuclidic purity of control of the daughter nuclide solutions produced from different radionuclide generators in our laboratory. Figure 13. Detection limits of photo peaks, LD (not corrected with detector counting efficiency and gamma ray yield) evaluated from a background spectrum of blank sample measured for 36,000 s on HP Ge detector coupled ORTEC gamma-ray spectrometer.
68
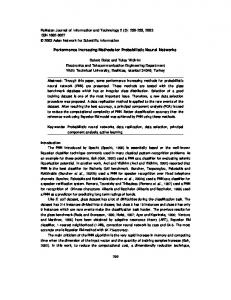
Ga-solution: To demonstrate the effectiveness of optimisation methods developed in this paper, the control of 68Ge-impurity of 68Ga-solution which is produced from RADIGIS-68Ga system is shown below. 68Ga (T1/2 = 68 min.), which is a positron emitter used for PET imaging in nuclear medicine, is produced from 68Ge/68Ga radionuclide generator. The main impure radionuclide in 68Ga solution is 68 Ge (T1/2 = 271 days) which is a parent nuclide of 68Ga. 68Ge is an electron capture radioisotope with low energy X-ray radiation. 68Ge contaminates 68Ga product solution due to its breakthrough during the elution of 68Ga from the generator column on which the parent nuclide 68Ge is immobilized. The 68 Ge breakthrough in 68Ga eluate was determined based on the counts of the 511-keV photopeak of 68 Ga activity which is in radioactive equilibrium with impure 68Ge activity. Because the majority of activity in the product eluate is 68Ga activity which is not in equilibrium with 68Ge activity at the sampling time, for the certain measurement of impure 68Ge activity of the 68 Ga-eluate sample, this sample should be left for a given time so as the majority of non-equilibrium 68 Ga activity decays to a reasonable degree to minimize the influence of the non-equilibrium 68Ga activity of 68Ga eluate sample. A relationship between the measurement certainty R, decay time t and required 68Ge breakthrough (impurity) limit L is established as follows:
Molecules 2014, 19
7752
Figure 14. Certainty parameter R versus decay time t of the 68Ge impure radionuclide in 68Ga radioisotope product at different required radio-nuclidic impurity limits L. Poisson distribution 95% confidence interval, C ± 1.96 C , with error < 8.77% for count numbers > 500; R(%) = 100 × (Activity of 68Ge/(Activity of 68Ge + Activity of 68Ga).
Detection limit of 68Ge measured at photo peak 511 keV with a blank sample using ORTEC gamma ray spectrometer mentioned above is LD = 0.055 × 10⁻⁶ μCi or 2.035 Bqs ( using the data shown in Figure 13 corrected with detector counting efficiency). With a given certainty of measurement R = 98% and a required 68Ge breakthrough (impurity) limit L = 10−3% of the activity of the 68Ga eluate as stated in literature EANM-Monograph-2464-2011 (18), Table 4 and Figure 14 (which plotted from Equation (31b) show that a 25.2 h decay time is required for the 68Ga eluate sample to be left to decay before starting a reliable gamma-ray spectrometric 68Ge activity measurement. The minimal radioactivity A0,P of the 68Ga eluate sample taken out from 68Ga product solution at the sampling time, which is used for the measurement of 68Ge breakthrough activity after decaying for 25.2 h, is calculated using Equation (34) which is re-written for 68Ge/68Ga nuclide pair as follows: A0,Ga − 68 P =
100 LD ,Ge −68 LGe −68
⋅ e λGe−68 ⋅( λGa−68 −λGe−68 )
−1
⋅ln (100⋅ R /((100 − R )⋅ LGe−68 ))
The A0,P calculation given above ensures an insignificant interference for the 68Ge breakthrough (impurity) activity measurement of the 68Ga eluate sample with respect to the justified values of R and L required by regulatory compliance. Based on the assessment method described above, the 68Ga eluate sample of >117.55 μCi activity was justified for a reliable measurement of 68Ge breakthrough activity after the sample decay for a time period t = 25.2 h. The measurement was performed using ORTEC gamma ray spectrometer with counting time >30 min. The 68Ge breakthrough activity in the
Molecules 2014, 19
7753
68
Ga eluate eluted from our generators was 500. R (%) = 100 × ( Activity of
68
Ge / ( Activity of
Activity of 68Ga–sample taken out Required from 68Ga–product solution at the decay product delivery time point time t, (Measurement: 640 min counting for hours collecting 1000 counts; Error 6.2%)
68
Ge + Activity of
68
Ga) .
Activity of 68Ga–sample taken out from 68Ga–product solution at the product delivery time point (Measurement: 30 min counting for collecting 1000 counts; Error 6.2%)
Required radionuclidic impurity limit L, %
Required certainty degree R, %
0.01
98
21.43
0.55 μCi
11.74 μCi
0.001
98
25.20
5.51 μCi
117.55 μCi
0.0001
98
28.96
55.17 μCi
Note: Counting rate (cps) at 511 keV = (Detection limit × Gamma ray yield × Counting efficiency) = 2.035 Bqs × 1.78 × 0.0072 = 0.026 cps. Counting time, t = 1000 counts/0.026 cps = 640 min 99m
1176.96 μCi Note: Proportional increase in sample activity can be used to reduce measurement time
Tc-solution: The 99mTc-solution produced from the 99mTc-generators may contain the 99 Mo-parent nuclide and a number of extraneous contaminants such as 103Ru, 131I, 132Te, 99Zr, 124Sb, 134 Cs, 89Sr, 90Sr, and 86Rb. The 99Mo-contamination is measured by the “shielding” method as mentioned in Section 2.3. The 760 keV and 780 keV photons of the 99Mo contamination in 99mTc-solution housed in a 6 mm thick lead pot are measured in a dose calibrator. Other gamma-emitting nuclide contaminations with the contamination limits (L values) required by USP-32 [22] are checked by the “decay” method as mentioned in Section 2.3.2. (The β− and α-emitting nuclides are not more than 0.01% of 99mTc activity and 0.001nCi/mCi99mTc, respectively). The γ-emitting radionuclide contaminations can be checked by a gamma-ray spectrometer after allowing 99mTc to decay to a certain extent. For demonstration of the “decay” method developed in this paper, the example of the optimisation of 131I contamination determination is detailed as follows: The 131I contamination limit (L) in the 99mTc-solution required by USP-32 is L = 0.05 μCi/mCi 0.05 Bq/kBq) 99mTc or in percentage L = 0.005%. The ORTEC multichannel gamma-ray spectrometer coupled with HP-Ge detector is used. As experienced, the dead time of the spectrum acquisition using this system is 1% for the 99mTc-sample activity At,P = 2 μCi 99mTc. Referred to Section 2.3.2, Equations (35)–(37) are used for calculate the optimal decay time t and the minimum activity of the QC sample of 99mTc solution taken at the 99mTc-product delivery time for a gamma-ray spectrometric measurement after allowing 99mTc to decay to the value At,P = 2 μCi 99mTc. The LD value for the 0.365 MeV photon of the 131I nuclide, which is corrected with a counting efficiency ɛ = 0.007 and gamma yield y = 82%, is LD = 8.7cps (the uncorrected value shown in Figure 13 is LD = 5 × 10⁻² cps):
Molecules 2014, 19
7754
λI-131 = 9.98 × 10⁻⁷ sec−1; λTc-99m = 3.19 × 10⁻⁵ sec−1 L FLA = D A t ,P
8.7 = 11.75 ×10−5 = 3 2 37 10 × ×
L 0.005 ln ln −5 F ⋅100 11.75 × 10 × 100 = = 26784 sec = 7.44 h t = LA 9.98 × 10 −7 − 3.19 × 10⁻⁵ λi − λ
A0, P = At , P / e
− λ ⋅t
= At , P ⋅ e
(
λ L )⋅ln λi − λ FLA ⋅100
= 2 / e −3.19×10
−5
× 26000
= 4.58 μCi
Based on the obtained results, it is stated that the 99mTc-sample of ~5 μCi activity is suitable for the determination of 131I contamination by gamma-ray spectrometry after allowing 99mTc-sample to decay for a time period of 7.44 h. The same process will be performed to assess the optimal decay time and the minimal activity of the QC sample of 99mTc-solution for other radionuclide contaminations of the 99m Tc-solution. Finally, among the assessed samples, the largest activity sample allowed to decay for a corresponding longest decay time will be suitable for a gamma-ray spectrometric measurement of different radionuclide contaminations of the 99mTc-solution. 5. Conclusions
Optimisation method of daughter nuclide build-up versus stand-by time and specific activity using mean progress functions were successfully developed for increasing the performance of radionuclide generators. A new characteristic parameter (optimal build-up time topt(t)) of the formation-decay kinetics of parent/daughter nuclide systems was found and effectively used in the practice of generator production and utilisation. The combination of the post-elution concentration process, the build-up time optimisation method, and the “early elution schedule” method is the most suitable way to operate the generator effectively on the basis of economic use and improvement of purposely suitable quality of the produced daughter radionuclide, thus there is an increase in the effectiveness of parent/daughter nuclide utilisation. The relationships between gamma ray spectrometric detection limit, required limit of impure radionuclide activity and its measurement certainty with respect to optimising decay/measurement time and product sample activity used for radionuclidic purity quality control were studied and formulated in the format of mathematical equations which are useful for the spectrometric measurement of very low activity of impure radionuclide contamination in a radioisotope product of much higher activity used in molecular PET and SPECT imaging and monoclonal antibody/peptide-targeted radiotherapy. Acknowledgments
The author would like to thank MEDISOTEC and Cyclopharm Ltd. for financial support for the Radionuclide Development Project which includes this research activity.
Molecules 2014, 19
7755
Author Contributions
It is stated that the contribution of all co-authors to this research work has been recognised as follows. Van So Le as a main author, Minh-Khoi Le and Natalie Nha-Truc Le have completed the mathematical equation development, experimental design, and radionuclide generator development/evaluation. Vicki Le and Zoe Phuc-Hien Do in coordination with main author have performed the data analysis, assessment and technical report preparation. Conflicts of Interests
The author declares no conflict of interests. References
Mushtaq, A.; Vandegrift, G.; Cristini, P. Molybdenum-99 (99Mo): Past, present, and future. Sci. Technol. Nucl. Install. 2014, doi:10.1155/2014/839369. 2. Genka, T. Development of PZC-based Tc-99m Generator. In Proceedings of the Forum for Nuclear Cooperation in Asia (FNCA), Tokyo, Japan, 7–9 February 2007; pp. 1–10. 3. Le, V.S.; Morcos, N.; Bogulski, Z. Development of multiple-elution cartridge-based radioisotope concentrator device for increasing the 99mTc and 188Re concentration and the effectiveness of 99m Tc/99Mo utilization. J. Radioanal. Nucl. Chem. 2014, in press. 4. Le, V.S.; Morcos, N.; McBrayer, J. A Radioisotope Concentrator. International Patent Application Published under Patent Cooperation Treaty (PCT), World Intellectual Property Organisation (WIPO), International Publication Number WO 2014/063198 A1, 1 May 2014. 5. Le, V.S. 99mTc generator preparation using (n,γ)99Mo produced ex-natural molybdenum. In Proceedings of the FNCA 2001 Workshop on the Utilization of Research Reactors, Beijing, China, 5–9 November 2001. 6. Le, V.S. 99mTc Generator Development: Up-to-date 99mTc-recovery technologies for increasing the effectiveness of 99Mo utilization. Sci. Technol. Nucl. Install. 2014, doi:10.1155/2014345252. 7. Le, V.S. Gallium-68 Generator Integrated System: Elution-purification-concentration integration. Rec. Res. Can. Res. 2013, 194, 43–75. 8. Le, V.S.; Le, M.K. Multifunctional Sorbent Materials and Uses Thereof. Australia Patent Application, AU2013903629, 20 September 2013. 9. Le, V.S. Gallium-68 Purification. U.S. Patent Application Publication, U.S. 2013/0055855 A1, 7 March 2013. 10. Le, V.S. Sorbent Material. U.S. Patent Application Publication, U.S. 2013/0048568 A1, 28 February 2013. 11. Le, V.S. Specific Radioactivity of Neutron Induced Radioisotopes: Assessment Methods and Application for Medically Useful 177Lu Production as a case. Molecules 2011, 16, 818–846. 12. Oehlke, E.; Le, V.S.; Lengkeek, N.; Pellegrini, P.; Jackson, T.; Greguric, I.; Weiner, R. Influence of Metal ions on the Ga-68-labeling of DOTATATE. Appl. Radiat. Isot. 2013, 82, 232–238. 1.
Molecules 2014, 19
7756
13. Le, V.S.; Nguyen, C.D.; Bui, V.C.; Vo, C.H. Preparation of Inorganic Polymer Sorbents and Their Application in Radionuclide Generator Technology. In Therapeutic Radionuclide Generators: 90Sr/90Y and 188W/188Re Generators; International Atomic Energy Agency: Vienna, Austria, 2009; Chapter 20. 14. Le, V.S.; Nguyen, C.D.; Pellegrini, P.; Bui, V.C. Polymeric Titanium Oxychloride Sorbent for 188 W/188Re Nuclide Pair separation. Sep. Sci. Technol. 2009, 44, 1074–1098. 15. Le, V.S.; Lambrecht, R.M. Development of alternative Technologies for a gel-type chromatographic 99mTc Generator. J. Label. Compd. Radiopharm. 1994, 35, 270–272. 16. Le, V.S. Preparation of chromatographic and solid-solvent extraction 99mTc generator using gel-type targets. In Proceedings of the 1999 Workshop on the Utilization of Research Reactors, Tokai & Mito, Japan, 25 November–2 December 1999. 17. Longworth, G. Radiochemical Manual, 1st ed.; AEA Technology plc, Analytical Services Group: Harwell, Oxfordshire, UK, 1998. 18. Glimore, G.; Hemingway, J.D. Practical Gamma-Ray Spectrometry, 1st ed.; John Wiley & Sons: Chichester, UK, 2004. 19. Parrington, J.R.; Knox, H.D.; Breneman, S.L.; Baum, E.M.; Feiner, F. Nuclides and Isotopes, 15th ed.; Lockheed Martin, GE Nuclear Energy: San Jose, CA, USA, 1996. 20. Firestone, R.B. Table of Isotopes, 8th ed.; Wiley-Interscience: New York, NY, USA, 1996. 21. European Association of Nuclar Medicine EANM-Monograph 2464. Gallium-Chloride (68Ga) solution for radiolabelling. Pharmeuropa 2011, 23, 507–509. 22. United States Pharmacopeial Convention. US Pharmacopeia 32 & National Formulary 27; United States Pharmacopeial Convention: Rockvile, MD, USA, 2009. Sample Availability: Not available.
© 2014 by the authors; licensee MDPI, Basel, Switzerland. This article is an open access article distributed under the terms and conditions of the Creative Commons Attribution license (http://creativecommons.org/licenses/by/3.0/).