Ghazal Keshavarz et al. / International Journal on Computer Science and Engineering (IJCSE)
Metric for Early Measurement of Software Complexity Ghazal Keshavarz Computer Science Science and Research Branch, Islamic Azad University Tehran, Iran
[email protected]
Dr. Nasser Modiri Computer Science Islamic Azad University Zanjan, Iran
[email protected]
Dr. Mirmohsen Pedram Computer Science Tarbiat Mollem University Karaj, Iran
[email protected] Abstract— Software quality depends on several factors such as on time delivery; within budget and fulfilling user's needs. Complexity is one of the most important factors that may affect the quality. Therefore, measuring and controlling the complexity result in improving the quality. So far, most of the researches have tried to identify and measure the complexity in design and code phase. However, when we have the code or design for software, it is too late to control complexity. In this article, with emphasis on Requirement Engineering process, we analyze the causes of software complexity, particularly in the first phase of software development, and propose a requirement based metric. This metric enables a software engineer to measure the complexity before actual design and implementation and choose strategies that are appropriate to the software complexity degree, thus saving on cost and human resource wastage and, more importantly, leading to lower maintenance costs. Keywords- Requirement Engineering (RE), Software Complexity, Software Metric I. INTRODUCTION In recent decades, software complexity has created a new era in computer science [1]. Software complexity could be defined as the main driver of cost, reliability and performance of software. Nonetheless, there is no common agreement on software complexity definition, but most of them is based on zuse view of software complexity [2]," software complexity is the degree of difficulty in analyzing, maintaining, testing, designing and modifying software". In other words, software complexity is an issue that is in the entire software development process and every stage of software development life cycle (SDLC). In the development phases of software, complexity strongly influences the required effort to analyze and describe requirements, design, code, test and debugging the system. In maintenance phases, complexity specifies the difficulty in error correction and the required effort to change different software module. Requirements form the foundation of the software development process. Loose foundation brings down the whole structure and weak requirements documentation (that is the result of Requirement Engineering process) leads to project failure. Recent surveys suggest that 44% to 80% of all defects are inserted in the requirements phase [3]. Thus, if errors are not identified in the requirements phase, it is leading to make mistakes, wrong product development and loss valuable resource. Well-defined requirements will increase the likelihood of the overall success of the software project. However, it will not be possible to develop better quality requirements without a well-defined RE process. Since RE is the starting point of Software Engineering and later stages of software development rely heavily on the quality of requirements, there is a good reason to pay close attention to it.
ISSN : 0975-3397
Vol. 3 No. 6 June 2011
2482
Ghazal Keshavarz et al. / International Journal on Computer Science and Engineering (IJCSE)
According to CHAOS report published by the Standish Group [4], good RE practices contribute more than 42% towards the overall success of a project, much more than other factors (see Table 1). TABLE 1. Project Success Factors
Project Success Factors User involvement Executive Management Support Clear Statement of Requirement Proper Planning
15.9%
Factors Strongly Related to RE
13.9%
13.0%
% of Responses
9.6%
Realistic Expectation
8.2%
Smaller Project Milestones
7.7%
Competent Staff
7.2%
Ownership Clear Vision and Objectives Hard-working, focused Staff Other
5.3% 2.9% 2.4% 13.9%
So we should have special focus on complexity factors in the first phase of SDLC. These factors could be categorized in two groups: the component of software requirement specification (SRS) that is the output of Requirement Engineering process and human resource that is a subset of the project resource. II. ESTABLISHED COMPLEXITY MEASURES Software complexity is a broad topic in Software Engineering and has attracted many researchers since1976 [5], and many metrics have been proposed to measure software complexity. This metrics is very important in the software management and play a fundamental role in project success. In the following, we are going to investigate some of the most popular complexity metrics. Function point Metric This metric [6] measure the size of software by considering five input parameters like number of user inputs, number of user outputs, number of user inquiries, number of files and number of external interfaces, which will have the value based on their complexities (see Table 2). TABLE 2. Functional Units with Weighting factors
Parameters
Counts
Complexity Medium 4
Number of Inputs
Low 3
High 6
Number of Outputs
4
5
7
Number of Files Number of External Interfaces Number of User Inquiries
3
4
6
5
10
15
7
7
10
Function point can be computed using unadjusted function point, which can be derived from Table 2. However technical complexity factors are the degree of influence of 14 components for “General Application Characteristics” and the scale for degree of influence ranges from zero (not present, or no influence) to five (strong influence throughout). The sum of scores of 14 characteristics that is total degrees of influence (Fi) is converted to technical complexity factor. So the Function Point metric is calculated by using equation (1):
ISSN : 0975-3397
Vol. 3 No. 6 June 2011
2483
Ghazal Keshavarz et al. / International Journal on Computer Science and Engineering (IJCSE)
[
FP = CountTotal × 0.65 + 0.01 × Fi
]
(1)
Halstead Complexity Metric Halstead complexity [7] metrics is established for measuring program complexity with emphasis on computational complexity. Halstead metric, directly measure the complexity from the source code and based on four numeric values as followed: n1: Number of non-repetitive operators n2: Number of non-repetitive operands N1: Number of all operators N2: Number of all operands Further Length and Vocabulary serve as the basis for finding out Volume, Potential Volume, Difficulty and finally effort by using equations (2-7): Length N = N1 + N 2 Vocabulary n = n1 + n2 Volume V = n log n2 PotentialVolume V * = (2 + n2) log (22+ n 2) Difficulty D = V * V Effort E = V D
(2) (3) (4) (5) (6) (7)
One of the difficulties with the Halstead metric is that they are difficult to compute, especially in large programs.
McCabe Cyclomatic Complexity Metric McCabe [8] is another known metric that directly measures the number of linear independent paths within a module and considered as a correct and reliable metric. Lower cyclomatic value help in better understanding of program and changes is done with lower risk too. The metric is calculated by using equation (8): CC = E − N + P
(8)
E is the edges of graph, N is the nodes of graph and P is the non-connected parts of the graph. Another formula for calculating complexity is the following (equation (9)): CC = Number Of Decisions + 1
(9)
It can be computed early in life cycle than of Halstead's metrics but there are some difficulties with the McCabe metric. Although no one would argue that the number of control paths relates to code complexity, some argue that this number is only part of the complexity picture. According to McCabe, a 3,000-line program with five IF/THEN statements is less complex than a 200-line program with six IF/THEN statements and this shows the complexity of uncontrolled statement are ignored. Henry and Kafura's information flow complexity metric Henry and Kafura [9] measure complexity as a function of fan-in and fan-out. They define fan-in of a procedure as the number of local flows into that procedure plus the number of data structures from which that procedure retrieves information. Fan-out is defined as the number of local flows out of that procedure plus the number of data structures that the procedure updates. Local flows relate to data passed to and from procedures that call or are called by, the procedure in question. The formula to calculate it is as equations (10), (11): IFC = (Fan in + Fan out ) 2 Weighted IFC = length × (Fan in + Fan out ) 2
(10) (11)
High levels of information flow indicate the lack of cohesion in the design or obstruction point and these will cause higher complexity.
ISSN : 0975-3397
Vol. 3 No. 6 June 2011
2484
Ghazal Keshavarz et al. / International Journal on Computer Science and Engineering (IJCSE)
It can be derived prior to coding, during the design stage but it can give complexity values of zero if a procedure has no external interactions. KLCID Complexity Metric KLCID [10] defines identifiers as the programmer defined variables and based on identifier density (ID), as equation (12). ID = Total no. Identifiers LOC
(12)
For calculating KLCID, it finds number of unique lines of code, lines that have same type and kind of operands with same arrangements of operators would be consider equal. KLCID is defined as equation (13). This method is very time consuming, because every line of code compare with the remaining lines of program. ID =
No. of identifiers in the set of unique lines No. of unique lines calculating identifier
(13)
Most of the complexity measures given so far are based on code and cognitive metrics, and some of them are based on design phase. So it is better to focus on early stages of the software life cycle, and this is a new approach. In 2010 a requirement based metric [11] have been proposed in order to estimate the complexity. It uses the components of the SRS in measuring. In this article, we improve this metric and propose a more accurate and comprehensive requirement based metric. III. REQUIREMENT BASED METRIC The advantage of this metric is that, it enables a software engineer to measure the complexity before actual design and implementation and choose appropriate strategies that based on the software complexity degree and so improve the quality and productivity. As said before, the proposed metric is based on the component of software requirement specification (that is the output of Requirement Engineering process) and human resource (that is a subset of the project resource). Human resource is considered as stakeholders and project team. Stakeholders are the most important complexity factors, because the requirements extraction process results and their requested and desirable items form the system base. Stakeholders are people with different backgrounds, organizational and personal goals and social situations, and each of them has its own method for understanding and expressing of knowledge and communicates in various ways with other people. So complexity widely depends on the stakeholders, and has the first priority. The Input data to perform the next phases of the software life cycle are documents, which are derived of the requirements analysis phase. All items and stated requirements, causes the complexity and so documents have considered as the second priority. It is necessary to say that this level of the complexity results in inherent complexity of the system. Finally, because of cognitive skills, experimental and various subjective factors, the project team (as a subset of human resources) has considered as another complexity factor and has the third priority. The calculation method for this measure is explained below: Input Output Complexity (IOC) This complexity refers to the input and output of the software system and attached interfaces and files. Following attributes are considered: •
Input: As information entering to the system
•
Output: Information leaving system
•
Interface: User interface where the input are to be issued and output to be seen and specifically number of integration required
•
Files: This refers to the data storage required during transformation
So, Input Output Complexity can be calculated as equation (14): IOC = No. of Input + No of Output + No of Interfaces + No of Files
ISSN : 0975-3397
Vol. 3 No. 6 June 2011
(14)
2485
Ghazal Keshavarz et al. / International Journal on Computer Science and Engineering (IJCSE)
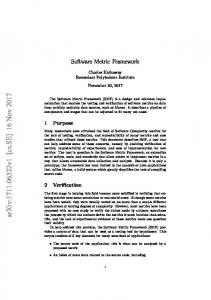
Functional Requirement (FR) Functional requirements should define the fundamental actions that must take place. Generally these are commands that begin with the phrase "system should ..." and should be externally perceivable by users, operators or other external systems. It may be appropriate to partition the functional requirement into sub-functions or sub-processes. Also it is noted that sub-functions may compose of other sub-functions too and it considered in formula. For example, suppose a system has three functions and their functions include two or three sub-functions and each of these have their own sub-functions too (see Figure 1).
Figure 1. Functional Requirements and relative Sub-Functions
On the other hand, some of the systems located in the dynamic and competitive environment or interact with evolving systems. The functional requirements of these systems expose in frequent changes. Repeated maintenance, increased error and low probability of testing the changes are the results of high rate of volatility and these lead to the complexity (see Table 3). So, functional requirement complexity can be calculated as equation (15): level −1 n 3 FR = Coefficient i × Noi × SFk j =1 k =1 i =1
(15)
TABLE 3. Volatility types and its coefficient
Type of Volatility stable
Volatility coefficient 1
rarely
2
often
3
Functional Requirement (NFR) Non-Functional requirement refers to the system qualitative requirements and not fulfilling those leads to customer's dissatisfaction. More number of non-functional requirements and the degree of importance and compulsion to do them leads to more complexity in the product. A way to rank requirements is to distinguish classes of requirements as essential, desirable, and optional. So, functional requirement complexity can be calculated as equation (16):
3 NFR = Coefficien t i × No i i =1
(16)
Noi is the numbers of non-functional requirement with the importance degree of type i and Coefficienti is the importance coefficient of type i (see Table 4). More force to do non-functional requirements may impose higher degree of complexity to the software. TABLE 4. Non Functional requirement types and its coefficient
ISSN : 0975-3397
Importance Degree Optional
Importance coefficient 1
Desirable
2
Essential
3
Vol. 3 No. 6 June 2011
2486
Ghazal Keshavarz et al. / International Journal on Computer Science and Engineering (IJCSE)
Requirement Complexity (RC) This refers to the sum of all requirements i.e. functional and its decomposition into sub-functions and non functional equation (17): RC = FR + NFR
(17)
Product Complexity (PC) This refers to the overall complexity based on its functionality of the system. It is a product of requirement complexity and Input Output Complexity. Also, to calculate the overall characteristics of the product, the Cost Driver Attribute of COCOMO model is used (see Table 5). Product complexity is calculated as equation (18): PC = (IOC × RC ) + Cost Driver Pr oduct Attributes
(18)
TABLE 5. Cost Driver Attributes and their values used in COCOMO Model
Very Low 0.75
Attribute Required Software Reliability Size Of Application Database Complexity of the Product.
Nominal
High
0.88
1.00
1.15
Very High 1.40
0.94
1.00
1.08
1.16
0.85
1.00
1.15
1.30
low
0.70
Design Complexity (DC) This should specify design constraints that can be imposed by other standards, hardware limitations, etc. Some constraints are, Implementation language, database integrity policies, operating environment, size of required resources. All of them limit the developers and add complexity in the system. It can be calculated as equation (19): n
DC = Ci
(19)
i =1
Ci is the numbers of imposed restrictions of type i. Product Representation Complexity (PRC) These items are the number of supported terminals and the number of concurrent users. High number of any of these items represents the high complexity of the system. The formula to calculate it is as equation (20): PRC = No.Syn Users + No. Termal
(20)
Human Resource Complexity (HRC) Human resource plays an important role in developing and improving software so it is considered in two levels: stakeholder complexity and project team complexity. •
Project Team Complexity (TC) Team Complexity includes their skill and experience. Personal skills can be estimated by calculating their personal capability attributes. Cost Driver Attributes from COCOMO (Intermediate) model is used to do it (Table 6). The equation (21) is used to calculate the Personal Complexity Attribute (PCA).
PCA =
5
xi
(21)
i =1
TABLE 6. Cost Driver Attributes and their values used in COCOMO Model
Analyst Capability
Very Low 1.46
Application Exp.
1.29
Attribute
ISSN : 0975-3397
Nominal
High
1.19
1.00
0.86
Very High 0.71
1.13
1.00
0.91
0.82
low
Vol. 3 No. 6 June 2011
2487
Ghazal Keshavarz et al. / International Journal on Computer Science and Engineering (IJCSE)
Attribute Programmer Cap. Virtual Machine Exp. Programming Language Exp
Very Low 1.42
Nominal
High
1.17
1.00
0.90
Very High -
1.21
1.10
1.00
0.90
-
1.14
1.07
1.00
0.95
-
low
Experience of the project members (Exp) is another complexity factor. To calculate it, one factor has been highlighted as being important: has the project member worked on a similar project before, if so how many similar projects has he/she been part of and has project member had experience in the same team before? To have the Project Team experience value, find out everyone experience (according to Table 7) and then get the average of it. TABLE 7. Project Team Complexity
Complexity Coefficient
Experience -Employee have been with company for a long length of time, previous experience in similar projects -New employee, previous experience in similar projects -Employee have been with company for a long length of time, not previous experience in similar projects -New employee, not previous experience in similar projects
1 2 2 3
The Team Complexity is calculated as the equation (22): TC = (Exp + PCA)
•
(22)
Stakeholder Complexity (SC) Stakeholder is one of the important complexity factors and is considered in six levels as shown in Table 8 and is calculated as the sum of stakeholder level complexity as equation (23). TABLE 8. Stakeholder Complexity
Stakeholder level
Complexity=0
Complexity=1
Language
Same
Different
Industry Domain
Same
Different
Business Rules Communication Technology Location of Stakeholders
Same
Different
Same
Different
Same
Different
Number of Stakeholders
Low
High
If the organizations are geographically dispersed and have different business rules, industry domain, communication technology or do not have common language to interact with each other and the project team, all these cases will lead to complexity. Numerous stakeholders and their presence at various locations also add much complexity too. SL is the Stakeholder level according to Table 8.
6 SC = SL i i =1
(23)
Therefore the Human Resource Complexity is calculated according to the equation (24): HRC = (TC + SC ) 2
ISSN : 0975-3397
Vol. 3 No. 6 June 2011
(24)
2488
Ghazal Keshavarz et al. / International Journal on Computer Science and Engineering (IJCSE)
Requirement Based Complexity Metric (RBC) Finally, the Requirement Based Complexity can be obtained by considering all above definitions. It can be mathematically shown as equation (25): RBC = ((PC × HRC ) + DC ) × PRC
(25)
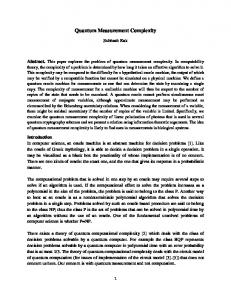
To understand the RBC metric, all above measure have been illustrated in an example. EXAMPLE: Consider a program that find out the area of a triangle. The extracted SRS of this program includes the following parameters: Number of Inputs Number of Outputs Number of Interfaces Number of Files IOC=3+2+1+4 Number of Functional Req. Number of Sub-Functions (Area )
03 01 01 04 09 01 04
Every sub-functions have two subfunctions too.(multiply, divide, plus)
FR = (1× 1) + (4)
No. of Non-FR RC=FR+NFR
4 00 4
no quality attribute
PC=IOC * RC +COCOMO
37.45
TC=1.17+2
3.17
SC
00
DC HRC=TC+SC/2 PRC=1*1 RBC=((PC*HRC)+DC)*PRC
00 1.585 01 59.35
Required Reliability and Software Complexity is very low Suppose programmer capability=Low and he is new employee in company, with previous experience in similar projects one stakeholder in programmer company
Figure 2. Program Code for Calculating the area of a triangle
IV. CONCLUSION AND FUTURE WORK In this article, we propose requirement based complexity. This metric considers all of the complexity factors of the first phase of SDLC. According to the importance of quality and productivity issues in software engineering and close relationship between these issues and complexity, it can be said that this metric is helpful in early identification and estimation
ISSN : 0975-3397
Vol. 3 No. 6 June 2011
2489
Ghazal Keshavarz et al. / International Journal on Computer Science and Engineering (IJCSE)
software complexity and results in saving on cost and human resource wastage, more importantly, leading to lower maintenance costs. In future activities, we are going to find a relationship between the proposed metric and required effort to do the software project and also provide a complexity model too. REFERENCES [1] [2] [3]
Adam West, "Nasa Study on Flight Software Complexity", Final report, May 2009 Zuse, H., "software Complexity-measures and methods. Berlin: Walter de Gruyter", Berlin: Walter de Gruyter & Co, 1991 Eberlein A., Requirements Acquisition and Specification for Telecommunication Services, PhD Thesis, University of Wales, Swansea, UK, 1997 [4] The Chaos Report (1995) the Standish Group International,http://www.standishgroup.com/sample_research/index.php [5] W. P. Stevens, G. J. Myers, and L. L. Constantine, "Structural Design", IBM Systems Journal, vol. 13, no. 2, Jun. 1976, pp. 113129 [6] Albrecht, A. J. and J. E. Gaffney. Jr. “Software Function, Source Lines of Code, And Development Effort Prediction: A Software Science Validation”, IEEE Trans. Software Eng. SE-9, 6, Nov. 1983, pp. 639-648. [7] Halstead M., "Element of Software Science", Amsterdam: Elsevier, 1977 [8] Thomas J.McCabe, "A Complexity Measure", IEEE Transactions On Software Engineering,1976, pages: 308-320 [9] Henry, S., Kafura, K.: Software structure metrics based on information flow. IEEE, Transactions on Software Engineering, 1982, pages: 510–518 [10] Kushwaha, D.S. and Misra, A.K., Improved Cognitive Information Complexity Measure: A metric that establishes program comprehension effort, ACM SIGSOFT Software Engineering, Volume 31 Number 5, September 2006 [11] Ashish Sharma, D.S. Kushwaha, "A Complexity measure based on Requirement Engineering Document", journal of computer science and engineering, volume 1, issue 1, may 2010
AUTHORS PROFILE Ghazal Keshavarz received her BA. Degree in Computer Engineering from Shiraz Technical University, Shiraz, Iran in the year 2006. Currently she is pursuing M.Sc. in Computer Engineering from Islamic Azad University (Science and Research branch), Tehran, Iran under the guidance of Dr Modiri. She is presently working on Requirement Based Complexity metric and Software Quality and Complexity Model. Dr. Nasser Modiri received his M.Sc and PhD in Electronics engineering from the University of Southampton (UK) and the University of Sussex (UK). Assistant Professor of Department of Computer Engineering in Islamic Azad University (Zanjan/Iran). Dr. Mirmohsen Pedram, Assistant Professor of Department of Computer Engineering in Tarbiat Moallem University (Karaj/Iran).
ISSN : 0975-3397
Vol. 3 No. 6 June 2011
2490