Accepted Manuscript Metrics for optimising the multi-dimensional value of resources recovered from waste in a circular economy: A critical review Eleni Iacovidou, Costas A. Velis, Phil Purnell, Oliver Zwirner, Andrew Brown, John Hahladakis, Joel Millward-Hopkins, Paul T. Williams PII:
S0959-6526(17)31542-1
DOI:
10.1016/j.jclepro.2017.07.100
Reference:
JCLP 10103
To appear in:
Journal of Cleaner Production
Received Date: 6 December 2016 Revised Date:
11 July 2017
Accepted Date: 13 July 2017
Please cite this article as: Iacovidou E, Velis CA, Purnell P, Zwirner O, Brown A, Hahladakis J, MillwardHopkins J, Williams PT, Metrics for optimising the multi-dimensional value of resources recovered from waste in a circular economy: A critical review, Journal of Cleaner Production (2017), doi: 10.1016/ j.jclepro.2017.07.100. This is a PDF file of an unedited manuscript that has been accepted for publication. As a service to our customers we are providing this early version of the manuscript. The manuscript will undergo copyediting, typesetting, and review of the resulting proof before it is published in its final form. Please note that during the production process errors may be discovered which could affect the content, and all legal disclaimers that apply to the journal pertain.
SC
RI PT
ACCEPTED MANUSCRIPT
Economic metrics
M AN U
Environmental metrics
AC C
EP
Social metrics
TE D
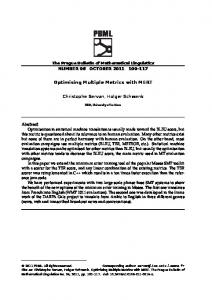
Complex Value Optimisation for Resource Recovery (CVORR)
Technical metrics
ACCEPTED MANUSCRIPT Metrics for optimising the multi-dimensional value of resources recovered from waste in a
2
circular economy: A critical review
3
Eleni Iacovidoua, Costas A. Velisa*, Phil Purnella, Oliver Zwirnerb, Andrew Brownb, John
4
Hahladakisa, Joel Millward-Hopkinsa Paul T. Williamsc
5
a
School of Civil Engineering, University of Leeds, Leeds LS2 9JT, UK.
6
b
Economics Division, Leeds University Business School, University of Leeds, Leeds LS2 9JT, UK.
7
c
School of Chemical and Process Engineering, University of Leeds, Leeds LS2 9JT, UK.
8
*
RI PT
1
Corresponding Author: Costas Velis,
[email protected], telephone: +44(0)07906684410
SC
9
Abstract
11
Established assessment methods focusing on resource recovery from waste within a circular economy
12
context consider few or even a single domain/s of value, i.e. environmental, economic, social and
13
technical domains. This partial approach often delivers misleading messages for policy and decision-
14
makers. It fails to accurately represent systems complexity, and obscures impacts, trade-offs and
15
problem shifting that resource recovery processes or systems intended to promote circular economy
16
may cause. Here, we challenge such partial approaches by critically reviewing the existing suite of
17
environmental, economic, social and technical metrics that have been regularly observed and used in
18
waste management and resource recovery systems’ assessment studies, upstream and downstream of
19
the point where waste is generated. We assess the potential of those metrics to evaluate ‘complex
20
value’ of materials, components and products, i.e., the holistic sum of their environmental, economic,
21
social and technical benefits and impacts across the system. Findings suggest that the way resource
22
recovery systems are assessed and evaluated require simplicity, yet must retain a suitable minimum
23
level of detail across all domains of value, which is pivotal for enabling sound decision-making
24
processes. Criteria for defining a suitable set of metrics for assessing resource recovery from waste
25
require them to be simple, transparent and easy to measure, and be both system- and stakeholder-
26
specific. Future developments must focus on providing a framework for the selection of metrics that
27
accurately describe (or at least reliably proxy for) benefits and impacts across all domains of value,
28
enabling effective and transparent analysis of resource recovery form waste in circular economy
29
systems.
AC C
EP
TE D
M AN U
10
30 31
Keywords: metrics; circular economy; material flow analysis; resource recovery; sustainability
32
assessment; solid waste management; sustainability indicators; multi-dimensional value
1
ACCEPTED MANUSCRIPT 33 Abbreviations Table Avoided carbon emissions
AIChE
American Institute of Chemical Engineers
AP
Acidification potential
ATP
Aquatic toxicity potential
BAT
Best available technology
BC
Black carbon emissions
BCe
Biogenic carbon emissions
BoL
Beginning of life
CBA
Cost-benefit analysis
CBO
Community-based organisation
CCS
Carbon capture and sequestration
CEA
Cost-effectiveness analysis
CED
Cumulative energy demand
CFC
Chlorofluorocarbon
CHP
Combined heat and power
CRMs
Critical raw materials
DC
Direct carbon emissions
DECC
Department of Energy and Climate Change (UK)
EC
Embodied carbon
Eeff
Energy efficiency
EE-IOA
Environmentally extended Input-Output Analysis
EEA
European Environment Agency
EF
Ecological footprint
EIA
SC
M AN U
TE D
Energy from waste Environmental impact assessment
Environmental investment ratio
AC C
EIR
EP
EfW
RI PT
AC
EIRI
Environmental impact recoverability indicator
ELR
Environmental load ratio
EMC
Environmentally weighted material consumption
EOCs
Emerging organic contaminants
EoL
End of life
EoU
End of use
EpE
Entreprises pour l' environnement
ERA
Environmental risk assessment
ERI
Energy recovery indicator
ESG
Environmental, social, and governance
2
ACCEPTED MANUSCRIPT Environmental sustainability index
EuP
Eutrophication potential
EUROSTAT
Statistical office of the European Union
EYR
Environmental yield ratio
GER
Gross energy requirements
GHG(es)
Greenhouse gas(es)
GIS
Geographical information systems
GRI
Global Reporting Initiative
GWP
Global warming potential
HCFC
Hydrochlorofluorocarbon
HFC
Hydrofluorocarbon
HTP
Human toxicity potential
IAEA
International Atomic Energy Agency
IChemE
Institution of Chemical Engineers
IEA
International Energy Agency
IOA
Input-output analysis
IRS
Informal recycling sector
ISWM
Integrated sustainable waste management
LCA
Life cycle assessment
LCC
Life cycle costing
LCSA
Life cycle sustainability assessment
LEE
Life cycle embodied energy
LHV
Lower heating value
LPG
Liquefied petroleum gas
LULUs
Locally unwanted land uses
MCDA
Multi-criteria decision analysis
MCDM
Multi-criteria decision making
MFA
SC
M AN U
TE D
EP
MCPs
RI PT
ESI
Materials, components and products Material flow analysis
Material input per service unit
MRF
Material recovery facility
MSW
Municipal solid waste
NIMBY
Not in my back yard
NIR
Near infrared
NPV
Net present value
ODP
Ozone depletion potential
OEF
Organisation Environmental Footprint
PAHs
Polycyclic aromatic hydrocarbons
PEC
Primary energy consumption
AC C
MIPS
3
ACCEPTED MANUSCRIPT Perfluorocarbons
PM
Particulate matter
POF
Photochemical ozone formation
POFP
Photochemical ozone formation potential
POPs
Persistent organic pollutants
PTEs
Potentially toxic elements
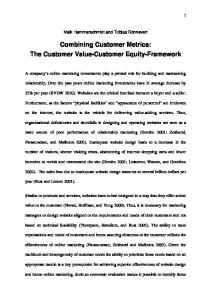
RCE
Resource conservation efficiency
RRfW
Resource recovery from waste
SEA
Strategic environmental assessment
SF6
Sulphur hexafluoride
SFA
Substance flow analysis
SI
Sustainability index
sLCA
Social life cycle assessment
SRF
Solid recovered fuels
SWM
Solid waste management
TBL
Triple bottom line
TRI
Technical recovery indicator
UNCED
United Nations Conference on Environment and Development
UNDESA
United Nations Department of Economic and Social Affairs
UNEP
United Nations Environment Programme
VOCs
Volatile organic compounds
WBCSD
World Business Council for Sustainable Development
WRI
World resources institute
wsx
MSW management self-sufficiency indicator
wt
weight
TE D
M AN U
SC
RI PT
PFCs
EP
35
Product environmental footprint
AC C
34
PEF
4
ACCEPTED MANUSCRIPT 36
1 Introduction Current initiatives promoting a ‘circular economy’ build upon the preceding research into resource
38
efficiency (Ashby, 2016; Butterworth and Bleriot, 2014; EC, 2015; Ghisellini et al., 2016; Gregson et
39
al., 2015; Haas et al., 2015; Murray et al., 2015), and provide an imperative to reconsider our
40
approach to resource recovery from waste (RRfW). This should aim to resolve RRfW system
41
inefficiencies, and transform waste management practices into systems that ‘manufacture’ secondary
42
resources of high value. There is a need both to remove structural barriers within the industry and
43
reform existing policy and legislation, in order to empower interventions that transform currently
44
unsustainable practices (Gregson et al., 2015; Silva et al., 2016; UNEP and ISWA, 2015).
45
Transformation requires a shift in thinking such that RRfW is conceptualised and operationalised on
46
the basis of preserving the value of materials, components and products (MCPs) by retaining their
47
functionality for as long as possible, as underpinned by the rationale of a circular economy (Ellen
48
MacArthur Foundation, 2012; Ghisellini et al., 2016).
M AN U
SC
RI PT
37
Ideally, this concentrates on the direct reuse of products and components; but often the degree to
50
which this can be achieved is limited owing to aging, design, performance (including environmental
51
and resource efficiency performance), or recovery constraints. In such cases, repair, reconditioning,
52
remanufacturing, recycling (closed- and open-loop recycling) or energy recovery from MCPs are
53
considered to be the next best option for recovering the value embedded in and/or associated with
54
them (Benton and Hazell, 2013; Huysman et al., 2015; Thormark, 2000). The established EU
55
guidance for recovering resources from waste mandates – via the “waste hierarchy” of the Waste
56
Framework Directive (European Union, 2008) – that in principle reuse is better for the environment
57
than materials recycling, recycling is better than energy recovery, and energy recovery is better than
58
disposal. In reality, efficient and environmentally sound recovery of value from waste is far more
59
complex than just following a ranked description of generically preferred management options.
60
Hence, the option to modify the waste hierarchy, e.g. by taking a case-by-case life cycle assessment
61
(LCA), is endorsed in the Waste Framework Directive (European Union, 2008). However, even these
62
slightly more sophisticated options have little to say about the prevention of dissipation of value into
63
waste; the transition to a resource efficient circular economy requires approaches that allow a more
64
holistic analysis and evaluation of value creation, appropriation and dissipation within the systems in
65
question.
AC C
EP
TE D
49
66
The term ‘value’ herein has a wide meaning, referring to measurable benefits (creation of positive
67
value) and impacts (creation of negative value or loss of value) in the environmental, economic, social
68
and technical domains (Iacovidou et al., under review). Considering all these domains – and
69
potentially more e.g. governance – in the evaluation of interventions, allows for holistic analysis of
70
options needed to make them work towards the overarching objective of sustainable development, as 5
ACCEPTED MANUSCRIPT required by the “Agenda 21” (UNCED, 1992 ). Nested within these four generic domains of value are
72
multiple specific dimensions of value that are associated with the production, use, recovery and
73
disposal of MCPs, from their beginning of life (BoL) towards their end-of-use (EoU) and end-of-life
74
(EoL) stage, and subsequent redistribution (circulation, looping, cascading) back into the
75
anthropogenic systems or disposal into the biosphere (final sinks). At present, established assessments
76
focusing on the recovery of value from waste are based on dimensions of value from few – in fact
77
typically, a single – domain/s of value; for example, the waste hierarchy or LCA are preoccupied only
78
with dimensions of value from the environmental domain. This partial approach often delivers
79
misleading messages for policy and decision-makers, failing to cut through the systemic complexity,
80
poorly accounting for undesirable effects in other sectors and/or domains of value, and obscuring as
81
such impacts, trade-offs and problem shifting that some RRfW processes or systems may cause
82
(Lyytimäki et al., 2013; Ulgiati et al., 2011). In addition, this partial approach might hinder the
83
exploitation of hidden beneficial synergies along the supply chain.
SC
RI PT
71
To elaborate, studies have shown that 46% (weight, (wt.)) of the post-consumer plastic waste
85
collected for recycling in the EU is exported, the bulk of it to the Far East (Velis, 2014, 2015), where
86
in the near past it may have been reprocessed in facilities with deficient environmental protection, by
87
poorly-paid workers in unhealthy conditions (Puckett et al., 2002); a hidden social and health impact.
88
Other studies have shown that co-firing biomass and/or partly biogenic solid recovered fuels (SRF)
89
with coal in power plants, while beneficial in reducing the use of fossil fuels and mitigating climate
90
change, may influence the operation and performance of the boilers used, increase trace element
91
emissions, and render certain by-products (e.g. pulverised fly ash) chemically unsuitable for
92
previously established applications (e.g. concrete manufacture); all leading to unassessed hidden
93
technical, economic and environmental impacts (Iacovidou et al., 2017a). A meaningful way of
94
measuring the multiple dimensions of value embedded in and associated with all the MCPs in a
95
system, would allow investigators to concurrently analyse and weigh up all these factors.
EP
TE D
M AN U
84
In such holistic evaluations, the selection of appropriate metrics (quantitative or semi quantitative
97
descriptors) (Tanzil and Beloff, 2006) that accurately describe (or at least reliably proxy for) benefits
98
and impacts, is critical. Simple ways of measuring value can facilitate a transparent assessment
99
process, and allow for comparisons between various options for recovering resources from waste
100
under different scenarios to be made. Meanwhile, a balance between simplification in measurement
101
and comprehensiveness in addressing systemic complexity has to be reached. As such, the metrics
102
selected for optimising the value of recovered MCPs should be useful and informative, but at the same
103
time simple, transparent and measurable based on characteristics common to all processes, MCPs and
104
services (Allegrini et al., 2015; Atlee and Kirchain, 2006; Ingwersen et al., 2014; Schmidt-Bleek,
105
2008), and amenable to evaluation. Prior to selecting metrics, consideration of the suite of metrics that
AC C
96
6
ACCEPTED MANUSCRIPT 106
currently exist and of the way these can be used in ensuring an effective and transparent analysis of
107
entire systems, while retaining simplicity and comprehensiveness, is a gap that needs to be addressed
108
in order to facilitate sound decision-making processes. Therefore, this paper aims to address this gap by providing a critical review of the existing metrics
110
suggested and used by the literature on RRfW and sustainable resource management for measuring
111
the benefits and impacts in environmental, economic, social and technical dimensions of value
112
associated with MCPs lifecycle management. A methodology as to how this literature was processed
113
is presented in Section 2, where we provide an overview of the evolution of metrics used in
114
supporting decision-making in this field with particular reference to MCPs production, consumption
115
and management, and of how we examined all the methods and tools and the metrics used therein in
116
order to aid evaluation and optimisation of the RRfW systems. Also in Section 2, we explain the
117
importance of mass balance analysis in enabling a comprehensive appraisal of the system under
118
examination, the problem that is to be solved, and as a consequence of the importance of assigning
119
metrics to mass flows and stocks. In Section 3 we outline the metrics that have been widely used for
120
evaluating environmental aspects associated with the use of MCPs and their recovery from waste.
121
Given the relatively large number of environmental metrics that have been developed over the past
122
decades, it was considered prudent that these were distinguished by the scope they aim to serve,
123
including amongst others, carbon emissions, pollutant emissions, energy and non-energy related
124
categories. The metrics used for evaluating economic, social and technical aspects are presented in
125
Sections 4, 5 and 6, respectively. These existing metrics and their ability to support systems analysis
126
and decision-making for promoting the complex value recovery from resources/wastes and its
127
optimisation, are then discussed in Section 7. Section 8 presents the final conclusions.
128 129
2 Methodology
EP
TE D
M AN U
SC
RI PT
109
Metrics can be established as standalone items or defined within frameworks, methods, complex
131
tools and composite metrics. To identify the metrics that are regularly observed and used in waste
132
management and resource recovery systems’ assessment studies a considerable array of publications
133
from peer reviewed journals and other sources (mainly from industry and public sector guidance) that
134
catered mainly to the assessment and evaluation of RRfW systems and the evolution of these
135
frameworks, methods and tools over the years were identified and selected for analysis. These
136
publications included an important number of decision-support frameworks that differed widely
137
depending on their:
138 139 140
AC C
130
•
Scope: whether they are aimed at the optimisation of a given waste management system, such as an energy from waste (EfW) plant, or at comparing different alternatives (e.g. EfW vs. materials recycling); 7
ACCEPTED MANUSCRIPT •
Scale: whether they define their system boundaries at a single unit operation (e.g. a near infrared (NIR) technology), or an entire plant (e.g. a material recovery facility), or waste management system at a wider geographic unit (e.g. local, regional or national level);
144 145 146 147
•
Focus: whether they are focused on traditional solid waste management (SWM) (Björklund et al., 1999; Clift et al., 2000; Finnveden, 1999; Powell, 2000); integrated sustainable waste management (ISWM) (Ness et al., 2007; Seadon, 2010; Wilson et al., 2015); or the so called ‘zero waste’ management (Zaman, 2014); and,
148 149
•
Specific method or tool: whether they are referring to the practical choices in translating the framework into an operational act of measurement.
150
Review and analysis of the above frameworks, reported and/or used in both theoretical and
151
empirical literature, revealed that the metrics used or proposed for the assessment and evaluation
152
procedures were often repeated in the different decision-making frameworks, or were very similar,
153
pointing to their potential usefulness. The metrics selected in this paper ideally met three generic
154
criteria as follows:
SC
RI PT
141 142 143
(1) Had the potential to provide evidence for, or to support, evaluate and optimise RRfW systems;
157 158 159 160
(2) Were relevant for the environmental, economic, social and technical evaluation of RRfW processes and systems, with specific reference to MCPs production, consumption and EoL management; (3) Had the potential to be measurable (quantitatively or qualitatively).
161
Metrics that fulfilled these criteria were included in the analysis. Many of these metrics emerged
162
from environmental analysis techniques such as LCA; whereas others derived from studies in
163
economics, engineering and social science (Chong et al., 2016; Ingwersen et al., 2014; Morrissey and
164
Browne, 2004; Ness et al., 2007; Pires et al., 2011; Zurbrügg et al., 2014). Here, we focused at the
165
more complex analytical and decision support frameworks that contained metrics mainly associated
166
with resource production, consumption and EoL management. A comprehensive review of such
167
complex entities in terms of their analytical, evaluation or decision support power was not intended
168
for this study and can be found elsewhere – indicatively at Ness et al. (2007), Allesch and Brunner
169
(2014), Morrissey and Browne (2004), Zurbrügg et al. (2014), and Pires et al. (2011).
171 172
TE D
EP
AC C
170
M AN U
155 156
2.1 Development and use of metrics in emerged and emerging decision-support frameworks, methods and tools for SWM and/or RRfW evaluation
173
Frameworks, methods and tools commonly used to support decision makers when evaluating
174
SWM and/or RRfW processes and systems include, amongst others, the LCA, cost-benefit analysis
175
(CBA) (Begum et al., 2006; Clift et al., 2000; da Cruz et al., 2014; Djukic et al., 2016; Varouchakis et
176
al., 2016; Wang et al., 2016), lifecycle costing (LCC) (Gluch and Baumann, 2004; Woodward, 1997),
177
social life cycle assessment (sLCA) (Dreyer et al., 2006; Guinée et al., 2011), input-output analysis
178
(IOA), environmentally extended IOA (EE-IOA), strategic environmental assessment (SEA), 8
ACCEPTED MANUSCRIPT 179
environmental impact assessment (EIA), environmental risk assessment (ERA), multi-criteria decision
180
making (MCDM), cost-effectiveness analysis (CEA) (Allesch and Brunner, 2014; Gasparatos et al.,
181
2009a, b; Morrissey and Browne, 2004; Ness et al., 2007; Singh et al., 2012; Wilson et al., 2015); and
182
purpose-built optimisation models. Whereas many approaches customarily include an optimisation stage, a distinct category of
184
optimisation tools stand for the mathematical modelling techniques originally developed to deal with
185
the cost-effectiveness of municipal solid waste (MSW) collection, treatment and disposal
186
infrastructure and operation. These models focused on technical application aspects: for example, on
187
the vehicle routing network used for collection and transportation of MSW (Nuortio et al., 2006;
188
Sonesson, 2000; Tavares et al., 2009; Truitt et al., 1969); on the selection of the type, size and
189
location of waste facilities; and on the distribution of waste streams (municipal, commercial, etc.) to
190
the treatment facilities within a specific geographical region (Badran and El-Haggar, 2006; Chang and
191
Davila, 2007; Esmaili, 1972; Wilson, 1977). The strength of these optimisation models is that they
192
can optimise aspects of technical performance against minimising the overall system cost, taking, for
193
instance, into account transportation costs to transfer stations, landfills, incinerators, composting
194
facilities, material recovery facilities, and the operational and fixed costs of these facilities (Chang
195
and Davila, 2007; Wilson, 1977).
M AN U
SC
RI PT
183
Such optimisation approaches, however, may not account for other important considerations. For
197
example, disposal in sanitary landfills may be the preferred waste management option regarding
198
minimisation of hazards, but may also result in high environmental impacts, and might conflict with
199
adopted policies (Najm et al., 2002). Subsequently, as environmental and socioeconomic concerns
200
around SWM and the need to promote RRfW have gained importance, new assessment frameworks
201
were developed, capable of including environmental and socioeconomic metrics into the decision
202
making of SWM systems (e.g. waste recycling, facilities siting, and system operation), promoting a
203
more sustainable management of waste (Chang and Davila, 2007; Pires et al., 2011). For instance,
204
Fuertes et al. (1974) adapted an optimisation model to take into account the trade-offs between system
205
costs and social aspects, such as aesthetics, size and number of regional facilities (Fuertes et al.,
206
1974). In a number of other studies (Chalkias and Lasaridi, 2009; Chang et al., 2008), geographical
207
information systems (GIS) modelling was used in conjunction with environmental, biophysical,
208
ecological, and socioeconomic variables to provide an advanced modelling framework for decision
209
makers to simulate and analyse spatial waste management challenges. In other works, linear
210
programming was integrated with a lifecycle perspective to assess economic, environmental and other
211
associated impacts (e.g. solid waste generation rate, solid waste composition and characteristics, time
212
and transport distance, generation sources, capacity) (Chalkias and Lasaridi, 2009; Ekvall et al., 2007;
213
Eriksson et al., 2003; Najm et al., 2002; Sudhir et al., 1996), all of which are important in long-term
AC C
EP
TE D
196
9
ACCEPTED MANUSCRIPT 214
planning, and suitable in providing a realistic representation of solid waste management practices
215
(Kondili, 2005; Morrissey and Browne, 2004; Najm et al., 2002; Pires et al., 2011). Because it is now well established that sustainable waste management requires a comprehensive
217
analytical approach, combinations of assessment methods and tools that combine metrics from
218
different domains of value are also increasingly endeavoured (Chong et al., 2016; Finnveden et al.,
219
2005). For example, amalgamations of environmental with technical (eco-design) (Knight and
220
Jenkins, 2009) or economic aspects (eco-efficiency analysis, optimisation models), and of methods
221
such as LCC with LCA (Carlsson Reich, 2005; Gu et al., 2008; Heijungs et al., 2012; Norris, 2001;
222
Ristimäki et al., 2013) or IOA with LCA (Joshi, 1999; Junnila, 2008; Ochoa et al., 2002) have gained
223
recognition. Even the development of new methods that incorporate metrics previously coined for use
224
in LCA, LCC and sLCA, such as the newly developed life cycle sustainability assessment (LCSA)
225
have emerged (Chong et al., 2016; Finkbeiner et al., 2010; Gencturk et al., 2016; Giannakis and
226
Papadopoulos, 2016; Guinée et al., 2011; Klöpffer, 2003).
M AN U
SC
RI PT
216
A method used to assess the sustainability of organisations is the accounting framework called the
228
triple bottom line (TBL), which goes beyond the traditional measures of organisations used to assess
229
their profits to also include environmental and social elements (Dao et al., 2011; Elkington, 2004;
230
Saavalainen et al., 2015; Slaper and Hall, 2011). However, no universal standard method, or an
231
accepted standard for the metrics that comprise each of the three TBL categories currently exists,
232
while the metrics included are difficult to measure (Slaper and Hall, 2011). As such, this method is
233
not considered further herein. A number of sustainability assessment methods that evaluate the
234
performance of industrial facilities have been developed by the World Business Council for
235
Sustainable Development (WBCSD, 2000), the Global Reporting Initiative (GRI, 2013), the
236
American Institute of Chemical Engineers (AIChE) and the Institution of Chemical Engineers
237
(IChemE) (IChemE, 2001). These approaches provide the metrics organizations need to use to
238
measure and report their economic, environmental, and social performance (Saavalainen et al., 2015).
EP
TE D
227
More explicitly, GRI has developed an environmental, social, and governance (ESG) reporting
240
framework used by many industries worldwide (GRI, 2013; Saavalainen et al., 2015), whereas
241
WBCSD have developed the eco-efficiency indicators successfully used in many studies (WBCSD,
242
2000). The AIChE has developed the Sustainability index (SI) to measure the sustainability
243
performance of representative companies in the chemical industry, using seven (7) key metrics
244
including: environmental performance (that measure the ‘greenness’ of the companies through
245
assessing material intensity, energy intensity, water consumption, toxics release, and pollutant effects
246
(Saavalainen et al., 2015; Tanzil and Beloff, 2006), product stewardship, sustainability innovation,
247
value chain management, social responsibility, safety performance and strategic commitment
248
(Saavalainen et al., 2015). Similarly, in the IChemE methodology the Sustainable Development
AC C
239
10
ACCEPTED MANUSCRIPT 249
Progress Metrics (environmental, economic, and social) have been fashioned to measure the
250
sustainability of operations within the process industry for enhancing their sustainability performance
251
(IChemE, 2001; Labuschagne et al., 2005; Saavalainen et al., 2015). The strength of the above methods and tools in supporting decision-making in complex,
253
interdependent systems, such as RRfW, lies on their ability to adopt a whole system approach that
254
reflects their complexity (Blengini et al., 2012; Turner et al., 2016). To handle the increased
255
complexity of RRfW systems, Turner, Williams and Kemp (2016) proposed to combine assessment
256
methods and tools with the material flow analysis (MFA). In these combinations, MFA provides
257
valuable information about the flows and transformations of MCPs as they move through the
258
economy at different system levels (e.g. regional, national or economy-wide systems) (Brunner and
259
Rechberger, 2004; Hotta and Visvanathan, 2014), while the assessment methods and tools provide the
260
valuable information on the performance of the RRfW systems via the use of metrics. The
261
combination of MFA, with metrics for ‘value’ analysis and assessment tools, can help in evaluating
262
existing RRfW processes, and most importantly support stakeholders in identifying optimal future
263
RRfW strategies. Details about the use of MFA are outlined in the following section.
M AN U
SC
RI PT
252
264
2.2 The importance of MFA in systemic analysis
266
Material flow analysis is a tool that has been widely used for analysing the flows and stocks of
267
economic entities (‘goods’). It looks specifically into the flows in and out of a system (Ness et al.,
268
2007), and provides an insight into the fate of ‘goods’ (in the form of MCPs and residues) from their
269
BoL towards their EoU and EoL stage, and the subsequent management and treatment as presented in
270
Figure 1. MFA is often represented in the form of detailed flow diagrams that invokes the mass
271
balance principle, in line with the law of conservation of matter, to get an integrated view of resource
272
flows, comparing all inputs, outputs, stock growth or sinks, and hidden flows (e.g. mining overburden,
273
harvest losses, waste generated upstream).
EP
AC C
274
TE D
265
11
RI PT
ACCEPTED MANUSCRIPT
275
Figure 1 Simplified RRfW system representation. Releases to biosphere (air, water, soil) at all stages
277
of supply chain are for sake of simplicity not included in the figure.
SC
276
M AN U
278
In contrast to MFA, substance flow analysis (SFA) is widely used for analysing the substances that
280
flow in a system; where substances are defined as uniform entities consisting of uniform units (e.g. (i)
281
chemical elements (atoms) or (ii) chemical compounds (molecules) (Brunner and Rechberger, 2004;
282
Stanisavljevic and Brunner, 2014). SFA provides an essential insight into the characteristics of MCPs,
283
with a focus on their hazardousness, technical performance, lifecycle transformation and exchanges
284
with the environment. MFA and SFA are linked by the fact that SFA can be defined as a detailed level
285
application of the basic MFA concept tracing the flow of selected chemical substances or compounds
286
- e.g. potentially toxic elements (PTEs) (e.g. mercury, lead, chromium, arsenic, etc.), nitrogen and
287
phosphorous – that are contained in the goods analysed by MFA (Stanisavljevic and Brunner, 2014).
288
This said, SFA can be extremely useful at various levels of the RRfW system (Antikainen et al., 2005;
289
Asmala and Saikku, 2010; Ness et al., 2007), offering important metrics that can describe technical
290
dimension of value. This level of information, essential for the optimal recovery of resources at their
291
EoU and EoL stage, can be used as the backbone onto which to ‘attach’ the multi-dimensional values.
292
In addition, there is inherently a certain degree of uncertainty in the data used to calculate the metrics.
293
This will be explicitly and transparently tackled, inter alia carried through as metadata.
AC C
EP
TE D
279
294
The following sections provide a critical analysis of the usefulness, robustness and strength of
295
environmental, economic, social and technical metrics discussed in the literature for SWM and/or
296
RRfW assessments that fall under the four domains of value.
297
12
ACCEPTED MANUSCRIPT 298
3 Environmental metrics Understanding the environmental benefits and impacts of all processes, including those associated
300
with RRfW, is important for ensuring the protection of human health and ecosystems. LCA is the best
301
known and commonly used tool for assessing the environmental impacts of a product’s life from raw
302
material extraction to EoU, disposal and EoL management, making capable and useful comparisons
303
between products, processes and systems (Allegrini et al., 2015; Finnveden et al., 2009; Guinée et al.,
304
2011; Hellweg and Milà i Canals, 2014; Laurent et al., 2014; Parkes et al., 2015; Rigamonti et al.,
305
2013a; Rigamonti et al., 2013b). In essence, LCA creates a model of the flow of materials and/or
306
products through processes in a system and examines the environmental impact of each one of the
307
processes and how they should be allocated to products and co-products. LCA is indeed similar to
308
MFA, but in practice often simplified especially with respect to system boundaries and the functional
309
complexity of many processes in the RRfW systems and sub-systems (Turner et al., 2016). The wide
310
and versatile nature of LCA in capturing the environmental benefits and impacts of RRfW systems is
311
exemplified in its use to:
M AN U
SC
RI PT
299
•
assess the environmental and energetic performance of waste management systems (Al-Salem et al., 2009; Antonopoulos et al., 2012; Arena et al., 2003; Blengini et al., 2012; Bovea et al., 2010; Buttol et al., 2007; Eriksson et al., 2005; Finnveden et al., 2005; Giugliano et al., 2011; Kirkeby et al., 2006; Rigamonti et al., 2013a; Rigamonti et al., 2013b);
316 317 318
•
assess the environmental and energetic performance of industrial processes (Azapagic and Clift, 1999; Brentner et al., 2011; Burgess and Brennan, 2001; Jacquemin et al., 2012; Sonnemann et al., 2003; World Steel Association, 2010);
319 320 321 322
•
compare different waste management processes and/or energy recovery strategies (Abduli et al., 2010; Astrup et al., 2009; Blengini, 2008a; Blengini, 2008b; Bovea and Powell, 2006; Cherubini et al., 2009; Chong et al., 2016; Christensen et al., 2009; den Boer et al., 2007; Eriksson et al., 2005; Finnveden et al., 2005); and
323 324
•
evaluate component and product performance used in different applications (Azapagic, 1999; Joshi, 1999; Junnila, 2008).
EP
TE D
312 313 314 315
LCA classifies environmental impacts into a number of impact categories (effectively, in our
326
terminology, dimensions of value from the environmental domain) of which number varies depending
327
on the LCA methodology framework used (Stranddorf et al., 2005). Amongst the different
328
frameworks, the impact categories that are most widely used, and for which there is international
329
consensus, include global warming; stratospheric ozone depletion; acidification; terrestrial
330
eutrophication; aquatic eutrophication; photochemical ozone formation; human toxicity; ecotoxicity;
331
and resource depletion (Acero et al., 2015). The first one is the topic of sub-section 3.1 while the
332
others are presented and discussed in sub-sections 3.2, 3.3 and 3.4. All these metrics are aggregates
333
composed of more specific ones, e.g. the acidification metric aggregates metrics on the emissions of
334
various substances with an acidifying property.
AC C
325
13
ACCEPTED MANUSCRIPT Furthermore, metrics can be distinguished between direct and indirect metrics based on the way
336
they are measured. Direct metrics refer to the on-site and/or internal measurements that occur during a
337
specific process whether this is the production, use, collection and management of a functional unit
338
(i.e. a material, component or product); whereas indirect metrics refer to the off-site, external,
339
upstream or downstream measurements that are not physically related to the functional unit, but are
340
associated with it (Lee, 2011; Peters, 2010; Wiedmann and Minx, 2008; WRI/WBCSD, 2011). LCA
341
methods aim to account for both direct and indirect environmental impacts, and this is especially
342
prevalent in the case of emissions and resource consumption (Zhang et al., 2010). There is no
343
established term to label the sum of direct and indirect emissions/resource consumption. The term
344
“total” should be avoided as full completeness is impossible to achieve. Most of the metrics used in
345
LCA have also been used in other assessment methodologies or as sustainability indicators,
346
demonstrating further their usefulness, robustness and informative character. Other metrics, widely
347
used in a number of assessment methodologies including GRI, WBCSD eco-efficiency analysis, green
348
design, eco-design, and sustainability assessment methodologies include, amongst others, the recycled
349
content or renewability feedstock, energy efficiency, landfill use, which are presented in Section 3.5
350
(GRI, 2013; UNEP and SETAC, 2011; WBCSD, 2000; Zurbrügg et al., 2014).
M AN U
SC
RI PT
335
Section 3 is organised as follows: the first 4 sub-sections look at environmental metrics from a
352
thematic perspective (carbon, pollution, resources); sub-section 3.5 looks transversal at all those
353
environmental dimensions from an efficiency perspective, while 3.6 presents metrics that integrate
354
several dimensions of environmental benefits and impacts.
355
TE D
351
3.1 Carbon emission metrics
357
Perhaps the most widely known and used metric in environmental assessment of RRfW systems is
358
that related to greenhouse gas (GHG) emissions (e.g. carbon dioxide (CO2), methane (CH4), nitrous
359
oxide (N2O)). GHG emissions are substances which absorb and re-emit heat, thereby warming up the
360
globe’s atmosphere; hence the global warming potential (GWP) metric (Fuglestvedt et al., 2001).
361
GWP is known by many names including GHG emissions, carbon emissions, or carbon footprint
362
(Christensen et al., 2009). Carbon footprint has emerged from ecological economics and has been
363
widely used in EE-IOA (Fang et al., 2014; Heijungs, 2011; Minx et al., 2009; Ridoutt et al., 2015;
364
Wiedmann, 2009). Nonetheless, uncertainty still governs its definition, meaning and measurement
365
(Peters, 2010; Wiedmann and Minx, 2008). For example, in a large volume of studies carbon footprint
366
is used interchangeably with the GWP or the carbon emissions, as a measure of the total amount of
367
GHG emissions that are directly and indirectly caused by an activity or accumulated over the lifecycle
368
of a product (Fang et al., 2014; Heijungs, 2011; Hertwich and Peters, 2009; Hoekstra and Wiedmann,
AC C
EP
356
14
ACCEPTED MANUSCRIPT 369
2014; Schulz, 2010), whereas in others it is used to account for only some of the GHGs, most often
370
CO2 emissions, generated by an activity or accumulated over the lifecycle of MCPs (Matthews et al.,
371
2008; Wiedmann and Minx, 2008). Evidently, the term “carbon” is used in a variety of ways to
372
express GHG emissions, which tends to be ambiguous and potentially confusing. The World Resources Institute (WRI) and WBCSD, in an effort to provide guidance to businesses
374
for measuring direct and indirect carbon emissions associated with the entire lifecycle of MCPs, have
375
developed the GHG protocol. In this protocol carbon emissions include only the Kyoto Protocol
376
GHGs (i.e. CO2, N2O, CH4, hydrofluorocarbons (HFCs), perfluorocarbons (PFCs), and sulphur
377
hexafluoride (SF6)) (Lee, 2011; Matthews et al., 2008; Peters, 2010; WRI/WBCSD, 2011). However,
378
in the waste sector, carbon emissions are reported based on the Entreprises pour l'Environnement
379
(EpE) protocol that was developed to provide guidance for waste management activities, and includes
380
only the gases most relevant to the sector which are CO2, CH4 and N2O (EpE, 2013; Gentil et al.,
381
2009; UNEP, 2010). Essentially this means that so far no approach has looked at the full range for
382
GHGs when it comes to RRfW systems, let alone other impacts of resource use and recovery on
383
climate change, such as forest clearance or albedo change (Gentil et al., 2009).
M AN U
SC
RI PT
373
The literature contains a considerable body of work on how to account for carbon emissions.
385
Carbon emissions can be directly and/or indirectly generated at each process of the RRfW system,
386
including emissions from energy (e.g. electricity and/or fuel use) and non-energy related activities
387
(Gentil et al., 2009; Machado et al., 2001; Nishimura et al., 1997; US EPA, 2006) (e.g. process and
388
fugitive emissions, such as CH4 released from digesters and composting technologies used in
389
mechanical biological treatment plants) (Amlinger et al., 2008; Flesch et al., 2011).
TE D
384
Indirect carbon emissions refer to the off-site, external, upstream or downstream emissions and
391
are also known as embodied carbon (EC). This metric has gained increase popularity over the last
392
decades due to its potential to account for the carbon embedded in MCPs through their whole
393
lifecycle (Cabeza et al., 2013; Ecorys, 2014; Lee, 2011; Peters, 2010; Purnell, 2012; Schulz, 2010)
394
(Table 1). EC is heavily dependent on the system boundaries applied, which can lack transparency.
395
Moreover, conversion factors for many MCPs are only very roughly estimated by both LCA and EE-
396
IOA.
AC C
EP
390
397
In waste management systems direct carbon (DC) emissions are usually related to the processes of
398
collection, transportation, management (i.e. incineration, reprocessing, composting, remanufacturing)
399
and transboundary movement of waste resources, whereas carbon emitted during the upstream
400
processes of manufacturing, including extraction and processing, transportation, use and international
401
trade of MCPs, are accounted for as indirect or embodied carbon (EC) (Table 1) (Bernstad and la
402
Cour Jansen, 2012; Clift et al., 2000; Nässén et al., 2007; Schulz, 2010). This points to an important
15
ACCEPTED MANUSCRIPT 403
aspect concerning the system boundaries of an assessment study: direct or indirect emissions depends
404
on the ‘central’ system looked at, and on what are direct emission from the producer’s perspective and
405
the indirect emissions from the waste manager’s perspective. The emissions of the various GHGs (whether direct or embodied) are aggregated to ‘carbon
407
emissions’ based on the warming potential of each single GHG over a given period of time (normally
408
a time-horizon of 100 years is adopted) as specified in the Kyoto Protocol, using CO2 as the reference
409
gas (IPCC, 2007; Peters, 2010; UNEP, 2010); hence the measurement unit in tonnes CO2 equivalent
410
(tCO2e). For example, 1 kg of CH4 causes 25 times more warming over a 100 year period than 1 kg of
411
CO2.
RI PT
406
Table 1 Key carbon emission metrics used in RRfW assessment methods. Description
Unit
Direct carbon emissions (DC)
Sum of carbon emissions released on site or from a specified process, due to direct consumption of energy (fuels or electricity) during use by the process considered as ‘central’ (independent of whether generated on-site or purchased, e.g. engines, motors, power plants, buildings, appliances, electronics, lighting), and direct use of GHGs and/ or products that contain or form GHGs that are emitted during use (e.g. refrigeration and air-conditioning equipment, industrial gases, fertilizers).
tCO2e
WRI/WBCSD 2011
Indirect or embodied carbon emissions (EC)
Emissions associated with upstream and/ or downstream (off-site) processes associated with MCPs. They may also include emissions from the generation of purchased electricity, steam, heating and cooling consumed by the process considered as ‘central’, measured based on the sum of units input upstream and/ or units output downstream (e.g. in kg), multiplied by the process-specific unit emission factor (e.g. kgCO2e/kg).
tCO2e
WRI/WBCSD 201; Schwarz et al. 2002
For MCPs: EC savings accruing from reductions in quantity and quality of primary materials, measured based on the sum of avoided units input (in kg), multiplied by the process-specific input emission factor (e.g. kgCO2e/kg).
tCO2e
Smith et al. 2001
References
EP
TE D
M AN U
Metric
AC C
413
SC
412
Avoided carbon emissions (AC)
For energy: EC savings from energy substitution by renewable energy, measured
16
ACCEPTED MANUSCRIPT based on the gas recovered, calorific value, conversion efficiency and assumed emission factors for the replaced alternative energy source.
A common measurement method has not yet been agreed. Carbon capture and sequestration (CCS)
It is the carbon stored in a processed material output that is not released in the atmosphere.
US EPA 2014
tCO2e
Gentil et al. 2009; UNEP 2010; WRAP 2010; Levasseur et al. 2012
M AN U
A common measurement method has not yet been agreed.
tCO2bioe
RI PT
Emissions related to the natural carbon cycle, as well as those resulting from the production, harvest, combustion, digestion, fermentation, decomposition, and processing of biologically based materials by humans.
SC
Biogenic carbon emissions (BC)
414
The avoided carbon (AC) emissions, presented in Table 1, are important in carbon accounting
416
strategies. These may represent the: i) emissions saved from the avoided landfilling of waste; ii) the
417
reduced input of raw materials and other resources when these are replaced by reusable, repaired, or
418
recycled materials (e.g. reuse of construction components in new buildings, redistribution of edible
419
food, replacement of fertiliser by compost, plastic bottles recycled into plastic bottles, use of solid
420
recovered fuels for energy generation) (EpE, 2013; Gentil et al., 2009; Scheutz et al., 2009; Smith et
421
al., 2001; UNEP, 2010; US EPA, 2006); or iii) those that occur when energy is produced as a co-
422
product in waste treatment processes (e.g. electricity and/or heat produced out of biogas, incinerator),
423
that replaces partially or fully the energy generated from fossil fuels (UNEP, 2010). In the latter case
424
AC emissions are difficult to estimate due to the uncertainty related to what is being replaced (e.g.
425
operating patterns, energy content, energy mix) (Smith et al., 2001). For material resources the energy
426
content is usually determined based on their net calorific value. Differences in AC emissions are thus
427
expected, especially when taking into account local circumstances (US EPA, 2006). Usually, assumed
428
emission factors per unit of energy recovered are used, which for the European context can be
429
estimated using a number of variables including energy mix and heat generation efficiencies (Smith et
430
al., 2001). Conceptually AC emissions are significantly different from DC and EC emissions. For DC
431
and EC emissions one estimates the emissions from one process (with different system boundaries),
432
while for AC emissions one must estimate the emissions for two alternative processes and calculate
433
the difference (for the same system boundaries).
AC C
EP
TE D
415
17
ACCEPTED MANUSCRIPT The real hurdle when it comes to accounting for carbon emissions is in regards to biogenic carbon
435
(BCe) emissions (see def. in Table 1) (US EPA, 2014). In a vast number of studies it is implicitly
436
assumed that the BCe of biodegradable materials (e.g. organic waste contained in food and garden
437
waste, paper and cardboard) released in the atmosphere after combustion, is in equilibrium to that
438
absorbed by the biogenic pool (i.e. during the growth of plants); hence it is purported that it should
439
not be accounted for as contributing to the global warming effect (Boldrin et al., 2009; Giugliano et
440
al., 2011; Gunn et al., 2012; Smith et al., 2001). Contrariwise, other studies suggest that BCe released
441
from activities such as permanent deforestation, burning of a tropical forest or combustion of forest
442
biomass for energy, is not entirely absorbed by biomass systems (Gunn et al., 2012; Rabl et al., 2007).
443
The basis of their argument is that the lower heating value (or net calorific value) of carbon is the
444
same regardless of its source, and as such BCe that is released in the atmosphere can also contribute to
445
the global warming effect, measured using a unit-based index called GWPbio or CO2biogenic emissions
446
(Blengini, 2008a; Cherubini et al., 2011; Christensen et al., 2009; Gentil et al., 2009; Parkes et al.,
447
2015).
M AN U
SC
RI PT
434
Nonetheless, there is not yet a common measurement method for BCe and this is also due to the
449
fact that not all of the carbon from organic materials entering treatment, is returned to the atmosphere.
450
In fact some of it remains stored in the material after the treatment process, reducing BCe emissions.
451
This carbon is accounted using the carbon capture and sequestration (CCS) metric (see def. in Table
452
1) (Rabl et al., 2007; Smith et al., 2001; WRAP, 2010b). If the CCS is in a form which is unavailable
453
to the natural carbon cycle over a sufficiently long time period, then it could be argued that a ‘sink’
454
for carbon has been created. The two main routes for carbon storage in waste management are in
455
landfills (e.g. where anaerobic conditions inhibit the decomposition of lignin based materials) and in
456
compost applied to soil (e.g. where carbon is converted to stable humic substances that may persist for
457
hundreds of years) (Smith et al., 2001; WRAP, 2010a).
EP
TE D
448
The stability of such sinks is difficult to assess, and may have different time scales between CCS
459
and BCe for different MCPs due to degradation rates (Rabl et al., 2007; Smith et al., 2001). For
460
example, wood used for buildings, furniture and wood-based materials can have CCS for decades or
461
centuries, but eventually much, or all of it, will be re-emitted to the atmosphere (Rabl et al., 2007).
462
Similarly, the rate by which the compost will re-emit CCS depends largely on how the soil is managed
463
(e.g. cropping, tillage, irrigation, compost application rate), the climate, the composition of the soil,
464
and the time-period that the compost is applied to land, as carbon releases (in the form of N2O) are
465
likely if vegetation is not taking up the nitrogen at the time of application (Boldrin et al., 2009; Smith
466
et al., 2001). What makes BCe accounting different from the accounting of other metrics is the time
467
dimension. To capture BCe adequately one must consider the distribution of GHG emissions, storage
468
and sequestration along the time axis, as any delay in the release of GHG emissions by temporal
AC C
458
18
ACCEPTED MANUSCRIPT 469
storage in products or waste, is important in terms of slowing down climate change (Cherubini et al.,
470
2011; Hellweg and Milà i Canals, 2014). This raises the issue of how this carbon should be accounted especially when comparing the
472
treatment options of different MCPs. Given the complex dynamics of CCS, and the high degree of
473
uncertainty related to its measurement, discussions on how to measure CCS in landfills and soils
474
amended with compost, or exchanges with the energy industry and the wood, pulp and paper
475
industries, are still ongoing (Gentil et al., 2009; Levasseur et al., 2012; UNEP, 2010). In the case of
476
BCe the U.S. Environmental Protection Agency (US EPA) has developed a framework for accounting
477
BCe from stationary sources (US EPA, 2014). Notwithstanding its potential to account for carbon
478
emissions, this framework measures EC, AC and CCS emissions all in the same formula, thus does not
479
provide insights into specific carbon emissions. In spite of that, the controversy around the carbon
480
neutrality of BCe is ongoing, and further clarifications on how to measure it are highly desirable in the
481
resource and waste management sectors, as this would shed some light on the environmental
482
assessment process of waste management options. For example, if BCe is disregarded, emissions from
483
the incineration of organic waste are unaccounted, whereas incineration always looks better than
484
landfill due to the fact that CH4 emissions from landfill are in fact accounted for (WRAP, 2010a).
M AN U
SC
RI PT
471
485
3.2 Pollutant emissions to air, water and soil
487
Other gases and compounds critical to the environment and as a consequence to human health are
488
also emitted during RRfW processes. These include (Acero et al., 2015; Azapagic et al., 2003) the
489
release of:
490 491 492
•
ozone-depleting gases such as chlorofluorocarbons (CFCs), hydrochlorofluorocarbons (HCFCs) and halons that contribute to the damage of the stratospheric ozone layer, measured by the ozone depletion potential (ODP) metric;
493 494 495
•
volatile organic compounds (VOCs) and other substances that contribute to photochemical ground-level ozone formation, measured by the photochemical ozone formation (POF) metric;
496 497 498
•
499 500 501
•
502 503 504
•
AC C
EP
TE D
486
gases that contribute to air, water and soil acidification, measured based on their acid formation ability (ability to form H+ ions), measured by the acidification potential (AP) metric; ammonia, nitrates, nitrogen oxides and phosphorous that contribute to the eutrophication of marine, freshwater and terrestrial ecosystems, measured by the eutrophication potential (EuP) metric; and
other substances, such as PTEs, particulate matter (PM), polycyclic aromatic hydrocarbons (PAHs) and persistent organic pollutants (POPs) that contribute to human and ecotoxicity, measured by the human toxicity potential (HTP) and aquatic toxicity potential (ATP) metrics.
505
These metrics, which are perhaps the most widely known metrics for assessing the environmental
506
impact of various pollutants, are described in detail in Section S1 in Supplementary Material, where a 19
ACCEPTED MANUSCRIPT Table of how these are measured is also provided (Table S1). All these metrics can be summed in a
508
single metric called the pollutant emissions metric (Allegrini et al., 2015; Schwarz et al., 2002).
509
However, such an aggregation can provide no insights into the specific pollutants nor their effects on
510
the environment and human health; hence, this metric is not further considered herein. Air pollution
511
control technologies and processes, such as wet-scrubbing, desulphurization, ammonia removal, acid
512
dry neutralization, fabric fly ash filtration, tar cracking and dioxin absorption are often implemented
513
to meet emission requirements (Chong et al., 2016). These measures aim at reducing the release of
514
these pollutants to the atmosphere and their subsequent impacts to the environment and human health,
515
linking the social (Section 5) and technical (see Section 6) with the environmental domain of value.
RI PT
507
Some additional forms of pollution that have not yet been (extensively) used to assess the
517
environmental damage caused by RRfW processes, have been identified. Because of the little
518
discussion around these forms of pollutions, there are currently no specific metrics used to describe
519
them, regardless the fact that are widely accepted by the science and research community. Even so,
520
these forms of pollution are gaining increased momentum and could not be ignored. These include
521
the:
M AN U
SC
516
•
emerging organic contaminants (EOCs) such as pharmaceuticals, hormones, and bisphenol A (e.g. those found in consumer products or over the counter prescription medications) (Boxall, 2004; Kleywegt et al., 2011; Kümmerer, 2003);
525 526
•
black carbon (BC) emissions, which constitute the main component of soot produced due to incomplete combustion of fossil fuels, biomass and/ or SRF;
527 528 529
•
emissions of waste heat losses from industrial devices used in most industrial processes and power plants to the environment that can significantly increase the temperature of the environment, leading to waste heat pollution or thermal pollution; and
530
•
nanoparticle emissions.
TE D
522 523 524
The latter (i.e. nanoparticle emissions) is relatively new (Acero et al., 2015; Hellweg and Milà i
532
Canals, 2014). Although nano-sized particles are common in nature (e.g. proteins, enzymes, DNA),
533
this form of pollution in the RRfW context refers particularly to the engineered or manmade nano-
534
sized particles that are intentionally designed to serve a specific purpose (e.g. carbon black and fumed
535
silica for applications in plastic fillers and car tyres, silver nanoparticles coated onto polymers like
536
polyurethane) (Albrecht et al., 2006; Hoet et al., 2004; Jain and Pradeep, 2005). A detailed description
537
of this, and of the other three metrics can be found in Section S1 in Supplementary Material.
AC C
EP
531
538
What is worth noticing herein is that discussions around the potential release of these forms of
539
pollution in the environment and associated measurements are still unclear. Further research is thus
540
required into accounting for the effects of these forms of pollution.
541 542
3.3 Resource depletion: Energy related metrics
20
ACCEPTED MANUSCRIPT 543
The resource depletion metric used in LCA studies includes the consumption of resources such as
544
fossil fuels, metals and minerals. This sub-section concentrates on fossil fuels, despite the fact that
545
also nuclear and biogenic fuels, wind, water, geothermal and solar energy are also gaining increased
546
momentum as energy-related resources. Fossil fuels are used for energy generation (e.g. electricity, motion and heat) of which
548
consumption is one of the most widely documented metrics in the literature (alongside carbon
549
emissions with which it is associated). The list of energy metrics in use is extensive, and can be found
550
in the reports of IAEA, UNDESA, IEA, EUROSTAT and EEA, 2005 (Kemmler and Spreng, 2007),
551
EEA, 2006, and DECC 20015 (DECC, 2015). LCA, IOA and sustainability assessment indicators
552
include energy use as one of the most basic metrics to describe a production or recycling system. The
553
basic energy consumption metric known as direct energy consumption, refers to the total energy
554
extracted or purchased and consumed directly by any sector of the economy (e.g. transport fuels,
555
electricity, gas for heating). It includes both primary and secondary energy consumption. Primary
556
energy consumption (Table 2) is the energy produced from coal, crude oil, natural gas, nuclear
557
materials and renewable sources (including solar energy, wind energy, bioenergy, hydropower,
558
marine energy, geothermal) (Liu et al., 2014; Nässén et al., 2007), of which conversion to electricity,
559
heat and other human induced transformation (e.g. refinery gas, diesel, naphtha, ethane, gasoline)
560
represents the secondary energy produced (OECD/IEA, 2005; Øvergaard, 2008). As opposed to direct
561
energy consumption, indirect energy consumption refers to the energy consumed to produce the
562
energy, goods or services used in a specific process in the RRfW system called as ‘central’ (Baynes et
563
al., 2011). In an IO consumption analysis, indirect energy refers to energy embodied in the
564
production, storage and transport of goods and services consumed (Baynes et al., 2011), for which
565
more details are provided further down in this section.
TE D
M AN U
SC
RI PT
547
To gain some scrutiny into the energy used per unit of MCP produced, used, collected, sorted,
567
repaired and reprocessed the energy intensity metric was proposed in the studies of Székely and
568
Knirsch 2005, Schwarz, Beloff and Beaver 2002, Bernard and Côté 2005. This metric can be used to
569
measure the energy consumed to provide the heat and power requirements for the process per tonne of
570
product produced, and thus it can provide information on the process operations, focusing on
571
environmental performance and process improvements. However, energy intensity has a dual function
572
as besides its ability to express the energy use per mass unit of output, it can also be used to express
573
the energy use per unit of monetary value (Schwarz et al., 2002; Székely and Knirsch, 2005), which in
574
the study of Bernard and Côté (2005) it was indicated as a more meaningful way of measuring
575
industry outputs and assessing process improvements, such as enhanced energy recovery or higher
576
production capacity (Bernard and Côté, 2005).
AC C
EP
566
21
ACCEPTED MANUSCRIPT This is in line with other studies, indicatively Liu et al. (2014), Krajnc and Glavic (2003), where
578
the energy intensity metric was only associated with economic terms (e.g. the prices of
579
components/products sold or value added), whereas Reddy and Ray (2011) and Nassen et al. (2014)
580
made a distinction between physical and economic energy intensity, with the first accounting for the
581
final energy use per physical unit of output, and the latter for the final energy use per monetary value
582
of unit of output sold (Nässén et al., 2007; Reddy and Ray, 2011). Reddy and Ray (2011) state that
583
implications in economy (e.g. fluctuations in the price of materials, monopsonistic industries that
584
control a significant share of the price of specific materials, and monopolistic industries that control a
585
significant share of the produced goods and/or have a better image), as well as a number of other
586
factors (e.g. energy mix changes, energy input mix changes and energy-for-labour substitution
587
processes) (Patterson, 1996), can result in variations in the energy intensity which may not reflect or
588
even negatively affect changes in (technical) energy efficiency (more on energy efficiency on Section
589
3.5).
SC
RI PT
577
As such, for defining physical energy intensity, Reddy and Ray (2011) have used the specific
591
energy consumption and adjusted energy consumption metrics. The latter was defined as the total
592
energy consumption adjusted to the weight of unit process output, whereas specific energy
593
consumption was defined as the ratio of total energy consumption to total unit (MCPs) production.
594
The specific energy consumption metric was also used in the study of Krajnc and Glavic (2003) and
595
Siitonen, Tuomaala and Ahtila (2010) to express the amount of energy used per unit output. As such,
596
to retain consistency, the specific energy consumption metric was used herein to express the energy
597
used per unit output (Table 2) (Krajnc and Glavič, 2003; Siitonen et al., 2010).
TE D
M AN U
590
It is important to keep the energy consumption metrics and energy efficiency metrics distinct; while
599
the consumption compares energy used to produce a unit of MCP, energy efficiency (gain) compares
600
energy input and output of a process. Such a comparison provides the ability to assess the
601
effectiveness of a process in recovering resources from waste as for example, by reducing the amount
602
of resources used in production – consumption processes or by increasing the amount of resources
603
recovered (in a variety of forms) during collection, reuse, recycling, recovery after their disposal as
604
wastes. Further details on the use of efficiency metrics are found in Section 3.5.
AC C
EP
598
605
Cumulative energy demand (CED), also known as lifecycle embodied energy (LEE) or gross
606
energy requirements (GER) are metrics originating from the Embodied Energy Analysis method that
607
deal with the direct and indirect energy consumption required across the entire lifecycle of MCPs
608
(Table 2) (Cherubini et al., 2009; Patel et al., 2000; Ulgiati et al., 2011; Worrell et al., 1994). The
609
different forms of energy
610
converted back to their primary energy sources including crude oil, natural gas, anthracite, lignite,
611
uranium ore, hydropower, biomass and others, taking into account conversion losses from electricity
(renewable or non-renewable) consumed throughout the system are
22
ACCEPTED MANUSCRIPT and heat generation (Arena et al., 2003; Bengtsson, 2004; Kaufman et al., 2010; WBCSD, 2000). As
613
such, when using these metrics, different system boundaries and geographic location pose a constraint
614
in getting a certain value for a certain product and deviation can be relatively high. As such, a
615
prerequisite when using CED or GER is to retain consistency in the way data are collected and used.
616
These metrics have been widely used in the evaluation of the environmental and energy impacts of
617
several sectors. The CED is frequently employed to determine energy payback periods for alternative
618
generation technologies such as solar and wind; and to evaluate the efficacy of efforts to produce
619
energy from biomass (Kaufman et al., 2010).
RI PT
612
Energy recovered from material landfilling (i.e. biogas) and from the digestion and combustion of
621
bio- and other waste with energy recovery (EfW), can be accounted for as renewable energy
622
generation measured using the renewable energy generation metric (Table 2). This metric is a
623
measure the renewable energy generated from MCPs in the form of biogas and syngas that are often
624
combusted to produce electrical energy and heat via a CHP engine, or alternatively are converted to
625
liquid fuel such as, gasoline and liquefied biomethane (Belgiorno et al., 2003).
M AN U
SC
620
Meanwhile, to account for all the energy flows in an economy based on the first law of
627
thermodynamics, the energy analysis tool has emerged. The principle of this tool is that energy is
628
constant and cannot be created nor destroyed, but it can only be converted into different types or
629
‘qualities’ of energy measures, such as exergy and emergy (Finnveden and Moberg, 2005; Hovelius,
630
1997). Both the exergy and the emergy form of analyses are more advanced than the previously
631
mentioned energy related metrics as they consider both the quality and quantity of energy consumed
632
(Dincer and Rosen, 2012). Exergy, or else ‘useful’ energy, is the maximal amount of mechanical or
633
ideal work (or the work content of a variety of streams e.g. mass, heat, work, that flow through a
634
system) that can be obtained from a system that moves from a particular state to a state of equilibrium
635
with the environment, based on the 2nd law of thermodynamics (Table 2) (Bejan, 2002; Gundersen,
636
2009; Wall, 1977; Wall et al., 1994; Wall et al., 1986). It is not only a measure of inputs, but also a
637
measure of outputs (Ayres et al., 1998).
AC C
EP
TE D
626
638
As such an exergy analysis gives an overview of the effectiveness of resource utilisation,
639
indicating where losses occur (i.e. where exergy is destroyed), and where technological improvements
640
can be made to increase energy efficiency. Losses can be in the form of low temperature heat, but also
641
in the form of chemically or physically reactive materials, that are dissipated into the environment
642
(Ayres et al., 1998). These losses (i.e. waste heat and waste products) can drive undesired
643
environmental impacts, as for example the insertion of nano- and micro-scale chemical species (e.g.
644
toxins, nanoparticles, etc.), increasing the entropy of the system that has the potential to disrupt
645
delicately balanced ecosystems and life processes far from equilibrium (Ayres et al., 1998).
23
ACCEPTED MANUSCRIPT Exergy, based on the 2nd law of thermodynamics, is always destroyed when energy is converted,
647
either partially or totally, and its destruction is proportional to entropy production and the reduction of
648
products quality. This is the reason why exergy has been suggested as a measure of assessing the
649
thermodynamic efficiency and resource depletion of a system (Finnveden and Östlund, 1997). In order
650
to perform an exergy analysis the exergetic values of any occurring energy form (e.g. electrical or
651
mechanical work, heat and material streams) have to be calculated (Fonyó et al., 1999). A detailed list
652
of thermodynamic properties of materials and a mathematical apparatus associated with defining and
653
calculating the exergies of various products can be found elsewhere (Bejan, 2002; Gundersen, 2009).
654
Examples of using the exergy metric include the regional exergy analyses for Japan (Wall, 1990),
655
Norway (Ertesvåg and Mielnik, 2000), Brazil (Schaeffer and Wirtshafter, 1992), Italy (Wall et al.,
656
1994), Sweden (Wall, 1977), and the United States (Ayres et al., 2003). In the context of RRfW,
657
exergy analysis has been reported to be a suitable way of contributing to measuring the sustainability
658
of industrial metabolisms of MCPs (Amini et al., 2007; Dewulf and Van Langenhove, 2002).
SC
RI PT
646
Emergy is defined as the quantity of direct and indirect solar energy required to obtain all
660
resources and goods used and produced by a given process, which is estimated by converting energy
661
inputs and other flows into their solar equivalent, using the solar transformities (Table 2) (Giannetti et
662
al., 2010; Odum and Peterson, 1996). Odum (1996) has created a methodology for Regional Emergy
663
Analysis where the environmental and economic values associated with the use of MCPs are
664
represented in a common energy unit (Giannetti et al., 2010). Specifically, they have created four
665
indices for emergy that aim to capture the environmental, economic and social aspects associated with
666
the use of resources, including the environmental yield ratio (EYR); the environmental investment
667
ratio (EIR); the environmental load ratio (ELR), and the environmental sustainability indices (ESI),
668
for which further information can be found elsewhere (Daley, 2013; Giannetti et al., 2010).
TE D
M AN U
659
Table 2 Key energy related metrics used in RRfW assessment methodologies.
AC C
670
EP
669
Metric
Description
Unit
References
Primary energy consumption (PEC)
Sum of ‘raw’ or ‘gross’ energy input (per process), based on the calorific value of fuels used. For energy not based on “burnable” fuels a variety of – partly inconsistent – conventions exist.
kWh
Nassen et al. 2007; OECD-IEA, 2014
Specific energy consumption
Sum of final energy consumed per unit of output*.
kWh/t output
Siitonen et al. 2010
Cumulative energy demand (CED); or Gross energy
Sum of all the material and energy inputs to the analysed system multiplied by appropriate oil equivalent factors (g oil eq./unit of inputs) and then converted
kWh/ unit of inputs
Cherubini et al. 2009
24
ACCEPTED MANUSCRIPT
Renewable energy generation
Sum of (potential) renewable energy generation per unit input.
kWh/t input
Bernstad and la Cour Jansen 2012; Perkoulidis et al. 2010
Exergy
Sum of the ηEx of useful exergy from the process to the total exergy to the process based on the exergetic value of all characterized resources in the process.
MJ
Gundersen, 2009; Ayres et al. 1998
Emergy
Sum of the emergy value of all characterized resources in the product system, using the solar emjoules (sej).
sej/t
RI PT
to SI energy units by multiplying by the standard crude oil equivalency factor of 41.860 J/g.
SC
Ingwersen et al. 2014; Giannetti et al. 2010
* If energy in different forms (e.g. fuels, steam and electricity) is used, then these are accounted for in the final energy consumption
M AN U
671 672 673
requirement (GER)
3.4 Resource depletion: Non-energy related metrics
675
Depletion of resources other than energy based sources is also of concern in RRfW systems. One
676
could consider this to be the most important aspect as all efforts to recover, reuse, repair, recycle
677
materials from wastes aims at reducing the depletion of primary natural material resources, and the
678
environmental degradation as a consequence thereof. Whereas the importance of these metrics in
679
assessing RRfW systems is outlined herein, a description of how these metrics are measured can be
680
found in Section S2 (Table S2) of Supplementary Material.
TE D
674
Water consumption, or water footprint or blue water footprint as it is known in the IOA, is a
682
measure of the volume of surface and groundwater consumed by the production of, or incorporated
683
into a MCP. It is one of the most widely used environmental metrics in many assessment
684
methodologies and tools related to RRfW systems (Fang et al., 2015b). Mining, oil refineries,
685
manufacturing industries (e.g. chemical producers, pulp and paper industry, food and beverage
686
industry) and power plants use large amounts of water either as a cooling/heating medium, a cleaning
687
agent, or a reaction solvent (Krajnc and Glavič, 2003). As such, the water consumption metric
688
includes evaporation and misting losses from cooling water, water vapour vented to the atmosphere,
689
water lost through waste treatment or disposal, and water lost through deep-well injection (Schwarz et
690
al., 2002). Water consumption is important not only because its abstraction can create problems
691
associated with low riverine flows, lowering of ground water tables, and salt-water intrusion in coastal
692
areas, but also due to water scarcity, soil quality and biodiversity impacts in the long term in many
693
areas around the globe (EEA, 2008; FAO, 2009; Thames Water, 2016). In areas where water scarcity
AC C
EP
681
25
ACCEPTED MANUSCRIPT 694
constitutes a problem, production and waste treatment processes that require large amounts of water
695
(e.g. food production, incineration, etc.) might be unsustainable. Moreover, the loss of water quality due to its use in RRfW systems is especially important because
697
it reduces the availability of water as a resource, leading to water resource depletion. For example, the
698
use of water for the removal of hazardous substances from the flue gas stream during incineration
699
(Oppelt, 1987), or the leachate produced during composting and anaerobic digestion requires special
700
treatment in order to ensure its secured discharge, and avoidance of uncontrolled leaks of leachate
701
(Krogmann and Woyczechowski, 2000). The use of water in industrial processes results in the
702
generation of wastewater, the recovery and recycling of which is important in ensuring the removal of
703
nutrients, metals, and persistent organic pollutants for meeting environmental protection regulatory
704
standards (Renou et al., 2008). This is critical not only for the protection of water, soil and air from
705
pollutants emission, but also of human health, of which metrics are discussed in Section 3.2. In this
706
section, the description of the loss of water quality metric is not straightforward. It requires a series of
707
tests that measure the physical properties of the waste water including its temperature and turbidity, as
708
well as its chemical (e.g. pH, salinity, oxygen dissolved, total dissolved solids) and biological (e.g.
709
algae, bacteria, etc.) parameters (APHA, 1992; UNEP/WHO, 1996).
M AN U
SC
RI PT
696
Non-energy raw materials are essential inputs to all industries across all supply chain stages. For
711
example, 50 different kinds of metals are used to produce a smartphone, all of which are needed to
712
give it its light weight and user-friendly small size (Benton and Hazell, 2014). Evidently, the amount
713
of raw materials used for the production of components and products is growing in importance due to
714
pressures related to their future availability and supply, the environmental damage caused by their
715
extraction, as well as their wastage per material, component, and product output. In the study of
716
Schwarz et al. (2002) the amount of material used in the component/product was measured by the
717
amount of material wasted (not converted to desirable product) per unit output, using the material
718
intensity metric (Schwarz et al., 2002). However, the use of this metric in the study of Krajnc and
719
Glavic, 2003, has been associated with economic terms (e.g. value of component/product sold or
720
value added), and the specific material consumption metric was used instead to express the amount of
721
material wasted per unit output. To retain consistency with the terminology used, the specific material
722
consumption metric was also used herein.
AC C
EP
TE D
710
723
Special reference must also be made to critical raw materials (CRMs) (e.g. rare earth elements,
724
cobalt, niobium, scandium, etc.) which in the EU have gained increased momentum over the last
725
decade due to the need to secure reliable and unhindered access to these critical reservoirs in the
726
coming years (European Commission, 2016). Therefore, critical raw materials use is a way to capture
727
the amount of these materials used and disposed, during the entire lifecycle of MCPs. Criticality is an
728
important element to be accounted for as it may vary between the different levels of the infrastructure 26
ACCEPTED MANUSCRIPT 729
system (e.g., materials, component, technology), as well as due to the implementation of more
730
technically specific engineering solutions (Dawson et al., 2014). Other metrics related to the measurement of resource depletion include the recycled/reused content
732
or feedstock renewability, which are widely used in the GRI, WBCSD eco-efficiency analysis, green
733
design, eco-design, and sustainability assessment methodologies amongst others (GRI, 2013; UNEP
734
and SETAC, 2011; WBCSD, 2000; Zurbrügg et al., 2014). Recycled/reused content, or feedstock
735
renewability, is an important metric that indicates the circularity of materials or parts of a product that
736
are being repaired, reused, returned and recycled, displacing primary raw material use in new
737
products, and providing a measure of waste diversion from incineration and/or landfill (Atherton,
738
2007; Broadbent, 2016; Steenkamer and Sullivan, 1997).
RI PT
731
Land use is increasingly thought to be important over recent years, and is appearing in the metrics
740
list of many assessment methods and tools (Tanzil and Beloff, 2006). This is because in RRfW
741
systems, land has been widely used for the construction of landfill sites and other facilities that
742
produce and manage resources, taking up space that could be used for other applications (agriculture,
743
house building, etc.) or natural land/wilderness (Acero et al., 2015; Bengtsson, 2004; Stranddorf et al.,
744
2006; US EPA, 2006). In addition, recovery of biotic resources can reduce the pressure on land (and
745
sea) areas to produce ever more crops and other materials. Demolition and decommissioning of
746
landfill and facilities on the one hand, will have implications to the physical characteristics and land
747
use of the site. By their nature, such projects have the potential to change the land and landscape
748
completely; soils may be compacted or may become contaminated with toxic materials (e.g. leachate)
749
or reduced in quality by mixing with demolition waste, such as bricks and concrete (EA, 2002); hence
750
the land use metric.On the other hand, the need to construct new plants will also change land use
751
impact on agricultural production, and as a result in the societal opportunities provided by the specific
752
piece of land. From an environmental point of view, land degradation as a result of land-use change
753
constitutes an important threat to ecosystems, and may lead to natural habitat loss and landscape
754
(EEA, 2010). However, land degradation cannot be assessed by a single metric, but requires instead a
755
series of observations and measurements related to the land condition, including soil erosion by water
756
and wind, soil fertility decline, loss of vegetation cover, increased desertification, amongst others
757
(Dent et al., 2007).
M AN U
TE D
EP
AC C
758
SC
739
759
3.5 Efficiency metrics
760
This category includes a number of important metrics that aim to assess the effectiveness of a
761
process or system based on information concerning the same resource or energy flow from two
762
specific points of the system (i.e. usually the input and output sides of a process) (Brunner and Ernst,
27
ACCEPTED MANUSCRIPT 763
1986), or for two different resources (usually a secondary and primary resource) that flow at the same
764
specific process. Based on the second law of thermodynamics, energy conversion is never 100% efficient; it always
766
leads to energy ‘losses’ (more correctly, e.g. downgrade of high-value mechanical or chemical energy
767
into unusable low-temperature waste heat). As such, the energy efficiency gain (or loss) is one of the
768
most widely used efficiency metrics in the literature. It is used to express the reduction in the energy
769
consumption of a process, while delivering same unit output, or the use of same energy input for a
770
higher output (OECD/IEA, 2005).
771
Although,
there
is
no
one
unequivocal
quantitative
RI PT
765
measure
of
energy
efficiency
(gain/improvement) (Patterson, 1996), in general, energy efficiency is the ratio of energy unit output
773
to energy input (Herring, 2006), and thereby influences the amount of useful energy required to
774
produce a tonne of MCPs (Table 3). It is also used as a proxy for the energy lost to the environment
775
as waste energy (e.g. waste heat) (See Section 3.2). In a number of studies it is indicated that the use
776
of energy efficiency is not representative of the unit output per energy input. In these studies, it is
777
reported that thermodynamic or thermal efficiency indicators, physical-thermodynamic indicators,
778
economic-thermodynamic indicators (sometimes also referred to as energy intensity index, i.e. energy
779
input in thermodynamic terms and output enumerated in monetary terms), and economic indicators
780
(i.e. where both the energy input and unit/service output are enumerated in monetary terms) could be
781
used instead to measure gross energy efficiency of a process or system (Bunse et al., 2011; Giacone
782
and Mancò, 2012; Patterson, 1996).
TE D
M AN U
SC
772
Thermodynamic or thermal efficiency indicators measure efficiency in terms of the heat content of
784
the inputs and outputs of the process. They make no distinction between high- (e.g. electricity) and
785
low-quality (e.g. solar energy) energy sources, and as such, these efficiency metrics are often limited
786
in their use because they do not allow for the comparison of energy efficiency across processes that
787
have different energy inputs and outputs (Patterson, 1996). The quality aspect is a fundamental
788
problem across all energy efficiency indicators, especially when trying to compare processes with
789
different quality inputs and outputs. Despite the quality aspect limitation, the physical-thermodynamic
790
indicators are considered to be good general measures of energy efficiency. Physical-thermodynamic
791
indicators measure the energy input in thermodynamic units, but the output is measured in physical
792
units in terms of mass (e.g. tonnes of butter, tonnes of bricks, tonnes of wheat, tonnes of aluminium)
793
or volume (e.g. litres of milk, cubic metres of wood or timber, litres of oil) (Patterson, 1996).
794
However, due to the variety of types of products produced in the same industry, allocating one energy
795
input to several outputs in an industry (e.g. steel and slag in steel production) can make the
796
measurement of energy efficiency a challenging and uncertain process.
AC C
EP
783
28
ACCEPTED MANUSCRIPT The use of an energy efficiency index has been presented in the study of Siitonen et al. (2010). This
798
metric is expressed as the ratio between the optimum specific energy consumption of a process based
799
on the best available technology (BAT) (e.g. EfW with advanced flue gas treatment, landfills with
800
methane collection, etc.) (Table 3) (Kaufman et al., 2010). The benchmark value of the unit output or
801
a specific period of time and the specific energy consumption of the process, were developed to
802
monitor and evaluate the progress in achieving energy efficiency (Siitonen et al., 2010). A yet another
803
energy related efficiency metric of great importance in the waste management sector the so called ‘R1
804
formula’ (Table 3). This mathematical formula is used to assess the efficiency of EfW recovery
805
processes. For being accepted as ‘high efficiency’ the R1 formula outcome must be equal to or higher
806
than 65% for recently constructed plants (European Commission, 2008; European Union, 2008). This
807
formula is only dedicated to the treatment of MSW in EfW plants and its use must be based on the
808
functional incineration unit. Use of this formula enables the classification of EfW plants treating
809
MSW to be considered as recovery rather than disposal plants (CIWM, 2017).
SC
RI PT
797
A metric that focuses specifically on evaluating the energy balance of RRfW systems has been
811
developed by Kauffman et al. (2010), in order to assess and compare different waste management
812
options based on their energy savings. This metric, called the resource conservation efficiency (RCE)
813
metric, uses the CED and energy savings from the recycling of different materials and applies them to
814
identify which management option gives the higher energy savings (see def. of CED in Table 2)
815
(Kaufman et al., 2010). The development of this metric is based on the fact that any material being
816
considered for resource recovery can result to an amount of energy savings under current resource
817
recovery technologies, such as the energy recovered from material landfilling (i.e. biogas); from
818
energy recovery options (e.g. from EfW); and from the energy saved by recycling, in order to
819
indicate which process gives the maximum (energy) savings (Kaufman et al., 2010; Klinghoffer and
820
Castaldi, 2014). For example, energy savings from recycling is the difference between the energy
821
required to manufacture a new product minus all of the energy required to transport and reprocess the
822
product in the recycling phase (Klinghoffer and Castaldi, 2014). The use of technical metrics (Section
823
6) can provide clarity to the use of RCE, indicating the strong linkages between different domains of
824
value.
AC C
EP
TE D
M AN U
810
825
In some studies, the substitution effect in the energy use, has been accounted using the RCE metric
826
(Bernstad and la Cour Jansen, 2012; Perkoulidis et al., 2010). In the study of Kaufman et al. (2010), it
827
was suggested that if the difference in energy savings for a recyclable material is greater than the
828
energy that would be attained from the combustion of that material with energy recovery (e.g. from
829
EfW), or the recovery of methane from its landfilling, then recycling is considered the best option. For
830
non-recyclable materials or those materials that have energy recovery (either from EfW or landfilling)
831
values higher than their energy saving value, then the best option is considered to be the one that
29
ACCEPTED MANUSCRIPT 832
offers the highest energy recovery value (Kaufman et al., 2010; Klinghoffer and Castaldi, 2014). The
833
major drawback of this metric is that it indicates the best management option from a pure energy
834
conservation perspective, but not from a wider environmental or even sustainability perspective
835
(Table 3). In regards to the material efficiency metric we distinguished this into upstream and downstream
837
material efficiency. Upstream material efficiency, provides an insight into how efficient the design
838
processes can be when it comes to raw material use at the upstream part of the RRfW (i.e. production
839
of MCPs) (Tabone et al., 2010). Downstream material efficiency, also known as material recyclability
840
(Azapagic and Perdan, 2000), denotes the amount of material recovered by the recycling facilities for
841
reprocessing into new materials (i.e. at the downstream part of the RRfW system) (Bartl, 2015;
842
Graedel and Allenby, 2003). This is one of the most important metrics for measuring the efficiency of
843
waste management systems, but it generates variable results, based upon the definition of the system,
844
i.e. what counts as input to be recycled and what is actually recycled. Whereas recycling of many
845
materials is certainly preferable, recycling rate alone is not suitable as a measure of the overall waste
846
management quality, efficiency or even sustainability.
M AN U
SC
RI PT
836
There are several reasons for this, but a couple stand out as being the most significant. First, it does
848
not account for the differences between landfilling and EfW for non-recycled wastes as the potential
849
alternative EoL management options. Second and perhaps more importantly, it omits materials that
850
are not recyclable at all (e.g., many plastics, contaminated wood, novel composites) by the
851
contemporary technologies, and therefore not even collected for recycling; and it does not accurately
852
account for the inventible rejects during processing and reprocessing for recycling. In other words, by
853
default, the maximum possible recycling rate, based on all possible definitions of ‘recycling’, is well
854
below 100%. Intrinsically, this metric should be interpreted with care, as it only allows to get an
855
estimate of the potential for recycling, and not the actual amount of material that will be recycled.
856
Especially, for multiple-material products for which dismantling and subsequent material separation
857
may present numerous difficulties, this metric must be used with in combination with technical
858
metrics (Section 6) in order to avoid any major misestimating, and/or double counting.
AC C
EP
TE D
847
859
An additional indicator that could be included to show the actual proportion of the recycled
860
materials used as input in new MCP production, is the recycled material fraction metric, presented in
861
the study of Krajnc and Glavic (2003). The recycled material fraction metric, also known as recycled
862
content, attempts to provide information on the intensity of secondary (recycled) material used in the
863
production of new MCPs, by using the ratio of recycled material over raw material content (Table 3).
864
The recycled material fraction of new MCPs has been reported in many studies (Allacker et al., 2014;
865
Ardente and Mathieux, 2014; Ardente et al., 2013). In the study of Allacker et al. (2014), it was
866
reported that there are different allocation approaches related to recycled material fractions including 30
ACCEPTED MANUSCRIPT the market-based approached suggested by Ekvall (2000), the Eco-cost and value-ration (EVR) model
868
suggested by Vogtländer et al. (2001) and the material-quality-based approach suggested by Kim et
869
al. (1997), for which more information can be found in the respective studies (Ekvall, 2000; Kim et
870
al., 1997; Vogtländer et al., 2001). What must be highlighted herein, is that the recycled material
871
fraction of a MCP is independent of its original use, as this might differ widely, especially when
872
materials and components fall into the cascade recycling system (more on cascading on Section 6)
873
(Allacker et al., 2014; Kim et al., 1997); and therefore does not provide any insights into the so called
874
‘closed’ vs. ‘open’ loop or ‘upcycling’ vs. ‘downcycling’ debate.
RI PT
867
Focusing on the EoL of components and products and their recoverability potential, Mathieux et
876
al. (2008) have developed a method to enable designers to produce better recoverable products. This
877
method, using the results of multi-criteria and multi-scenario recoverability assessments, has
878
generated the weight recovery indicator which differentiates between the weight of product recovered
879
and the weight of product that is actually recycled in proportions as shown in Table 3 (Mathieux et
880
al., 2001).
881
Table 3 Key efficiency metrics used in RRfW assessment methodologies. Description
Unit
References
Energy efficiency (Eeff)
Estimated by converting energy from one form into another, using the ratio of the sum of the useful energy output of a process (i.e. the energy embedded in MCPs) by the sum of energy input for a specified energy conversion process or system energy.
% (on kWh)
Patterson 1996, Giacone and Mancò 2012
Measured using the specific energy consumption of a process based on a reference value that can be defined on the basis of the best available technology (BAT), a benchmark value of the product in question, or a specified reference period divided by the specific energy consumption of the process or system.
% (on kWh/t)
Siitonen et al. 2010
R1 formula
Measured based on the ratio between the energy content of output (e.g. output of electricity and heat) and the energy content (caloric value) of the material input that is used for energy recovery.
% (on J)
CIWM, 2014
Resource conservation
Measured based on the energy savings of different waste management options per
% (on MJ/t)
Kaufman et al. 2010
TE D
Metric
Energy efficiency index
EP
Expressed using the Greek letter η.
AC C
882
M AN U
SC
875
31
ACCEPTED MANUSCRIPT material input by the materials input in each option, divided by the energy savings achieved by the best practice.
Upstream material efficiency
Sum of material output of full upstream production process divided by the sum of material input in the full production process for a specific MCP. NOTE: this metric can also be based on the difference in the density of the product made with less materials over the density of the same product that was made with more material providing the same physical and functional characteristics.
Tabone et al. 2010
Sum of material output of recycling process divided by the sum of material input in the recycling process.
% wt.
Recycled material fraction
Sum of recycled material input by mass divided by the raw material input by mass for a specific MCP.
% wt.
Weight recovery (for product recovered)
Measured based on the difference between the mass of the product (kg) and the sum of material waste as output from process x, divided by the mass of the product.
% wt.
Mathieux et al. 2008
Weight recovery (for product recycled)
Measured based on the difference between the mass of the product (kg) and the sum of material waste generated and quantities of materials diverted into energy recovery from process x, divided by the mass of the product.
% wt.
Mathieux et al. 2008
TE D
M AN U
SC
Downstream material efficiency
Bartl, 2015;
Graedel and Allenby, 2003
Krajnc and Glavic, 2003; Azapagic and Perdan, 2000
EP
883
% wt.
RI PT
efficiency (RCE)
3.6 Integrated metrics
885
Integrated metrics, often in the form of composite metrics, combine multiple aspects of system
886
performance into a single measurement, based on a common scientific or economic principle, with the
887
aim to address a broad number of aspects (Atlee and Kirchain, 2006; Ingwersen et al., 2014). Over the
888
last two decades, a large number of integrated metrics have made their appearance as a way to
889
measure sustainability in a single measurement.
AC C
884
890
A specific aspect that must be emphasised in assessing the sustainability of a process, and of
891
RRfW systems in general, is the geographic and socio-demographic environment in which a
892
manufacturing or a waste management plant is located. Thus, a pulp and paper plant isolated in the
893
Canadian forest, making extensive use of forest products and discharging waste water into a large 32
ACCEPTED MANUSCRIPT 894
river, may turn out to be sustainable because ecosystems are only locally affected and within their
895
ecological limits, and as such long-term equilibria remain intact. On the other hand, the same plant,
896
using the same resources and with the same polluting activities, located in a heavily populated area,
897
will not be as sustainable as it would deplete the limited local natural resources (forest, water) posing
898
negative impacts on the nearby communities and ecosystems. A metric that can account for these spatial characteristics is critical. The concept of environmental
900
space has evolved to account for the environmental pressures that a given space can handle without
901
incurring any damages to the surrounding ecosystems, and affecting the biota they supports. In
902
essence environmental space refers to the space available for the water, energy, land, materials
903
(renewable and non-renewable) that can be exploited including stocks and sinks (i.e. capacity to
904
absorb waste and pollution) (Callens and Tyteca, 1999; Hille, 1997). The per capita environmental
905
space available in EU has been calculated and reported in an EEA report (1997) as a way to promote
906
reduction in the use of primary resources (Hille, 1997). But controversy over its potential to properly
907
account for the resources available per capita, and the differing needs according to spatial, economic
908
and socio-political aspects, has undermined its potential use to promote sustainability.
M AN U
SC
RI PT
899
A metric developed in the same lines as the environmental space is the Ecological footprint (EF).
910
EF aims to measure how much of the biosphere’s annual regenerative capacity is required to renew
911
the natural resource demand of a defined population in a given year (see Table S3 in Supplementary
912
Material) (Monfreda et al., 2004; Venetoulis and Talberth, 2008). It intends to cover all relevant
913
components of a population's resource consumption and waste production (Monfreda et al., 2004;
914
Wackernagel and Rees, 1998), however in its current version it only captures renewable material
915
resources (e.g. food, fuel, fiber) and carbon emissions. This is done by identifying all the individual
916
items, and amounts thereof, and then assessing their EF using lifecycle data (Monfreda et al., 2004).
EP
TE D
909
The EF - although used widely as an integrated metric for assessing environmental sustainability
918
(Barrett and Scott, 2001; Wiedmann and Barrett, 2010) - is also used as a tool for benchmarking
919
environmental performance and monitoring progress towards sustainability (Monfreda et al., 2004;
920
Venetoulis and Talberth, 2008). However, there is still controversy when it comes to its usefulness in
921
decision- and policy-making (Giampietro and Saltelli, 2014; Wiedmann and Barrett, 2010), despite
922
its ability to be used as a standalone tool for communicating over-consumption and its wider issues.
923
Nevertheless, research around its potential use is ongoing with recent investigations suggesting that
924
the EF does not provide a meaningful interpretation of the modelling of sustainability (Giampietro
925
and Saltelli, 2014).
926 927
AC C
917
Other integrated metrics that are directly related to MCPs production, distribution, use, EoU and EoL management, include the:
33
ACCEPTED MANUSCRIPT •
Environmentally weighted Material Consumption (EMC);
929
•
Environmental Impact Recoverability Indicator (EIRI);
930
•
Cleaner treatment index;
931
•
Material input per service unit (MIPS);
932
•
Material recovery indicator (MRI);
933
•
Energy recovery indicator (ERI);
934
•
MSW management self-sufficiency indicator (wsx);
935
•
Net recovery index; and
936
•
Transport intensity index.
RI PT
928
A description of these metrics can be found in Section S3 of Supplementary Material. The last five
938
metrics have so far only been used to assess waste management performance at a regional or country
939
level, and have largely to do with demographics, collection and management practices used for
940
specific waste streams, e.g. MSW, construction and demolition waste (CDW), or SRF. It must be
941
emphasised that the use of integrated metrics must come with some caution, especially when taking
942
the specific strengths and limitations of this type of metrics into account. For instance, the significant
943
differences in the resource requirements of a variety of components and products, and the way these
944
are produced, distributed, used, disposed and recovered at their EoU and EoL stage needs to be kept
945
in mind. This often makes integrated metrics less versatile and useful in making comparisons across
946
products, industries or processes. To deal with this the Product Environmental Footprint (PEF) and
947
the Organisation Environmental Footprint (OEF) have been established by the European Commission
948
(European Commission, 2013), to measure the environmental performance of products, services, and
949
organizations (e.g. from extraction of raw materials, through production and use, to final waste
950
management) based on a LCA-based multi-criteria measure (Finkbeiner, 2014; Lehmann et al., 2015;
951
Manfredi et al., 2012). However, due to “applicability of the data quality assessment scheme, the
952
suitability of the provided allocation approach for recycling, and weighting or the identification of
953
appropriate measures to communicate PEF/OEF results [..]” the use of PEF/OEF is currently unclear
954
(Lehmann et al., 2015) In addition, benchmarks and performance classes that enable comparisons
955
between products are not yet clearly defined practically, nor theoretically, and as such the use of
956
PEF/OEF has not been fully established (Lehmann et al., 2015).
AC C
EP
TE D
M AN U
SC
937
957
Nonetheless, the process of detecting all factors of a composite metric and analysing their
958
respective demands has heuristic value, judging from the hundreds of projects replicating this
959
approach worldwide (Schwarz et al., 2002). Essentially, one could see integrated metrics already as a
960
formalised evaluation method, especially when these metrics are used to rank RRfW options in terms
961
of environmental impact or overall net benefit.
962
34
ACCEPTED MANUSCRIPT 963
4
Economic metrics The consideration of the economic performance of a RRfW system is critical not only for ensuring
965
its financial viability, but also for fulfilling wider economic objectives at local, regional or national
966
levels such as the provision of employment or contribution to sustainable prosperity (Jackson, 2016).
967
Economic impacts have to be considered alongside environmental, social and technical aspects in
968
order to ensure the overall viability of any proposed resource recovery strategy or intervention, and to
969
justify the decisions made to support them via investments, subsidies and taxation.
RI PT
964
Cost-benefit analysis (CBA) that collapses all costs and benefits into monetary terms, is a well-
971
known tool for assessing positive and negative impacts of RRfW projects in monetary terms (Begum
972
et al., 2006; da Cruz et al., 2014; Djukic et al., 2016; Finnveden et al., 2005; Varouchakis et al., 2016;
973
Wang et al., 2016). Proponents of CBA argue that this procedure provides transparent, clear and
974
systematic assessment, whereas critics say that this can create false comparability due to:
975
methodological bias towards recognising only that which can be monetised; (often) inconsistent
976
results (Pickin, 2008); ethically questionable monetisation of human life (Ackerman and Heinzerling,
977
2002); and of life-sustaining ecosystem services (Gómez-Baggethun and Ruiz-Pérez, 2011). Others
978
point to some principle conceptual incompatibilities of CBA and sustainability (Anderson et al.,
979
2015). In conclusion it seems that the core result of any CBA, the net present value (NPV), is not very
980
suitable for complex value assessment of RRfW systems.
M AN U
SC
970
CBA in the waste management literature largely falls into two categories: those which try to
982
capture ‘externalities’ and those which do not; externalities being ‘the effect(s) of production or
983
consumption of goods and services imposes costs or benefits on others which are not reflected in the
984
prices charged for the goods and services being provided’ (OECD, 2003). Cost-benefit studies
985
dealing mainly with prices, which are reflected in market transactions, can be found throughout the
986
waste management literature (Farel et al., 2013; Keeler and Renkow, 1994; Leu and H. Lin, 1998).
987
More recent studies have endeavoured to price externalities (Dijkgraaf and Vollebergh, 2004; Yuan et
988
al., 2011). CBA without regard to externalities can map to purely commercial or financial analysis (an
989
analysis of cost and benefits from the perspective of one private commercial entity), whereas CBA
990
taking fully into account externalities involves taking the perspective of society as a whole (the
991
original intent of CBA as developed for Government), albeit subject to the criticisms of CBA listed
992
above.
AC C
EP
TE D
981
993
Despite ignoring externalities, even determining the financial or ‘internal’ costs and benefits of
994
waste management options is a complex process. The financial costs and benefits of a RRfW system
995
in a given area may include regulatory tax, investment, capital and operational costs related to waste
996
management practices (e.g. collection, transportation, processing), and revenues created from the sale
35
ACCEPTED MANUSCRIPT 997
of secondary resources. For recovered MCPs to be viable from a business perspective, there must be a
998
demand for them in the market place, and their price must be competitive with the price of the
999
primary (raw) materials in order to enable their absorption. This may need to be achieved via
1000
subsidies, as is common with energy generation systems; or via environmental taxation (in which case
1001
the justification requires the relevant externalities to be included in the CBA). Additional aspects
1002
related to the operational economic viability of resource recovery systems are: •
the ability to acquire feedstock at their full capacity (Choy et al., 2004; Kothari et al., 2010), as well as the availability of existing waste infrastructure to meet capacity demands (Najm et al., 2002; Ristimäki et al., 2013);
1006 1007 1008
•
the strategic location of recovery facilities that can render the recovery of resources economically viable (Chong et al., 2016; Ghose et al., 2006; Najm et al., 2002; Tavares et al., 2009; Wu et al., 2002); and
1009
•
the longevity of assets, land and building (Longden et al., 2007; Ristimäki et al., 2013).
SC
RI PT
1003 1004 1005
Measures that can be taken to improve the economic viability of RRfW include technical
1011
innovation and optimal configuration avenues (Chong et al., 2016). These can improve the quality of
1012
secondary
1013
remanufacturing/reprocessing industry and in creating the space for higher demand (Iacovidou and
1014
Velenturf, 2016); leading to expanding and upgrading process operations that can take in advantage
1015
the amount of secondary materials available. Until now, metrics capturing those aspects are rarely
1016
used or proposed in RRfW system assessments (Table 4).
MCPs
recovered,
which
M AN U
1010
is
critical
in
building
confidence
in
the
The need for long-run economic, social and environmental externalities to be included in CBA is
1018
an aspiration across infrastructure assessment; an aspiration that has been the norm in transport
1019
scheme assessment for some time, albeit the fact that difficulties of such incorporation remain
1020
formidable (Hanley and Spash, 1993; MacKie, 2010). However a recent review found very few
1021
international examples of socially and environmentally extended CBA in the resource recovery sector
1022
that attempt to cost externalities for which there is not already a secondary market (Allesch and
1023
Brunner, 2014). The externalities that can be included in CBA of RRfW systems are varied, but fall
1024
into the following categories; direct health impacts, local and global pollutants (see Section 3),
1025
ecosystem services, and local economic impacts. Reporting each measure in monetary terms requires
1026
a related valuation methodology. There is substantial debate over the selection and refinement of
1027
monetisation methods across ecological and environmental economics (Gómez-Baggethun and Ruiz-
1028
Pérez, 2011). Importantly, whether the externalities associated with resource recovery projects are
1029
assigned to the category of ‘economic metric’ depends on whether or not an attempt at monetisation
1030
has been made. For instance, metrics in health, environmental quality or climate stability can be
1031
assigned to various domains of value.
AC C
EP
TE D
1017
36
ACCEPTED MANUSCRIPT 1032
In Table 4 metrics used in different valuation methods are included with example studies which
1033
have deployed these approaches for resource recovery or infrastructure related projects (Chong et al.,
1034
2016; Davis et al., 2005; den Boer et al., 2007; Ferrão et al., 2014; Hofstetter and Müller-Wenk, 2005;
1035
Quiggin, 1997; Rodrigues et al., 2016; Strobant, 2015; WBCSD, 2000; Weinstein, 2006).
1036
RI PT
Table 4 Key economic metrics used in RRfW assessment methodologies. Metric
Description
Unit
Cost of raw materials and intermediates
Sum of costs of material input per unit output (MCP).
% (£ on £)
Net sales
Sum of recorded sales minus the sales discounts and sales returns and allowances per unit output (MCP).
£/t
Net profit/loss
Estimated based on Net sales minus all expenses for the period including:
WBCSD, 2000
SC
TE D
cost of goods sold; general and administrative expenses; technology expenses; R&D costs; amortization and adjustment of intangible assets; • restructuring and special charges; • interest expenses; • other expenses; • income tax. The difference between the present value of cash inflows (and the positive monetary value of externalities) and the present value of cash outflows (and the negative monetary value of externalities).
EP
Capital cost
WBCSD, 2000; Chong et al. 2016; IChemE 2001
£
WBCSD, 2000; Chong et al. 2016
£
Weinstein, 2006; Strobant, 2015
£
Chong et al. 2016
M AN U
• • • • •
Net present value (NPV)
or £/t
References
Sum of costs including:
AC C
1037
• • • • •
planning costs - costs for planning activities, e.g. engineering design and environmental impact assessment; investment costs – costs for providing the infrastructure or services, e.g. bins land costs - land acquisition and site footprints; equipment purchase - cost of equipment needed in the different waste treatment facilities; setup - site development and equipment installation costs, e.g. 37
ACCEPTED MANUSCRIPT
Utilities costs
£
Chong et al. 2016
SC
depreciation of installations, based on expected lifespan (using manufacturing data); • running and extraordinary repairs, and inspection costs - may be calculated as percentage of equipment cost; • unit cost of working hour requirement e.g. in operation, supervision, training; • insurance costs calculated as a percentage of fixed capital cost; • unit cost of working hour requirement e.g. in operation, supervision, training; • transportation cost. Energy costs: sum of the cost of energy consumed per unit output
RI PT
•
M AN U
Operational & maintenance cost
civil work, access roads, electrical distribution network, piping and assembly work. Sum of costs including:
£/t
Davis et al. 2005; Chong et al. 2016
£
Chong et al. 2016
£
Chong et al. 2016;
Non-energy costs: sum of the cost of: • •
TE D
•
electricity generated from the treatment of waste; • gas generated from the treatment of waste; • earth conditioner produced in waste composting facilities; • heat captured from energy from waste activities (can also be used on onsite applications (e.g. in dehumidification and heating); • secondary resources such as paper and cardboard, glass, metals and plastic. Sum of the tax based on
AC C
EP
Revenue from secondary resource sale
domestic water and sewer service; collection of residuals, and/or landfilling or transport elsewhere. Sum of the cash inflow made from the sale of:
Taxation
• • • •
national/ local tax rate (e.g. on profit); energy sales tax (electricity and biofuel); landfill tax; carbon tax.
38
ACCEPTED MANUSCRIPT
Health costs
Sum of the amount received e.g. for the:
Chong et al. 2016; den Boer et al. 2007
£
(Hofstetter and Müller-Wenk, 2005)
•
planning and operating new and existing facilities; • generating and/ or using renewable energy; carbon credit offset; • renewable energy tax credits; • other price support. Measured by various methods, including hedonic pricing, contingent valuation. Measured by various methods, including contingent valuation, willingness to pay.
£
Economic spillover effects
Measured by various methods, including £ or jobs Hedonic Pricing, GVA uplift calculation, Input Output modelling, or net jobs additions.
EA, 2009
Ferrao et al. 2014; Rodrigues et al. 2016
SC
Ecosystem services
M AN U
1038 1039 1040
£
RI PT
Subsidy and incentives
5 Social metrics
Materials, components and products (MCPs) may have been largely linked with environmental and
1042
economic impacts, but in reality their impacts are far-reaching, affecting all levels of the society, not
1043
only within the physical scope of their manufacturing processes and the impacts thereof, but over the
1044
entire lifecycle of components and products distributed into the supply chain (UNEP and SETAC,
1045
2009). These impacts are often a result of the social interactions and relationships created in the
1046
context of resource extraction, processing, manufacturing, assembly, marketing, sale, use, recycling,
1047
and disposal, amongst others, as well as between the key stakeholder groups involved in the lifecycle
1048
of MCPs (e.g. workers, employees, consumers, local communities, waste managers, policy makers,
1049
value chain actors) (UNEP and SETAC, 2009). This, as suggested by UNEP and SETAC (2009),
1050
indicates that social impacts of the lifecycle of MCPs are a result of three basic aspects, presented in
1051
Figure 2.
EP
AC C
1052
TE D
1041
39
SC
RI PT
ACCEPTED MANUSCRIPT
M AN U
1053 1054 1055
Figure 2 Elements that affect social impacts associated with the lifecycle of MCPs. Adapted from:
1056
UNEP and SETAC (2009).
1057
The elements shown in Figure 2 are also interlinked, which means that the roots of social impacts
1059
can be more complex than it seems, as often socioeconomic processes can affect behaviours, and
1060
behaviours (and decisions made by individuals or groups at sectoral level) can affect socioeconomic
1061
processes and alter the cultural and human capital (UNEP and SETAC, 2009). For example, “pressure
1062
for low prices (socioeconomic processes) may draw suppliers to allow illegal child labour
1063
(behaviour), a practice that may be accepted in a given society because of systemic poverty (capital)”
1064
(UNEP and SETAC, 2009).
EP
TE D
1058
The study of these interrelationships is necessary in order to get some clarity on the way social
1066
impacts are created and evolved based on the geographic locations, the impact of processes carried
1067
out (mines, factories, roads, rails, harbours, shops, offices, recycling-firms, disposal-sites), and the
1068
shared, separate or conflicting interests of all stakeholders involved in the supply chain, and how these
1069
impact the environment and economic landscape. To that end, it is recommended to start the
1070
assessment of social impacts with the identification and analysis of stakeholders (UNEP and SETAC,
1071
2009; Zurbrügg et al., 2014).
AC C
1065
1072
Based on the individual behaviour sphere (Figure 2), it becomes clear that the acceptance and
1073
participation of citizens or professionals to processes and measures that aim at RRfW at source, is
40
ACCEPTED MANUSCRIPT critical in creating of positive human, social and cultural capital, but also in enabling socioeconomic
1075
decision-making (Chong et al., 2016). This is owing to the fact that acceptance of a resource recovery
1076
practice can in essence lead to its successful implementation and thus, to changes in social-cultural
1077
considerations (Balkema et al., 2002). Social participation can be invigorated by education and
1078
awareness campaigns, which on turn can enable behaviour and mind-set change into realising the
1079
benefits participation can bring in the community, but can also be supported and enforced by
1080
legislation. For example, in Japan the ‘Food Recycling Law’ requires food waste emitters to report the
1081
amount of food waste recycled, whereas in the US the ‘Good Samaritan Law’ redistributes food that
1082
would otherwise be wasted into other uses, such as for charity or food banks (Chong et al., 2016;
1083
Zurbrügg et al., 2014). In both cases, acceptance can be largely driven by the social and cultural
1084
perception around the positive impact of resource recovery processes and facilities in the community.
1085
If they are perceived to promote climate change mitigation, and address local deficiencies or
1086
inefficiencies, including employment, energy and fertiliser, these are highly accepted by the
1087
community (especially in rural areas where jobs and energy supply are of greater concern) further
1088
enhancing socio-economic processes and improving the human, social and cultural capital (Achillas et
1089
al., 2011; Chong et al., 2016).
M AN U
SC
RI PT
1074
In fact, community-owned projects, for example run by community-based organisations (CBOs)
1091
or associations and cooperatives, have been stated as promoting deeper social involvement and
1092
increasing the success rate of resource recovery projects (Chong et al., 2016). In urban environments,
1093
where community cohesion may be lacking, educational and information dissemination programmes
1094
can aid the acceptance of resource recovery technologies and processes (Achillas et al., 2011). Taking
1095
reference from past studies, other types of social factors that affect the sustainability of RRfW
1096
systems is the interaction between stakeholders and social capital (Zurbrügg et al., 2014). These
1097
interactions might affect the fair distribution of RRfW system benefits and impacts between citizens,
1098
affecting as such the acceptability of facilities planning and setup, and the collection and recovery
1099
systems used. In order to gain positive results, participation rate in the implemented schemes needs to
1100
be high, as well as their participation in the community decision-making processes that govern the
1101
measures taken and imposed to the community. Collaboration, gender equity, employment,
1102
motivation, interest, and influence (power) are other important attributes that must be taken into
1103
account when assessing social impacts related to resource recovery systems (Zurbrügg et al., 2014).
AC C
EP
TE D
1090
1104
The importance of socioeconomic considerations becomes even more crucial in the case of the
1105
low-income counties, where the RRfW systems are mainly operated in the informal recycling sector
1106
(IRS), typically by marginalised urban poor (waste pickers) (Velis et al., 2012; Wilson et al., 2015)
1107
where such activities constitute their main source of livelihood. Systems analysis tools that assess the
1108
waste and resources management at city level, such as the ‘Wasteaware’ benchmarking marking
41
ACCEPTED MANUSCRIPT 1109
indicators (Wilson et al., 2015), and those that provide guidance on how to socially include and
1110
integrate the informal waste pickers into formalised legitimate operations (‘InteRa’) (Velis et al.,
1111
2012; Wilson et al., 2015), already explicitly include and try to quantify socioeconomic dimensions. The recently developed social LCA (sLCA) sets out key social phenomena relevant to the
1113
assessment of positive and negative social impacts of a MCP over its lifecycle (for example, on
1114
human rights, working conditions, and health and safety) and/or its EoU and EoL management
1115
(Hellweg and Milà i Canals, 2014; Klöpffer, 2003). Public health and safety are important factors
1116
within the society, with a close link to the economy and environment. In regards to the workforce
1117
necessary per each unit of MCP produced, collected, recovered and/or reprocessed there is a need to
1118
account for the working hours, the wage, as well as the employment conditions (Table 5) (Gregson
1119
and Crang, 2015). The worker-hours needed in each process associated with the MCPs lifecycle is
1120
useful in understanding where data needs to be collected on-site, and where generic information might
1121
be sufficient to support the analysis of the added value offered by the workforce. However, working
1122
hours alone, cannot provide insightful views on the potential social impacts arising from worker-
1123
hours put into each process of the supply chain. The specific context in which the work is undertaken,
1124
as well as the country and condition of the facility where the work is carried out, might provide more
1125
input in relation to wage rates, unpaid labour, child labour, forced labour and informal work
1126
conditions (UNEP and SETAC, 2009). Incidents at work that are used to reflect the health and safety
1127
metrics can be accounted based on the number of people in the working environment usually using
1128
100,000 people as a reference (Table 5) (Cameron et al., 2008; HSE, 2016).
TE D
M AN U
SC
RI PT
1112
Child labour in several parts of the supply chain (e.g. in agriculture, mining, manufacturing,
1130
construction, waste picking (IRS), and processing) constitutes an important metric in RRfW systems
1131
assessment, because it can radically change the value of the recovered resources. There are many
1132
forms of child labour worldwide including forced labour and debt bondage (to pay off debts incurred
1133
by parents and grandparents), among others (UN, 2016; Wu et al., 2014). Child labour, which tends to
1134
be more pronounced in the informal sector can be dangerous and harmful, morally reprehensible, and
1135
can violate the child’s freedom and human rights (UN, 2016; UNICEF, 2005). For resource recovery
1136
to be appropriately valued it must be decoupled from unethical processes of recovery that are based
1137
on child labour.
AC C
EP
1129
1138
When a public decisions is made on the location of a waste management facility the so-called
1139
NIMBY (not in my backyard) syndrome can be of concern (Table 5). NIMBY reflects the propensity of
1140
local citizens and officials to obstruct action regarding the siting of necessary but unwanted waste
1141
facilities and other locally unwanted land uses (LULUs) in their own community (Kikuchi and
1142
Gerardo, 2009). This syndrome is largely an effect of community perceptions on resource recovery
1143
and disposal facilities, which is a result of the perception of the visual impact, noise, hygiene, safety, 42
ACCEPTED MANUSCRIPT 1144
handling, transport and land space requirements of such facilities, on which most people are opposed
1145
to (den Boer et al., 2007; Kikuchi and Gerardo, 2009; Morrissey and Browne, 2004). Education and
1146
awareness raising campaigns could alter this opposition, and provide a better community cohesion
1147
when it comes to implementing strategies for resource recovery improving as such the human and
1148
cultural capital (Chong et al., 2016). Odour and insects problems created by inappropriate resource extraction (e.g. mine tailing
1150
polluting ecosystems), disposal and collection (e.g. collection regime followed and types of
1151
collection) as well as noise pollution are additional metrics that can be taken into account in assessing
1152
RRfW systems (den Boer et al., 2007). The disposal method used, as well as the proximity of a
1153
treatment facility to a community, can be an important factor contributing to the augmentation of
1154
odour and noise pollution impacts (Table 5) (CECED, 2003). Hygiene aspects associated with
1155
resource recovery options are decisive to their successful implementation (Defra, 2007), as well as is
1156
the annoyance caused by unpleasant odours or noise during the implementation thereof (Bottero et al.,
1157
2011).
M AN U
SC
RI PT
1149
The literature signifies the infancy of assessing the social impact of RRfW systems also by listing
1159
social and societal dynamics, phenomena or criteria to be taken into account in social impact
1160
assessment and decision support rather than proposing concrete and tested metrics and methods of
1161
measurement. Table 5 follows this state-of-the-art and presents either a proposed metric or a social
1162
criterion for the assessment. The unit of measurement is sometimes “unspecified”. Generally,
1163
quantified metrics are desirable, but the social reality is often not as “countable” as the environmental,
1164
technical and economic aspects, and therefore also semi-quantitative and qualitative metrics are to be
1165
considered for the assessment of social aspects.
TE D
1158
A further hint that social aspects of RRfW are to be further researched and expanded is that the
1167
emerging concerns and metrics of subjective well-being and quality of live approaches and their more
1168
objective drivers have not been taken up (Bache, 2015; Stiglitz et al., 2009).
1170
AC C
1169
EP
1166
Table 5 Key social metrics used in RRfW assessment methodologies. Criterion/ Metric
Description
Unit
References
Acceptability
Acceptability of product utility and social acceptability of components and products, use, disposal and collection needs to be further researched.
Unspecified (potentially semi-quantified or qualitative)
Chong et al. 2016; Balkema et al. 2002; UNEP and SETAC 2009
Participation rate (in RRfW)
Level of involvement/participation in resource recovery, distribution, use,
%
Chong et al. 2016; Balkema
43
ACCEPTED MANUSCRIPT separation and collection; householders ׳and professionals willingness to separate waste at source.
et al. 2002; UNEP and SETAC 2009
Level of involvement of local (and regional) residents in the RRfW project: from attending town hall meetings to community-led projects.
Various
Chong et al., 2016
Social function and equity
Equitable distribution of system’s benefits and impacts within a community and social function provided by the RRfW system (including a range of social aspects such as time requirement, convenience, prestige, gender, vulnerable groups).
Unspecified
Chong et al. 2016; UNEP and SETAC 2009; den Boer et al. 2007; Zurbrugg et al. 2014
Child labour
Employment of children, esp. when in a dangerous or unsuitable environment for them in the RRfW system which depends on the child’s age, the type and hours of work performed and the conditions under which it is performed.
RI PT
Participation (in decision making)
SC
(potentially semi-quantified or qualitative)
Unspecified
M AN U
(potentially semi-quantified or qualitative)
UN 2016; Wu et al. 2014
Measured based on the number of working hours in the RRfW system.
hours
UNEP and SETAC 2011; Wu et al. 2014
Working hourly wage
Measured based on the number of working hours in the RRfW system by taking into account, e.g. the living wage in the country, minimum wage in the country, and average wage in the sector.
% (paid wage/ minimum or liveable wage)
UNEP and SETAC 2009
Health and safety (of workers)
Safety: Measured based on the number of reportable injuries by the average number of people employed per year.
Number of HSE 2016; accidents at Cameron et al. work per 2008 100,000 workers
EP
TE D
Working hours
AC C
Health: Measured by the days sick leave by the average number of people employed per year (also in comparison with national/regional average across sectors).
System safety
NIMBY syndrome
As perceived by the neighbours as regards e.g. risk of accidents or malfunctions with increased release of (toxic) emissions and subsequent impacts on health.
Days sick leave per worker
Unspecificed (potentially semi-quantified or qualitative)
Opposition by residents in proximity to % (on local a RRfW facility, measured based on residents) the fraction of citizens in support and
Chong et al. 2016
Kikuchi and Gerardo 2009
44
ACCEPTED MANUSCRIPT against the siting of a new facility nearby (while in principle accepting the technology or need for RRfW). Job creation
Number of jobs created from the resource recovery and management.
No. of jobs or FTE
UNEP 2010
Employment quality
Working and employment conditions.
Unspecified
den Boer et al. 2007; Gregson and Crang 2015
Local deficiencies
Addressing local requirements for resources (e.g. fertiliser) or energy (e.g. district heating).
Various
Chong et al., 2016
Noise pollution
Noise generated during each stage of the resource recovery process.
Number of people exposed to unhealthy noise levels (day/ night)
den Boer et al. 2007
Odour
Unpleasant odours caused by the degradation of materials (e.g. food waste, biomass) during resource recovery and management processes.
Number of people exposed to odours
den Boer et al. 2007
SC
M AN U
1171 6 Technical metrics
TE D
1172
RI PT
(potentially semi-quantified or qualitative)
Materials, components and products (MCPs) are used because of the technical properties they
1174
possess: steel is strong; PP films can be food-safe, lightweight and airtight; copper is conductive and
1175
malleable; light bulbs produce light, etc. The maintenance and retention of these properties extends
1176
the lifecycle of the components/products; whereas the degradation of these properties by aging, use,
1177
contamination, or the changes in the service for which MCPs are purposed for, may determine
1178
whether it has reached its EoU or EoL status. Even so, materials contained within
1179
components/products that reached their EoL, can still independently maintain their full or
1180
considerable part of their potential value as technical engineered materials (metals, paper, plastics).
1181
As such, technical metrics related to the MCPs lifecycle are prerequisites in conveying valuable
1182
information about how the physical and functional properties – and, as a consequence – the value of
1183
MCPs changes across the RRfW system (Tanzil and Beloff, 2006).
AC C
EP
1173
1184
There is a variety of metrics associated with material, components and products that range from
1185
those used in the manufacturing/engineering sectors (e.g. product yield, productivity, throughput.; but
1186
also size, Young's modulus, melting point, load capacity, fracture resistance, density, toughness,
1187
modular design, corrosion resistance properties) (Wernick and Ausubel, 1995), to those used in green
45
ACCEPTED MANUSCRIPT chemistry (e.g. atom economy, E-factor, effective mass yield) (Constable et al., 2002; Henderson et
1189
al., 2010) of which detailed description can be found elsewhere (Askeland and Phulé, 2003; Constable
1190
et al., 2002; Henderson et al., 2010). Even more interestingly, there can be multiple pathways to
1191
recover value starting from the same (engineered) used material. For example, paper can be re-pulped
1192
to produce new paper (if of suitable quality) and remain in the technosphere; it can incorporated to a
1193
degree in composting, returning some organic matter back to the biosphere; or it can be combusted in
1194
EfW, as a final sink, to produce energy and heat. In each of these resource recovery operations, a
1195
different set of technical metrics is relevant and applicable.
RI PT
1188
When components and products reach their EoU stage, they may still contain significant technical
1197
value that can be captured; hence, decisions made at this stage are important and may be affected by
1198
many factors (i.e. engineering, business, environmental, and societal factors) (Ziout et al., 2014).
1199
Accordingly, component/product recovery has come into increasing prominence in the industry and
1200
estimating the residual value of MCPs at their EoU and EoL stage is an essential prerequisite of
1201
promoting the reusability (Robotis et al., 2012), remanufacturability (Fang et al., 2015a; Hatcher et
1202
al., 2011, 2013), recyclability and recoverability potential. For clarification, EoU stage is usually
1203
followed by a quality control stage, at which reusability leads to a second or n-th cycle of a MCP’s
1204
service life (Iacovidou et al., 2017b), whereas EoL stage means that the component/product can no
1205
longer be used and thus, remanufacturability, recyclability and energy recoverability are the optimal
1206
routes, as shown in Figure 3. Component/ product features and characteristics may govern the
1207
selection and feasibility of the above practices, and therefore have an effect upon the profitability of
1208
these strategies, and the environmental and social aspects associated with them.
M AN U
TE D
EP AC C
1209
SC
1196
46
M AN U
SC
RI PT
ACCEPTED MANUSCRIPT
1210 1211
Figure 3 The interconnection between upstream and downstream MCPs cycles in promoting their
1212
recovery after their EoU and EoL stages. Adapted from: Iacovidou et al. (2017).
TE D
1213
The reusability or reuse potential refers to the ability of a component or product to retain its
1215
functionality after the end of its primary life (i.e. EoU stage) (Iacovidou and Purnell, 2016). To
1216
‘measure’ the reusability of a component/product, static information on the physical and engineered
1217
characteristics (e.g. designed lifetime, usage period, etc.) and the way components and products are
1218
made and/or fixed together, needs to be available (Table 6). In addition to that, dynamic information
1219
that governs the transformation of their functional/physical characteristics during their use, must also
1220
be made available in order to generate the knowledge required for determining the durability of
1221
component/product over a specific service and ability to continue providing this service after their
1222
primary EoU stage (Iacovidou et al., 2017b). These characteristics may vary depending on cultural,
1223
historical and organisational aspects (Iacovidou and Purnell, 2016), and therefore, this metric should
1224
be used with care when assessing the reusability of components/products in specific RRfW systems.
1225
Moreover, the selection of technology and/or process available for the application and/or recovery of
1226
the component/product are also important in promoting and retaining their reusability (Park and
1227
Chertow, 2014). For example, the reusability for bricks can be somewhere between 50% and 95%
1228
contingent on the time allowed for dismantling, the care taken and the materials used for binding (e.g.
1229
cement based mortar vs. lime based mortar) (Leal et al., 2006; WRAP, 2008a, b).
AC C
EP
1214
47
ACCEPTED MANUSCRIPT Remanufacturability complements reuse in that it promotes the restoration of durable used
1231
products back in the manufacturing process with low investment cots (Gutowski et al., 2011; Hatcher
1232
et al., 2011; Ijomah et al., 2007; Ramoni and Zhang, 2012). This process involves the complete
1233
disassembly of a product, during which each component is cleaned, inspected for damage, sorted,
1234
reconditioned and/or reprocessed to its original equipment manufacturer specifications (if feasible)
1235
and reassembled – often together with new parts – into a new product that can offer functionality as
1236
good as, or better than, that of a brand new product (Asif et al., 2012; Hatcher et al., 2011; Ismail et
1237
al., 2014). This series of industrial processes, i.e. disassembly, cleaning, inspection and sorting, part
1238
repair/ refurbishment/ replacement, reassembly and final testing represent key elements of
1239
remanufacturability metrics (Table 6) (Amezquita et al., 1995; Bras and Hammond, 1996a; Bras and
1240
Hammond, 1996b); methods proposed for measuring each one of these can be found elsewhere
1241
(Amezquita et al., 1995; Bras and Hammond, 1996a; Bras and Hammond, 1996b). This list of
1242
dimensions is in accordance with those suggested by Fang et al. (2015), which include fastener
1243
accessibility, disassembly complexity, disassemblability, and recoverability (Fang et al., 2015a). As
1244
recoverability constitutes a metric with a wider meaning herein, this element is not considered further
1245
in the context of remanufacturability alone. Nonetheless, it must be emphasised that for
1246
remanufacturing to be meaningful the product lifetime, rate of technical innovation, and failure rate
1247
of components have to also be taken into account as they all influence the return rate of products from
1248
EoU, towards their EoL stage (Östlin et al., 2009). At the same time the efficiency and effectiveness
1249
of the remanufacturing process depends largely on decisions made during the design process (Ijomah
1250
et al., 2007); hence, indicating the importance of linking upstream and downstream cycles of the
1251
production-consumption-disposal system, as shown in Figure 3.
TE D
M AN U
SC
RI PT
1230
It is widely speculated that remanufacturing, due to the avoided resource use, energy, and
1253
emissions associated with new component and product production, can offer greater economic and
1254
environmental savings than recycling (Gutowski et al., 2011; Hatcher et al., 2011; Lund and Mundial,
1255
1984; Ramoni and Zhang, 2012). This is because recycling may require additional labour, energy, and
1256
machinery, resulting in additional costs, energy and carbon emissions (Ramoni and Zhang, 2012).
1257
Nevertheless, recycling is the most widely known resource recovery process practiced worldwide,
1258
both in the formal and informal recycling sectors, reducing energy consumption, and GHG emissions
1259
and pollution when recycled materials are substituting primary feedstock and suitable pollution
1260
control is applied. As such ‘recyclability’ metrics are of great importance in RRfW systems.
AC C
EP
1252
1261
Hitherto, recyclability is also affected by the features and characteristics of MCPs, as well as on
1262
the existence of viable recycling processes and suitable technologies thereof. Factors such as, the
1263
number of different materials used in components and products fabrication (e.g. use of plastics of the
1264
same or compatible types increase recyclability), the way materials are fixed together (the degree of
48
ACCEPTED MANUSCRIPT liberation: e.g. welding metallic parts together with plastic parts might minimise its recyclability), the
1266
use of substances, laminated materials or compounds (e.g. paint, pigments and marks) that may lead
1267
to contamination (Cerdan et al., 2009), can largely affect how the recyclability of components and
1268
products is perceived. In that regards, attaining the right information from the upstream cycle of
1269
MCPs supply chain system (as shown in Figure 3) can prove beneficial in addressing these issues.
1270
For this purpose various metrics have been proposed for recyclability - indicatively: i) mass
1271
recyclability (e.g. amount of MCPs sorted for recycling on a weight basis); and ii) technical
1272
recyclability (e.g. maximum capture of value from recyclates via producing high quality recycled
1273
products) (Table 6) (Ardente and Mathieux, 2014).
RI PT
1265
To elaborate, concrete’s mass recyclability can be affected by its composition (mix design),
1275
strength, purity (based on the presence of pollutants found in paint and plaster), and form (e.g. cast-in-
1276
situ, pre-cast, or in unit materials such as blocks, tiles and stair units) (Iacovidou and Purnell, 2016).
1277
The technical recyclability of concrete however, can be affected by the use of paint, whereas paint is
1278
regarded as a remedial solution in rust problems associated with steel used in bridges (Horvath and
1279
Hendrickson, 1998), prolonging lifetime of steel without affecting as much its technical recyclability.
M AN U
SC
1274
In regard to the technical recyclability, the allocation of secondary materials in new MCPs
1281
production represents an important step in closing the material loops (Allacker et al., 2014). This
1282
allocation is largely affected by the quality of secondary materials, as well as their mass flow. As
1283
previously mentioned, features of the primary material produced, in addition to the waste management
1284
and recycling processes that compose a given RRfW system, may greatly influence the degradation of
1285
the quality of a material. Degradation of a material’s quality will determine whether the material is
1286
intended for ‘closed’ or ‘open-loop’ recycling. In the strict, narrow definition of closed-loop
1287
recycling, the recycled materials can replace their virgin counterparts for the original use within one
1288
(or n-th, depending on the type of material) lifecycle, given that their quality has remained high (i.e.
1289
no significant degradation has occurred). Similarly, in open-loop recycling the recycled material
1290
cannot replace the virgin material for the original use due to quality degradation after primary use.
1291
Notably, these terms may be used in a much wider way, with for example the mixing (via
1292
compatibilisers) of different packaging plastic polymers to a new polymer being also perceived as
1293
closed loop recycling, regardless of the fact that it is a form of ‘cascading’. Where quality degradation
1294
occurs then cascading of the recycled material to a different (lower) quality product may be the
1295
optimal option for recovering its value. This is often called a cascade recycling system, and is based
1296
on the sequential use of materials for the production of new MCPs (different from the original use), of
1297
which quality continues to be degraded over successive lifecycles, until its quality becomes too low to
1298
be used any further as a raw material in another life cycle system (Bartl, 2015; Kim et al., 1997).
1299
Detailed information around the cascading of materials/components can be found elsewhere (Bartl,
AC C
EP
TE D
1280
49
ACCEPTED MANUSCRIPT 1300
2015; Kim et al., 1997). Besides quality, the quantity of the recycled material is another factor that
1301
may affect its technical recyclability. If there is no economic value, the recycled material is no longer
1302
used and is diverted into other waste management options. Therefore, in a cascade recycling system,
1303
the quality or the economic aspect of the recycled material should be considered (Kim et al., 1997). In all cases, ‘quality’ would be defined relatively, deepening on fit for purpose for the intended
1305
new use, and critically affected by the fundamental feature of waste, that of heterogeneity at different
1306
scales (spatial, material, temporal), as for example is defined in the theory of sampling (TOS)
1307
(Esbensen and Wagner, 2014a; Esbensen and Wagner, 2014b). Regarding spatial variability, the
1308
degree
1309
components/products, should also be a critical factor of any theoretical and/or operational definition
1310
of recyclability. However, such aspects are seldom considered by the current definitions, at least
1311
directly: there is still need to resort to fundamental concepts and invent new, strictly defined metrics
1312
capturing critical aspects of what recyclability could mean. And the same applies to recoverability.
concentration
of
resources
(or
reversely
dispersion)
over
geographies
and
M AN U
SC
of
RI PT
1304
Recoverability is a metric with a wider meaning as it can refer to physical (mass) recoverability,
1314
called here as mass recoverability (e.g. means the potential for recovery of components, parts of
1315
products or materials at their EoU stage) (as adapted from guidance on the type-approval of motor
1316
vehicles with regard to their reusability, recyclability and recoverability based on European Directive
1317
2005/64/EC (European Union, 2005)) (Table 6); and the recoverability based on energy and named
1318
here as energy recoverability (e.g. the energy embodied in the component/product's parts that is
1319
recovered though EfW plants in the form of electricity and heat) (Table 6) (Ardente and Mathieux,
1320
2014). Mathieux et al. (2008, 2001) in their studies have defined recoverability as the ability of the
1321
component, product (or its components) and the constitutive materials to be captured, and which may
1322
evolve during the component/product’s lifecycle, as the available technologies and materials change
1323
with time (Mathieux et al., 2001; Mathieux et al., 2008). They assessed recoverability based on the
1324
use of the technical recovery indicator (TRI), which for consistency was named here as technical
1325
recoverability of components and products, that expresses the component and/or product weight share
1326
that is captured for reuse, remanufacture, recycling or energy recovery (Fang et al., 2015a; Mathieux
1327
et al., 2001). Technical recoverability of components and products can be assessed based on the 11
1328
eco-design principles suggested in the study of Cerdan et al. (2009) which include, reusable parts,
1329
recyclable materials, reversible joints, same material joints, parts with label, tools for disassembling,
1330
time for disassembly, intelligent material, time for battery changing, laminated or compound materials
1331
and painted, stained or pigmented surfaces (Table 6) (Cerdan et al., 2009).
AC C
EP
TE D
1313
1332
In general, technical metrics are highly controlled by a specific MCP and its features, whereas the
1333
availability of appropriate technologies for its recovery can be a prevailing factor of the
1334
implementation of best practice. As such, technology advancement can be a metric that captures both 50
ACCEPTED MANUSCRIPT the technological advances in MCPs design (MCP based), and of the technologies used at industrial
1336
level (process based) (Table 6). The process based technological advancement metric refers to the
1337
capacity of existing technologies used in a facility to provide maximum efficiency when it comes to
1338
the recovery and processing of resources (Ijomah et al., 2007). For example, less environmentally
1339
sound technology in manufacturing facilities can have a negative impact on the remanufacturability
1340
output, as well as on the environmental and logistic aspects associated with it; whereas the efficiency
1341
of screen sorting and eddy current in removing paper and cardboard, and aluminium materials
1342
respectively in combination with the efficiency of NIR technologies to sort plastics affect their mass
1343
recyclability in the material recovery facilities (MRFs). However, at the MCP level, technology
1344
advancement should in theory progress alongside MCPs redesign and development, so that when new
1345
MCPs become available, their reusability, remanufacturability, recyclability and recoverability
1346
potential remains plausible (Ijomah et al., 2007). For example, because of rapid software and
1347
hardware innovation, mobile phones are often so outdated by their EoU stage, that their reusability (if
1348
possible) could be meaningless in certain socioeconomic contexts. Table 6 lists key generic technical
1349
metrics in assessing the value of recovery of resources, as reported in the literature.
1350
Table 6 Key technical metrics used in RRfW management assessment methodologies. Description
Unit
References
Reusability
Amount of MCPs that may retain their functionality and physical attributes after the end of their primary life.
t (or item) per t (or item) input into the system
Ardente and Mathieux, 2014
Remanufacturability
Potential to restore a component/ product to like-new condition through measuring, disassembly, cleaning, inspection and sorting, part repair/ refurbishment/ replacement, reassembly and final testing.
% wt.
Bras and Hammond 1996, Amezquita, Hammond, Salazar and Bras 1995
Mass recyclability
Amount of MCPs collected and/ or sorted for recycling on a weight basis.
t/t input into the system
Ardente and Mathieux, 2014
Technical recyclability
Proportion of the material, or component made of only one material collected for recycling that will be recycled for producing high quality recycled MCPs.
% wt.
Ardente and Mathieux, 2014; Cerdan et al. 2009
Mass recoverability
Amount of MCPs, and/ or proportion of the material in the component/ product that is captured after the EoU stage.
t or % wt.
Adapted term based on Council Directive 2005/64/EC
EP
TE D
Metric
AC C
1351
M AN U
SC
RI PT
1335
51
ACCEPTED MANUSCRIPT Energy embodied in the materials, components (made of only one material), and component’s and product's parts recovered by the EfW plants in the form of electricity and heat.
kWh/t input
Ardente and Mathieux, 2014
Lower heating value (LHV) or net calorific value
Amount of heat released by combusting a specified quantity of MCPs (initially at 25°C) and returning the temperature of the combustion products to 150°C, which assumes the latent heat of vaporization of water in the reaction products is not recovered.
J/kg
Allacker et al. 2014
Technical recoverability of components and products
Components (made of more than one material) and products only. Assessed based on the component’s and product’s weight share that can be extracted for reuse, recycling, energy recovery and disposal, using the eco-design principles.
% wt.
Technological advancement
Process based: Advances in technology Unspecified that improve the efficiency of (potentially technologies used in the processing steps quantified or of the RRfW system. semiMCP based: advances in the designed quantified) characteristics of existing and/ or new MCPs.
1353
7 Discussion
SC
M AN U
Mathieux et al. 2008; Cerdan et al. 2009
Ijomahet al. 2007
TE D
1352
RI PT
Energy recoverability
The study highlights that there are many frameworks, methods and tools suitable for assessing
1355
RRfW systems. Notwithstanding the potential for most of them to support decision-making processes
1356
in RRfW systems, a number of shortcomings (e.g. lack of transparency, large number of assumptions,
1357
consideration of only one process or sub-system of the supply chain system) limit their potential for
1358
adopting a whole systems approach. This is because most of these frameworks, methods and tools
1359
concentrate on a single domain of value, usually environmental or economic, neglecting to account
1360
for value (impacts or benefits) in other domains. Moreover, they often also collapse multiple
1361
dimensions of value onto a few or even one metric, losing detail and clarity. Nonetheless, a holistic
1362
valuation of the RRfW systems is clearly important in capturing all benefits and impacts established
1363
as relevant and important to all stakeholders, as well as the trade-offs and synergies associated with
1364
MCPs. For example technical aspects referring to the physical properties of MCPs will ultimately
1365
determine their reusability and/or recyclability, while social aspects will determine the viability and
1366
acceptability of an RRfW processes; hence, these must be included in any analysis.
AC C
EP
1354
52
ACCEPTED MANUSCRIPT 1367
As illustrated in Figure 4, the concurrent consideration of all dimensions of value that fall under
1368
each one of the four domains (i.e. environmental, economic, social and technical), has been largely
1369
overlooked. However, a holistic resource recovery system’s evaluation for complex value
1370
optimisation requires input from all four domains of value, as shown in Figure 4.
M AN U
SC
RI PT
1371
1372
1374 1375 1376
TE D
1373
Figure 4 Frameworks, methods and tools used for the appraisal of aspects of the dimensions of resource value. Methods and tools which combine different dimensions are linked to the points of overlap.
EP
1377
Measuring concurrently dimensions of value from the four value domains as they evolve along
1379
with the flows and the transformations of materials within a system is critical, not only because of the
1380
need to grasp the complexity of RRfW systems, but also in order to demonstrate their viability,
1381
sustainability and compatibility with upstream design, manufacture and distribution systems. A
1382
holistic description (with metrics), evaluation and assessment of RRfW circular economy systems
1383
enables sound decision-making that increases the potential for MCPs to be properly designed,
1384
produced, used, and managed when they reach their EoU and EoL status (as presented in Figure 3,
1385
Section 6).
AC C
1378
1386
In this paper, we critically examined the multitude of metrics embedded within various analysis
1387
frameworks and classified them into four domains: environmental, economic, technical and social.
1388
We found that:
53
ACCEPTED MANUSCRIPT -
Environmental metrics are more extensively used than others; to the point where some dimensions of environmental value (e.g. carbon footprint) have multiple conflicting metrics associated therewith. This reflects where the development focus of decision-making frameworks, and of assessment methods and tools has been placed over recent decades. This focus is not unjustified considering that environmental metrics provide an important measure of the ability to meet sustainability principles associated with MCPs lifecycle, aligned with the planet’s ecological capacity.
1396 1397 1398 1399 1400 1401 1402
-
Economic metrics are focussed on creation/loss of monetary value and often neglect wider economic issues. CBA is essentially a ‘partial equilibrium’ tool ill-suited to system-wide, long run (i.e. holistic) assessment. Furthermore, the need to decouple materials consumption from economic development means moving yet further away from conventional economic thinking. There is widespread appetite for improved economic assessment frameworks, not least given more general recognition of the system-wide and long-run impacts of infrastructure, including waste treatment infrastructure.
1403 1404 1405 1406 1407 1408 1409 1410 1411
-
Social metrics are the least used of the four, and yet the benefits and impacts of RRfW on our society are ultimately the most important. These metrics depend on many interlinked relationships that make their targeted selection and assessment within the RRfW system a challenging task. Nonetheless a sufficient number of social metrics exist across multiple assessment techniques that, if collated and selected correctly, could provide a basis for useful advances in tackling the problem of social value accounting. The low number and low level of operationalisation of social metrics also mirrors the usually quite low level involvement of social scientists in assessments of RRfW systems, pointing to the need to establish a truly interdisciplinary practice of such assessments.
1412 1413 1414 1415 1416 1417 1418 1419 1420 1421 1422 1423 1424 1425
-
Technical metrics are generally specific to a given MCP or process, but a general subset of technical dimensions relevant to RRfW can be identified; but technical metrics are vaguely and often insufficiently defined in the literature. Key aspects such as variability and dispersion are not extensively considered. Such technical metrics are set to reflect and capture the functionality of MCPs; a product, component or material is technically functional if its relevant technical properties - e.g. strength, purity, plasticity and operability - have not deteriorated to the point where it no longer fulfils any valuable function. Technical value also depends on the intended pathway through which value is to be recovered, and the available know-how and skills to recover this value in the most beneficial way, invoking interaction between upstream and downstream cycles of supply chains as well as the interdependence between technical and social metrics. Gaining an understanding of the MCPs physical and technical characteristics and properties and their relevance to the function provided is an essential step towards determining the optimal way of recovering this function at their EoU and EoL stage.
1426
Wider political aspects are not neglected herein; they are reflected in and analysed via the
1427
interconnections between the environmental, economic, social and technical domains of value. Yet
1428
these have an important role to play and given the geo-political landscape, leadership changes and
1429
regulatory constraints the benefits and impacts of RRfW will differ widely, as well as the decisions
1430
that may derive from the holistic assessment and evaluation.
AC C
EP
TE D
M AN U
SC
RI PT
1389 1390 1391 1392 1393 1394 1395
54
ACCEPTED MANUSCRIPT Whereas there are metrics that are well known and developed (e.g. direct carbon emissions, costs
1432
of raw materials, net profit), there are others that are less developed (e.g. reusability, mass
1433
recoverability, technical recoverability) or less flexible for wider use by many stakeholders (e.g.
1434
Embodied Carbon, child labour, job creation, NIMBY syndrome). This raises concerns around the
1435
practicality of using metrics that some stakeholders either may not be in a position to understand, or
1436
are unable to gather the data required for the incorporation of such metrics in their evaluation process.
1437
Where the associated data are (made) available, metrics that are simple, transparent, and easy to
1438
understand and measure will be most useful for evaluating the environmental, economic, social and
1439
technological dimensions of resource value, and ideally the foundations of sound decision and policy
1440
making in the area of resource management (Krajnc and Glavič, 2003; Singh et al., 2012; Tanzil and
1441
Beloff, 2006).
SC
RI PT
1431
It must be highlighted that the metrics listed in this study are only those that have been regularly
1443
observed and used in waste management and resource recovery systems’ assessment studies. It is
1444
likely that some metrics have been overlooked, and others are yet to be developed. Not all metrics are
1445
relevant to all stakeholders involved in the RRfW system; selection of metrics must be specific to the
1446
system under investigation (i.e. the type of material, component or product, and their pathways to
1447
value recovery), and the issues that the assessment aims to address. Our future research work aims to
1448
improve the lists of metrics for evaluating RRfW systems under different contexts, and provide
1449
guidance for selecting metrics for evaluating a RRfW system under a specific context. Development
1450
of this guidance will be based on multi-criteria decision analysis (MCDA) and the ‘systems of
1451
provision’ approach, which can explicitly and straightforwardly bring together the various domains of
1452
value (Brooks, 2015; van Kempen, 2003). Each system of provision involves a particular valuable
1453
economic good or service, integrally connected to specific agents and groups (e.g. private business,
1454
consumers, workers, state actors) in processes of production, exchange, distribution and consumption,
1455
usually for profit (Brown and Robertson, 2014).
EP
TE D
M AN U
1442
As regards RRfW, the approach will first aim to establish, for each resource recovery system, what
1457
the relevant actors, groups, processes, and structures involved in provision of the relevant goods and
1458
services are. This facilitates identification of the multiple values flowing through the system, and the
1459
various interests (goals) of different groups and agents within the system. Thus, the approach nurtures
1460
a realistic narrative framework within which to contextualise the RRfW system under study aiding the
1461
modelling process and the interpretation of results. For example, the identification of appropriate
1462
system boundaries and metrics will be greatly aided by this framework, in a way that is not possible
1463
were the system conceptualised in terms of the fiction of homo economicus found in standard CBA
1464
approaches.
AC C
1456
1465 55
ACCEPTED MANUSCRIPT 1466
8 Conclusions The transition to a circular economy requires materials, components and products (MCPs) to be
1468
retained in the economy for longer. This presumption requires the assessment and evaluation of
1469
resource recovery from waste (RRfW) systems, upstream and downstream of the point where wastes
1470
are generated, in order to enable sound policy and decision-making processes. To make a significant
1471
step towards achieving this, a holistic evaluation of RRfW systems based on MCPs multi-dimensional
1472
‘complex value’, i.e., the holistic sum of their environmental, economic, social and technical benefits
1473
and impacts and how these are distributed across the system over time, is increasingly required. This
1474
evaluation would provide insights into the sustainability of retaining the functionality and embedded
1475
value of MCPs, and how to enable this to become realised. This study reveals that existing
1476
frameworks, methods and tools currently used for assessing waste management and resource recovery
1477
systems do not adequately account for the complex value of MCPs across supply chain systems; this
1478
is because of the lack of accounting for all domains of value simultaneously. It highlights that there is
1479
a diverse range of useful and informative metrics extant in the literature that could be combined for
1480
use in assessing the complex value of MCPs, but the need for them to be simple, transparent and easy
1481
to measure must be an important pre-condition in selecting the suite of metrics that are best able to
1482
assess the RRfW system under investigation. The gap between the need for multi-dimensional
1483
evaluation of RRfW systems and the lack of coherence in the pool of metrics that currently exists in
1484
this field (as well as those that have perhaps been overlooked) needs to be urgently addressed. Future
1485
developments should focus on closing this gap to provide the foundations for a new approach that can
1486
address complex value and properly evaluate the trade-offs, synergies and problem shifting that
1487
interventions in resource recovery processes or systems intended to promote a circular economy may
1488
cause.
TE D
M AN U
SC
RI PT
1467
EP
1489
Acknowledgements
1491
We are grateful to Professor David C. Wilson, MBE, and Dr Stephen Hall for their constructive
1492
feedback. We also express our gratitude to the multiple members of the CVORR Steering Committee
1493
for general feedback throughout the project. We are also grateful to the Reviewers for their
1494
constructive input. The opinions expressed herein are the authors’ alone.
AC C
1490
1495 1496
Financial
56
ACCEPTED MANUSCRIPT 1497
We gratefully acknowledge support of the UK Natural Environment Research Council (NERC) and
1498
the UK Economic and Social Research Council (ESRC) who funded this work in the context of
1499
‘Complex Value Optimisation for Resource Recovery’ (CVORR) project (Grant No. NE/L014149/1).
1500 1501
9 References
RI PT
1502
Abduli, M.A., Naghib, A., Yonesi, M., Akbari, A., 2010. Life cycle assessment (LCA) of solid waste management strategies in Tehran: landfill and composting plus landfill. Environmental Monitoring and Assessment 178, 487-498.
1506 1507
Acero, A., Rodrigues, C., Ciroth, A., 2015. LCIA methods: Impact assessment methods in Life Cycle Assessment and their impact categories. GreenDelta GmbH, Berlin, Germany.
1508 1509 1510
Achillas, C., Vlachokostas, C., Moussiopoulos, N., Banias, G., Kafetzopoulos, G., Karagiannidis, A., 2011. Social acceptance for the development of a waste-to-energy plant in an urban area. Resources, Conservation and Recycling 55, 857-863.
1511 1512
Ackerman, F., Heinzerling, L., 2002. Pricing the priceless: Cost-benefit analysis of environmental protection. University of Pennsylvania Law Review 150, 1553-1584.
1513 1514
Al-Salem, S.M., Lettieri, P., Baeyens, J., 2009. Recycling and recovery routes of plastic solid waste (PSW): A review. Waste Management 29, 2625-2643.
1515 1516
Albrecht, M.A., Evans, C.W., Raston, C.L., 2006. Green chemistry and the health implications of nanoparticles. Green Chemistry 8, 417-432.
1517 1518 1519
Allacker, K., Mathieux, F., Manfredi, S., Pelletier, N., De Camillis, C., Ardente, F., Pant, R., 2014. Allocation solutions for secondary material production and end of life recovery: Proposals for product policy initiatives. Resources, Conservation and Recycling 88, 1-12.
1520 1521 1522
Allegrini, E., Vadenbo, C., Boldrin, A., Astrup, T.F., 2015. Life cycle assessment of resource recovery from municipal solid waste incineration bottom ash. Journal of Environmental Management 151, 132-143.
1523 1524
Allesch, A., Brunner, P.H., 2014. Assessment methods for solid waste management: A literature review. Waste Management & Research 32, 461-473.
1525 1526 1527
Amezquita, T., Hammond, R., Salazar, M., Bras, B., 1995. Characterizing the Remanufacturability of Engineering Systems, Characterizing the Remanufacturability of Engineering Systems, Proceedings of ASME Advances in Design Automation, Boston, pp. 271–278.
1528 1529 1530
Amini, S.H., Remmerswaal, J.A.M., Castro, M.B., Reuter, M.A., 2007. Quantifying the quality loss and resource efficiency of recycling by means of exergy analysis. Journal of Cleaner Production 15, 907-913.
1531 1532
Amlinger, F., Peyr, S., Cuhls, C., 2008. Green house gas emissions from composting and mechanical biological treatment. Waste Management & Research 26, 47-60.
1533 1534
Anderson, M., Teisl, M., Noblet, C., Klein, S., 2015. The incompatibility of benefit–cost analysis with sustainability science. Sustainability Science 10, 33-41.
1535 1536 1537
Antikainen, R., Lemola, R., Nousiainen, J., Sokka, L., Esala, M., Huhtanen, P., Rekolainen, S., 2005. Stocks and flows of nitrogen and phosphorus in the Finnish food production and consumption system. Agriculture, Ecosystems & Environment 107, 287–305.
AC C
EP
TE D
M AN U
SC
1503 1504 1505
57
ACCEPTED MANUSCRIPT Antonopoulos, I.-S., Karagiannidis, A., Tsatsarelis, T., Perkoulidis, G., 2012. Applying waste management scenarios in the Peloponnese region in Greece: a critical analysis in the frame of life cycle assessment. Environmental Science and Pollution Research 20, 2499-2511.
1541 1542
APHA, 1992. Standard Methods for the Examination of Water and Wastewater. American Water Works Association (AWWA) and Water Pollution Control Federation (WPCF), Washington, DC.
1543 1544 1545
Ardente, F., Mathieux, F., 2014. Identification and assessment of product's measures to improve resource efficiency: the case-study of an Energy using Product. Journal of Cleaner Production 83, 126-141.
1546 1547 1548 1549 1550
Ardente, F., Mathieux, F., Recchioni, M., 2013. Combining Five Criteria to Identify Relevant Products Measures for Resource Efficiency of an Energy Using Product, in: Nee, A.Y.C., Song, B., Ong, S.-K. (Eds.), Re-engineering Manufacturing for Sustainability: Proceedings of the 20th CIRP International Conference on Life Cycle Engineering, Singapore 17-19 April, 2013. Springer Singapore, Singapore, pp. 111-116.
1551 1552
Arena, U., Mastellone, M.L., Perugini, F., 2003. The environmental performance of alternative solid waste management options: a life cycle assessment study. Chemical Engineering Journal 96, 207-222.
1553 1554
Ashby, M.F., 2016. Chapter 14 - The Vision: A Circular Materials Economy, in: Ashby, M.F. (Ed.), Materials and Sustainable Development. Butterworth-Heinemann, Boston, pp. 211-239.
1555 1556
Asif, F.M., Bianchi, C., Rashid, A., Nicolescu, C.M., 2012. Performance analysis of the closed loop supply chain. Journal of Remanufacturing 2, 1-21.
1557
Askeland, D.R., Phulé, P.P., 2003. The science and engineering of materials. Springer.
1558 1559
Asmala, E., Saikku, L., 2010. Closing a Loop: Substance Flow Analysis of Nitrogen and Phosphorus in the Rainbow Trout Production and Domestic Consumption System in Finland. Ambio 39, 126-135.
1560 1561
Astrup, T., Fruergaard, T., Christensen, T.H., 2009. Recycling of plastic: accounting of greenhouse gases and global warming contributions. Waste Management & Research 27, 763-772.
1562 1563
Atherton, J., 2007. Declaration by the Metals Industry on Recycling Principles. The International Journal of Life Cycle Assessment 12, 59-60.
1564 1565
Atlee, J., Kirchain, R., 2006. Operational Sustainability Metrics Assessing Metric Effectiveness in the Context of Electronics-Recycling Systems. Environmental Science & Technology 40, 4506-4513.
1566 1567
Ayres, R.U., Ayres, L.W., Martinás, K., 1998. Exergy, waste accounting, and life-cycle analysis. Energy 23, 355-363.
1568 1569
Ayres, R.U., Ayres, L.W., Warr, B., 2003. Exergy, power and work in the US economy, 1900–1998. Energy 28, 219-273.
1570 1571
Azapagic, A., 1999. Life cycle assessment and its application to process selection, design and optimisation. Chemical Engineering Journal 73, 1-21.
1572 1573
Azapagic, A., Clift, R., 1999. The application of life cycle assessment to process optimisation. Computers & Chemical Engineering 23, 1509-1526.
1574 1575
Azapagic, A., Emsley, A., Hamerton, I., 2003. Polymers: the environment and sustainable development. John Wiley & Sons.
1576 1577
Azapagic, A., Perdan, S., 2000. Indicators of sustainable development for industry: A general framework. Process Safety and Environmental Protection 78, 243-261.
1578 1579 1580 1581
Bache, I., 2015. Measuring Quality of Life—An Idea Whose Time Has Come? Agenda-Setting Dynamics in Britain and the European Union, in: Søraker, J.H., Van der Rijt, J.-W., de Boer, J., Wong, P.-H., Brey, P. (Eds.), Well-Being in Contemporary Society. Springer International Publishing, Cham, pp. 197-214.
AC C
EP
TE D
M AN U
SC
RI PT
1538 1539 1540
58
ACCEPTED MANUSCRIPT Badran, M.F., El-Haggar, S.M., 2006. Optimization of municipal solid waste management in Port Said – Egypt. Waste Management 26, 534-545.
1584 1585
Balkema, A.J., Preisig, H.A., Otterpohl, R., Lambert, F.J.D., 2002. Indicators for the sustainability assessment of wastewater treatment systems. Urban Water 4, 153-161.
1586 1587
Barrett, J., Scott, A., 2001. The Ecological Footprint: A Metric for Corporate Sustainability. Corporate Environmental Strategy 8, 316-325.
1588 1589
Bartl, A., 2015. Circular Economy: Cycles, loops and cascades, ISWA Resource Management Task Force Report No.2. International Solid Waste Association (ISWA), Vienna, Austria.
1590 1591 1592
Baynes, T., Lenzen, M., Steinberger, J.K., Bai, X., 2011. Comparison of household consumption and regional production approaches to assess urban energy use and implications for policy. Energy Policy 39, 7298-7309.
1593 1594 1595
Begum, R.A., Siwar, C., Pereira, J.J., Jaafar, A.H., 2006. A benefit–cost analysis on the economic feasibility of construction waste minimisation: The case of Malaysia. Resources, Conservation and Recycling 48, 86-98.
1596 1597
Bejan, A., 2002. Fundamentals of exergy analysis, entropy generation minimization, and the generation of flow architecture. International Journal of Energy Research 26, 0-43.
1598 1599
Belgiorno, V., De Feo, G., Della Rocca, C., Napoli, R.M.A., 2003. Energy from gasification of solid wastes. Waste Management 23, 1-15.
1600 1601 1602
Bengtsson, S., 2004. The BASF Eco-Efficiency Analysis method - applied on environmental impact data from an LCA study of two colorants, in: Product Stewardship & Sustainability, A.N.S.C. (Ed.), Dantes - Eco-Efficiency evaluation of new and existing products (DANTES). European Commission.
1603 1604
Benton, J., Hazell, J., 2013. Resource resilient UK - A report from the Circular Economy Task Force. Green Alliance, London.
1605 1606
Benton, J., Hazell, J., 2014. Wasted opportunitites: smarter systems for resource recovery, A report from the Circular Economy Task Force. Green Alliance, London.
1607 1608
Bernard, J.-T., Côté, B., 2005. The measurement of the energy intensity of manufacturing industries: a principal components analysis. Energy Policy 33, 221-233.
1609 1610
Bernstad, A., la Cour Jansen, J., 2012. Review of comparative LCAs of food waste management systems – Current status and potential improvements. Waste Management 32, 2439-2455.
1611 1612
Björklund, A., Dalemo, M., Sonesson, U., 1999. Evaluating a municipal waste management plan using ORWARE. Journal of Cleaner Production 7, 271-280.
1613 1614
Blengini, G.A., 2008a. Applying LCA to organic waste management in Piedmont, Italy. Management of Environmental Quality 19, 533-549.
1615 1616 1617
Blengini, G.A., 2008b. Using LCA to evaluate impacts and resources conservation potential of composting: A case study of the Asti District in Italy. Resources, Conservation and Recycling 52, 1373-1381.
1618 1619 1620
Blengini, G.A., Fantoni, M., Busto, M., Genon, G., Zanetti, M.C., 2012. Participatory approach, acceptability and transparency of waste management LCAs: Case studies of Torino and Cuneo. Waste Management 32, 1712-1721.
1621 1622 1623
Boldrin, A., Andersen, J.K., Møller, J., Christensen, T.H., Favoino, E., 2009. Composting and compost utilization: accounting of greenhouse gases and global warming contributions. Waste Management & Research 27, 800-812.
1624 1625 1626
Bottero, M., Comino, E., Riggio, V., 2011. Application of the Analytic Hierarchy Process and the Analytic Network Process for the assessment of different wastewater treatment systems. Environmental Modelling & Software 26, 1211-1224.
AC C
EP
TE D
M AN U
SC
RI PT
1582 1583
59
ACCEPTED MANUSCRIPT Bovea, M.D., Ibáñez-Forés, V., Gallardo, A., Colomer-Mendoza, F.J., 2010. Environmental assessment of alternative municipal solid waste management strategies. A Spanish case study. Waste Management 30, 2383-2395.
1630 1631
Bovea, M.D., Powell, J.C., 2006. Alternative scenarios to meet the demands of sustainable waste management. Journal of Environmental Management 79, 115-132.
1632
Boxall, A.B.A., 2004. The environmental side effects of medication. EMBO Reports 5, 1110-1116.
1633 1634
Bras, B., Hammond, R., 1996a. Towards design for remanufacturing—Metrics for assessing remanufacturability, Proceedings of the 1st International Workshop on Reuse. Citeseer, pp. 5-22.
1635 1636
Bras, B., Hammond, R., 1996b. Towards Remanufacturing- Metrics for Assessing Remanufacturability, 1st International Workshop on Reuse, Eindhoven, The Netherlands, pp. 35–52.
1637 1638 1639
Brentner, L.B., Eckelman, M.J., Zimmerman, J.B., 2011. Combinatorial Life Cycle Assessment to Inform Process Design of Industrial Production of Algal Biodiesel. Environmental Science & Technology 45, 7060-7067.
1640 1641
Broadbent, C., 2016. Steel’s recyclability: demonstrating the benefits of recycling steel to achieve a circular economy. The International Journal of Life Cycle Assessment, 1-8.
1642
Brooks, A., 2015. Systems of provision: Fast fashion and jeans. Geoforum 63, 36-39.
1643 1644
Brown, A., Robertson, M., 2014. Economic evaluation of systems of infrastructure provision: concepts, approaches, methods, iBUILD/Leeds Report. University of Leeds, Leeds.
1645 1646
Brunner, P.H., Rechberger, H., 2004. Practical Handbook of Material Flow Analysis. Lewis Publishers,, Boca Raton, FL.
1647 1648 1649
Bunse, K., Vodicka, M., Schönsleben, P., Brülhart, M., Ernst, F.O., 2011. Integrating energy efficiency performance in production management – gap analysis between industrial needs and scientific literature. Journal of Cleaner Production 19, 667-679.
1650 1651
Burgess, A.A., Brennan, D.J., 2001. Application of life cycle assessment to chemical processes. Chemical Engineering Science 56, 2589-2604.
1652 1653
Butterworth, J., Bleriot, J., 2014. The Circular Economy Is the Basis of a New Industrial Policy. Europe'sWorld, Brussels.
1654 1655 1656
Buttol, P., Masoni, P., Bonoli, A., Goldoni, S., Belladonna, V., Cavazzuti, C., 2007. LCA of integrated MSW management systems: Case study of the Bologna District. Waste Management 27, 1059-1070.
1657 1658 1659
Cabeza, L.F., Barreneche, C., Miró, L., Morera, J.M., Bartolí, E., Inés Fernández, A., 2013. Low carbon and low embodied energy materials in buildings: A review. Renewable and Sustainable Energy Reviews 23, 536-542.
1660 1661
Callens, I., Tyteca, D., 1999. Towards indicators of sustainable development for firms: a productive efficiency perspective. Ecological Economics 28, 41-53.
1662 1663
Cameron, I., Hare, B., Davies, R., 2008. Fatal and major construction accidents: A comparison between Scotland and the rest of Great Britain. Safety Science 46, 692-708.
1664 1665 1666
Carlsson Reich, M., 2005. Economic assessment of municipal waste management systems—case studies using a combination of life cycle assessment (LCA) and life cycle costing (LCC). Journal of Cleaner Production 13, 253-263.
1667 1668
CECED, 2003. Food waste disposers - An integral part of the EU's future waste management strategy. European Committee of Manufacturers of Domestic Appliances Brussels, Belgium.
1669 1670
Cerdan, C., Gazulla, C., Raugei, M., Martinez, E., Fullana-i-Palmer, P., 2009. Proposal for new quantitative eco-design indicators: a first case study. Journal of Cleaner Production 17, 1638-1643.
AC C
EP
TE D
M AN U
SC
RI PT
1627 1628 1629
60
ACCEPTED MANUSCRIPT Chalkias, C., Lasaridi, K., 2009. A GIS based model for the optimisation of municipal solid waste collection: The case study of Nikea, Athens, Greece. WSEAS Transactions on Environment and Development 1, 11-15.
1674 1675
Chang, N.-B., Davila, E., 2007. Minimax regret optimization analysis for a regional solid waste management system. Waste Management 27, 820-832.
1676 1677 1678
Chang, N.-B., Parvathinathan, G., Breeden, J.B., 2008. Combining GIS with fuzzy multicriteria decision-making for landfill siting in a fast-growing urban region. Journal of Environmental Management 87, 139-153.
1679 1680
Cherubini, F., Bargigli, S., Ulgiati, S., 2009. Life cycle assessment (LCA) of waste management strategies: Landfilling, sorting plant and incineration. Energy 34, 2116-2123.
1681 1682 1683
Cherubini, F., Peters, G.P., Berntsen, T., StrØMman, A.H., Hertwich, E., 2011. CO2 emissions from biomass combustion for bioenergy: atmospheric decay and contribution to global warming. GCB Bioenergy 3, 413-426.
1684 1685 1686
Chong, Y.T., Teo, K.M., Tang, L.C., 2016. A lifecycle-based sustainability indicator framework for waste-to-energy systems and a proposed metric of sustainability. Renewable and Sustainable Energy Reviews 56, 797-809.
1687 1688
Choy, K.K.H., Porter, J.F., Hui, C.-W., McKay, G., 2004. Process design and feasibility study for small scale MSW gasification. Chemical Engineering Journal 105, 31-41.
1689 1690 1691
Christensen, T.H., Gentil, E., Boldrin, A., Larsen, A.W., Weidema, B.P., Hauschild, M., 2009. C balance, carbon dioxide emissions and global warming potentials in LCA-modelling of waste management systems. Waste Management & Research 27, 707-715.
1692 1693 1694
Clift, R., Doig, A., Finnveden, G., 2000. The Application of Life Cycle Assessment to Integrated Solid Waste Management: Part 1—Methodology. Process Safety and Environmental Protection 78, 279-287.
1695 1696
Constable, D.J., Curzons, A.D., Cunningham, V.L., 2002. Metrics to ‘green’chemistry—which are the best? Green Chemistry 4, 521-527.
1697 1698
da Cruz, N.F., Simões, P., Marques, R.C., 2014. Costs and benefits of packaging waste recycling systems. Resources, Conservation and Recycling 85, 1-4.
1699 1700
Daley, D., 2013. Emergy Accounting for Assessing the Sustainability of Wastewater Management Systems. Clear Waters Summer.
1701 1702
Dao, V., Langella, I., Carbo, J., 2011. From green to sustainability: Information Technology and an integrated sustainability framework. The Journal of Strategic Information Systems 20, 63-79.
1703 1704
Davis, M., Coony, R., Gould, S., Daly, A., 2005. Guidelines for Lice Cycle Cost Analysis, Land and Buildings. Stanford University Stanford, California.
1705 1706 1707
Dawson, D.A., Purnell, P., Roelich, K., Busch, J., Steinberger, J.K., 2014. Low Carbon Technology Performance vs Infrastructure Vulnerability: Analysis through the Local and Global Properties Space. Environmental Science & Technology 48, 12970-12977.
1708 1709
Defra, 2007. Health impact assessment of alternate week waste collections of biodegradable waste. Department of Environment, Food and Rural Affairs.
1710 1711
den Boer, J., den Boer, E., Jager, J., 2007. LCA-IWM: A decision support tool for sustainability assessment of waste management systems. Waste Management 27, 1032-1045.
1712 1713 1714
Dent, D., Asfary, A.F., Giri, C., Govil, K., Hartemink, A., Holmgren, P., Keita-Ouane, F., Navone, S., Olsson, L., Ponce-Hernandez, R., Rockstrom, J., Shepherd, G., 2007. Land, Section B: State-andtrends of the environment: 1987–2007 UNEP.
AC C
EP
TE D
M AN U
SC
RI PT
1671 1672 1673
61
ACCEPTED MANUSCRIPT Dewulf, J.P., Van Langenhove, H.R., 2002. Quantitative Assessment of Solid Waste Treatment Systems in the Industrial Ecology Perspective by Exergy Analysis. Environmental Science & Technology 36, 1130-1135.
1718 1719
Dijkgraaf, E., Vollebergh, H.R.J., 2004. Burn or bury? A social cost comparison of final waste disposal methods. Ecological Economics 50, 233-247.
1720
Dincer, I., Rosen, M.A., 2012. Exergy: energy, environment and sustainable development. Newnes.
1721 1722 1723
Djukic, M., Jovanoski, I., Ivanovic, O.M., Lazic, M., Bodroza, D., 2016. Cost-benefit analysis of an infrastructure project and a cost-reflective tariff: A case study for investment in wastewater treatment plant in Serbia. Renewable and Sustainable Energy Reviews 59, 1419-1425.
1724 1725
Dreyer, L., Hauschild, M., Schierbeck, J., 2006. A framework for social life cycle impact assessment (10 pp). The International Journal of Life Cycle Assessment 11, 88-97.
1726 1727
EA, 2002. Environmental Impact Assessment (EIA): A handbook for scoping projects, A2: Scoping the Environmental Impacts of Demolition and Decommissioning Works, Rotherham.
1728 1729 1730
EC, 2015. Closing the loop - An EU action plan for the Circular Economy, Communication from the Commission to the European Parliament, the Council, the European Economic and Social Committee and the Committee of the Regions. European Commission, Brussels.
1731
Ecorys, 2014. Resource efficiency in the building sector. Ecorys.
1732 1733
EEA, 2008. Impacts due to over-abstraction, Water resources. European Environment Agency, Copenhagen.
1734 1735
EEA, 2010. Chapter 6: Links between environmental challenges, EEA: The European environment State and outlook 2010 (Synthesis). European Environment Agency, Copenhagen.
1736 1737
Ekvall, T., 2000. A market-based approach to allocation at open-loop recycling. Resources, Conservation and Recycling 29, 91-109.
1738 1739
Ekvall, T., Assefa, G., Björklund, A., Eriksson, O., Finnveden, G., 2007. What life-cycle assessment does and does not do in assessments of waste management. Waste Management 27, 989-996.
1740
Elkington, J., 2004. Enter the triple bottom line. The triple bottom line: Does it all add up 11, 1-16.
1741
Ellen MacArthur Foundation, 2012. Towards the Circular Economy. Ellen MacArthur Foundation.
1742 1743
EpE, 2013. Protocol for the Quantification of Greenhouse Gases Emissions from Waste Management Activities. Entreprises pour l’Environnemnent, Nanterre, France.
1744 1745 1746
Eriksson, O., Carlsson Reich, M., Frostell, B., Björklund, A., Assefa, G., Sundqvist, J.O., Granath, J., Baky, A., Thyselius, L., 2005. Municipal solid waste management from a systems perspective. Journal of Cleaner Production 13, 241-252.
1747 1748
Eriksson, O., Olofsson, M., Ekvall, T., 2003. How model-based systems analysis can be improved for waste management planning. Waste Management & Research 21, 488-500.
1749
Ertesvåg, I.S., Mielnik, M., 2000. Exergy analysis of the Norwegian society. Energy 25, 957-973.
1750 1751
Esbensen, K.H., Wagner, C., 2014a. Theory of sampling (TOS) versus measurement uncertainty (MU) – A call for integration. TrAC Trends in Analytical Chemistry 57, 93-106.
1752 1753
Esbensen, K.H., Wagner, C., 2014b. Why we need the Theory of Sampling. The Analytical Scientist 21, 30-38
1754 1755
Esmaili, H., 1972. Facility selection and haul optimization model. Journal of the Sanitary Engineering Division 98, 1005-1020.
AC C
EP
TE D
M AN U
SC
RI PT
1715 1716 1717
62
ACCEPTED MANUSCRIPT European Commission, 2008. Guidelines on the interpretation of the R1 energy efficiency formula for incineration facilities dedicated to the processing of municipal solid waste according to Annex II of Directive 2008/98/EC on waste. DG Environment, European Commission, Brussels.
1759 1760 1761
European Commission, 2013. Commission Recommendation of 9 April 2013 on the use of common methods to measure and communicate the life cycle environmental performance of products and organisations, 2013/179/EU. Official Journal of the European Union Brussels.
1762 1763
European Commission, 2016. Critical raw materials, Raw materials, metals, minerals and forest-based industries. Website of the European Commission, Brussels.
1764 1765 1766 1767
European Union, 2005. Directive 2005/64/EC of the European Parliament and of the Council of 26 October 2005 on the type-approval of motor vehicles with regard to their reusability, recyclability and recoverability and amending Council Directive 70/156/EEC, L 310/10. Official Journal of the European Union, Brussels.
1768 1769 1770
European Union, 2008. Directive 2008/98/EC of 19 November 2008 on waste and repealing certain Directives (Waste Framework Directive), L312/3 22.11. Official Journal of the European Union, Brussels, pp. 3-30.
1771 1772
Fang, H.C., Ong, S.K., Nee, A.Y.C., 2015a. Product Remanufacturability Assessment and Implementation Based on Design Features. Procedia CIRP 26, 571-576.
1773 1774 1775
Fang, K., Heijungs, R., de Snoo, G.R., 2014. Theoretical exploration for the combination of the ecological, energy, carbon, and water footprints: Overview of a footprint family. Ecological Indicators 36, 508-518.
1776 1777 1778
Fang, K., Heijungs, R., De Snoo, G.R., 2015b. Understanding the complementary linkages between environmental footprints and planetary boundaries in a footprint–boundary environmental sustainability assessment framework. Ecological Economics 114, 218-226.
1779 1780 1781
FAO, 2009. Chapter 4: Major impacts of irrigation and drainage projects, in: Department, N.R.M.a.E. (Ed.), Environmental impact assessment of irrigation and drainage projects, Corporate Document Repository.
1782 1783 1784
Farel, R., Yannou, B., Ghaffari, A., Leroy, Y., 2013. A cost and benefit analysis of future end-of-life vehicle glazing recycling in France: A systematic approach. Resources, Conservation and Recycling 74, 54-65.
1785 1786 1787
Ferrão, P., Ribeiro, P., Rodrigues, J., Marques, A., Preto, M., Amaral, M., Domingos, T., Lopes, A., Costa, e.I., 2014. Environmental, economic and social costs and benefits of a packaging waste management system: A Portuguese case study. Resources, Conservation and Recycling 85, 67-78.
1788 1789
Finkbeiner, M., 2014. Product environmental footprint—breakthrough or breakdown for policy implementation of life cycle assessment. Int J Life Cycle Assess 19, 266-271.
1790 1791
Finkbeiner, M., Schau, E.M., Lehmann, A., Traverso, M., 2010. Towards Life Cycle Sustainability Assessment. Sustainability 2, 3309.
1792 1793
Finnveden, G., 1999. Methodological aspects of life cycle assessment of integrated solid waste management systems. Resources, Conservation and Recycling 26, 173-187.
1794 1795 1796
Finnveden, G., Hauschild, M.Z., Ekvall, T., Guinée, J., Heijungs, R., Hellweg, S., Koehler, A., Pennington, D., Suh, S., 2009. Recent developments in Life Cycle Assessment. Journal of Environmental Management 91, 1-21.
1797 1798
Finnveden, G., Johansson, J., Lind, P., Moberg, Å., 2005. Life cycle assessment of energy from solid waste—part 1: general methodology and results. Journal of Cleaner Production 13, 213-229.
1799 1800
Finnveden, G., Moberg, Å., 2005. Environmental systems analysis tools – an overview. Journal of Cleaner Production 13, 1165-1173.
AC C
EP
TE D
M AN U
SC
RI PT
1756 1757 1758
63
ACCEPTED MANUSCRIPT Finnveden, G., Östlund, P., 1997. Exergies of natural resources in life-cycle assessment and other applications. Energy 22, 923-931.
1803 1804
Flesch, T.K., Desjardins, R.L., Worth, D., 2011. Fugitive methane emissions from an agricultural biodigester. Biomass and Bioenergy 35, 3927-3935.
1805 1806 1807
Fonyó, Z., Rév, E., Rücker, A., Gruhn, G., 1999. European Symposium on Computer Aided Process EngineeringExergetic criteria in process optimisation and process synthesis. Computers & Chemical Engineering 23, S109-S112.
1808 1809
Fuertes, L.A., Hudson, J.F., Marks, D.H., 1974. Solid waste management: equity trade-off models. Journal of The Urban Planning and Development Division 100, 155-171.
1810 1811
Fuglestvedt, J.S., Berntsen, T., Godal, O., Sausen, R., Shine, K.P., Skodvin, T., 2001. Assessing the metrics of climate change: current methods and future possibilities. Report/CICERO-NBN: no-3645.
1812 1813
Gasparatos, A., El-Haram, M., Horner, M., 2009a. Assessing the sustainability of the UK society using thermodynamic concepts: Part 1. Renewable and Sustainable Energy Reviews 13, 1074-1081.
1814 1815
Gasparatos, A., El-Haram, M., Horner, M., 2009b. Assessing the sustainability of the UK society using thermodynamic concepts: Part 2. Renewable and Sustainable Energy Reviews 13, 956-970.
1816 1817
Gencturk, B., Hossain, K., Lahourpour, S., 2016. Life cycle sustainability assessment of RC buildings in seismic regions. Engineering Structures 110, 347-362.
1818 1819
Gentil, E.C., Aoustin, E., Christensen, T.H., 2009. Greenhouse gas accounting and waste management. Waste Management & Research.
1820 1821 1822
Ghisellini, P., Cialani, C., Ulgiati, S., 2016. A review on circular economy: the expected transition to a balanced interplay of environmental and economic systems. Journal of Cleaner Production 114, 1132.
1823 1824
Ghose, M.K., Dikshit, A.K., Sharma, S.K., 2006. A GIS based transportation model for solid waste disposal – A case study on Asansol municipality. Waste Management 26, 1287-1293.
1825 1826
Giacone, E., Mancò, S., 2012. Energy efficiency measurement in industrial processes. Energy 38, 331-345.
1827
Giampietro, M., Saltelli, A., 2014. Footprints to nowhere. Ecological Indicators 46, 610-621.
1828 1829
Giannakis, M., Papadopoulos, T., 2016. Supply chain sustainability: A risk management approach. International Journal of Production Economics 171, Part 4, 455-470.
1830 1831 1832
Giannetti, B.F., Almeida, C.M.V.B., Bonilla, S.H., 2010. Comparing emergy accounting with wellknown sustainability metrics: The case of Southern Cone Common Market, Mercosur. Energy Policy 38, 3518-3526.
1833 1834 1835
Giugliano, M., Cernuschi, S., Grosso, M., Rigamonti, L., 2011. Material and energy recovery in integrated waste management systems. An evaluation based on life cycle assessment. Waste Management 31, 2092-2101.
1836 1837
Gluch, P., Baumann, H., 2004. The life cycle costing (LCC) approach: a conceptual discussion of its usefulness for environmental decision-making. Building and Environment 39, 571-580.
1838 1839
Gómez-Baggethun, E., Ruiz-Pérez, M., 2011. Economic valuation and the commodification of ecosystem services. Progress in Physical Geography 35, 613-628.
1840 1841
Graedel, T., Allenby, B., 2003. Industrial Ecology. 1995. Prentice Hall, Englewood Cliffs, New Jersey 7632, 83-187.
1842 1843
Gregson, N., Crang, M., 2015. Waste, Resource Recovery and Labour, in: Michie, J., Cooper, C. (Eds.), Why the Social Sciences Matter. Palgrave Macmillan, pp. 60–76.
AC C
EP
TE D
M AN U
SC
RI PT
1801 1802
64
ACCEPTED MANUSCRIPT Gregson, N., Crang, M., Fuller, S., Holmes, H., 2015. Interrogating the circular economy: the moral economy of resource recovery in the EU. Economy and Society 44, 218-243.
1846
GRI, 2013. Reporting Principles and standard disclosure.
1847 1848
Gu, L., Lin, B., Zhu, Y., Gu, D., Huang, M., Gai, J., 2008. Integrated assessment method for building life cycle environmental and economic performance. Building Simulation 1, 169-177.
1849 1850 1851
Guinée, J.B., Heijungs, R., Huppes, G., Zamagni, A., Masoni, P., Buonamici, R., Ekvall, T., Rydberg, T., 2011. Life Cycle Assessment: Past, Present, and Future. Environmental Science & Technology 45, 90-96.
1852 1853 1854
Gundersen, T., 2009. An introduction to the concept of exegy and energy quality, Energy and Process Engineering Department of Energy and Process Engineering, Norwegian University of Science and Technology, Trondheim, Norway.
1855 1856
Gunn, J.S., Ganz, D.J., Keeton, W.S., 2012. Biogenic vs. geologic carbon emissions and forest biomass energy production. GCB Bioenergy 4, 239-242.
1857 1858
Gutowski, T.G., Sahni, S., Boustani, A., Graves, S.C., 2011. Remanufacturing and Energy Savings. Environmental Science & Technology 45, 4540-4547.
1859 1860 1861
Haas, W., Krausmann, F., Wiedenhofer, D., Heinz, M., 2015. How Circular is the Global Economy?: An Assessment of Material Flows, Waste Production, and Recycling in the European Union and the World in 2005. Journal of Industrial Ecology 19, 765-777.
1862
Hanley, N., Spash, C.L., 1993. Cost-benefit analysis and the environment. Edward Elgar Aldershot.
1863 1864
Hatcher, G.D., Ijomah, W.L., Windmill, J.F.C., 2011. Design for remanufacture: a literature review and future research needs. Journal of Cleaner Production 19, 2004-2014.
1865 1866
Hatcher, G.D., Ijomah, W.L., Windmill, J.F.C., 2013. Integrating design for remanufacture into the design process: the operational factors. Journal of Cleaner Production 39, 200-208.
1867 1868 1869
Heijungs, R., 2011. Ecodesign — Carbon Footprint — Life Cycle Assessment — Life Cycle Sustainability Analysis. A Flexible Framework for a Continuum of Tools. Scientific Journal of Riga Technical University. Environmental and Climate Technologies 4, 42–46.
1870 1871 1872
Heijungs, R., Settanni, E., Guinée, J., 2012. Toward a computational structure for life cycle sustainability analysis: unifying LCA and LCC. The International Journal of Life Cycle Assessment 18, 1722-1733.
1873 1874
Hellweg, S., Milà i Canals, L., 2014. Emerging approaches, challenges and opportunities in life cycle assessment. Science 344, 1109-1113.
1875 1876
Henderson, R.K., Constable, D.J., Jiménez‐González, C., 2010. Green chemistry metrics. Green chemistry in the pharmaceutical industry, 21-48.
1877
Herring, H., 2006. Energy efficiency—a critical view. Energy 31, 10-20.
1878 1879
Hertwich, E.G., Peters, G.P., 2009. Carbon Footprint of Nations: A Global, Trade-Linked Analysis. Environmental Science & Technology 43, 6414-6420.
1880 1881 1882
Hille, J., 1997. The Concept of Environmental Space, Implications for Policies, Environmental Reporting and Assessments. European Environment Agency, Luxembourg: Office for Official Publications of the European Communities, 1997.
1883 1884
Hoekstra, A.Y., Wiedmann, T.O., 2014. Humanity’s unsustainable environmental footprint. Science 344, 1114-1117.
1885 1886
Hoet, P.H., Brüske-Hohlfeld, I., Salata, O.V., 2004. Nanoparticles–known and unknown health risks. Journal of nanobiotechnology 2, 12.
AC C
EP
TE D
M AN U
SC
RI PT
1844 1845
65
ACCEPTED MANUSCRIPT Hofstetter, P., Müller-Wenk, R., 2005. Monetization of health damages from road noise with implications for monetizing health impacts in life cycle assessment. Journal of Cleaner Production 13, 1235-1245.
1890 1891 1892
Hotta, Y., Visvanathan, C., 2014. Indicators Based On Material Flow Analysis/Accounting (MFA) And Resource Productivity, 3R Policy Indicators Factsheet Series. Institute for Global Environmental Studies (IGES), Japan.
1893 1894
Hovelius, K., 1997. Energy-, exergy-and emergy analysis of biomass production, Technical report. Department of Energy and Technology, University of Uppsala, Uppsala.
1895
HSE, 2016. Statistics on fatal injuries in the workplaceat Britain 2016. Health and Safety Executive.
1896 1897 1898
Huysman, S., Debaveye, S., Schaubroeck, T., Meester, S.D., Ardente, F., Mathieux, F., Dewulf, J., 2015. The recyclability benefit rate of closed-loop and open-loop systems: A case study on plastic recycling in Flanders. Resources, Conservation and Recycling 101, 53-60.
1899 1900 1901
Iacovidou, E., Hahladakis, J., Deans, I., Velis, C., Purnell, P., 2017a. Technical properties of biomass and solid recovered fuel (SRF) co-fired with coal: Impact of on multi-dimensional resource recovery value. Waste Management.
1902 1903 1904
Iacovidou, E., Millward-Hopkins, J., Busch, B., Purnell, P., Velis, C.A., Hahladakis, J., Zwirner, O.J., Brown, A., under review. A pathway to circular economy: Developing a conceptual framework for complex value assessment of resources recovered from waste Journal of Cleaner Production.
1905 1906 1907
Iacovidou, E., Purnell, P., 2016. Mining the physical infrastructure: Opportunities, barriers and interventions in promoting structural components reuse. Science of The Total Environment 557–558, 791-807.
1908 1909 1910
Iacovidou, E., Purnell, P., Lim, M.K., 2017b. The use of smart technologies in enabling construction components reuse: A viable method or a problem creating solution? (In Press). Journal of Environmental Management.
1911 1912 1913
Iacovidou, E., Velenturf, A., 2016. Importance of Quality in Waste Management, Resource Recovery from Waste programme. Resource Recovery from Waste programme, https://rrfw.org.uk/results/blogs/.
1914
IChemE, 2001. The Sustainability Metrics: Sustainable development Progress Metrics.
1915 1916 1917
Ijomah, W.L., McMahon, C.A., Hammond, G.P., Newman, S.T., 2007. Development of robust design-for-remanufacturing guidelines to further the aims of sustainable development. International Journal of Production Research 45, 4513-4536.
1918 1919 1920
Ingwersen, W., Cabezas, H., Weisbrod, A.V., Eason, T., Demeke, B., Ma, X., Hawkins, T.R., Lee, S.J., Bare, J.C., Ceja, M., 2014. Integrated metrics for improving the life cycle approach to assessing product system sustainability. Sustainability 6, 1386-1413.
1921 1922
IPCC, 2007. IPCC Fourth Assessment Report: Climate Change 2007. Intergovernmental Panel on Climate Change, Cambridge.
1923 1924
Ismail, N.H., Mandil, G., Zwolinski, P., 2014. A remanufacturing process library for environmental impact simulations. Journal of Remanufacturing 4, 1-14.
1925 1926
Jackson, T., 2016. Beyond Consumer Capitalism - Foundations for a Sustainable Prosperity Centre for the Understanding of Sustainable Prosperity (CUSP), Guildford: University of Surrey.
1927 1928
Jacquemin, L., Pontalier, P.Y., Sablayrolles, C., 2012. Life cycle assessment (LCA) applied to the process industry: a review. International Journal of Life Cycle Assessment 17, 1028-1041.
1929 1930
Jain, P., Pradeep, T., 2005. Potential of silver nanoparticle-coated polyurethane foam as an antibacterial water filter. Biotechnology and Bioengineering 90, 59-63.
AC C
EP
TE D
M AN U
SC
RI PT
1887 1888 1889
66
ACCEPTED MANUSCRIPT Joshi, S., 1999. Product environmental life‐cycle assessment using input‐output techniques. Journal of Industrial Ecology 3, 95-120.
1933 1934
Junnila, S., 2008. Life cycle management of energy-consuming products in companies using IO-LCA. The International Journal of Life Cycle Assessment 13, 432-439.
1935 1936 1937
Kaufman, S.M., Krishnan, N., Themelis, N.J., 2010. A Screening Life Cycle Metric to Benchmark the Environmental Sustainability of Waste Management Systems. Environmental Science & Technology 44, 5949-5955.
1938 1939
Keeler, A.G., Renkow, M., 1994. Haul Trash or Haul Ash: Energy Recovery as a Component of Local Solid Waste Management. Journal of Environmental Economics and Management 27, 205-217.
1940 1941 1942
Kikuchi, R., Gerardo, R., 2009. More than a decade of conflict between hazardous waste management and public resistance: A case study of NIMBY syndrome in Souselas (Portugal). Journal of Hazardous Materials 172, 1681-1685.
1943 1944
Kim, S., Hwang, T., Lee, K.M., 1997. Allocation for cascade recycling system. The International Journal of Life Cycle Assessment 2, 217.
1945 1946 1947
Kirkeby, J.T., Birgisdottir, H., Hansen, T.L., Christensen, T.H., Bhander, G.S., Hauschild, M., 2006. Evaluation of environmental impacts from municipal solid waste management in the municipality of Aarhus, Denmark (EASEWASTE). Waste Management & Research 24, 16-26.
1948 1949 1950 1951
Kleywegt, S., Pileggi, V., Yang, P., Hao, C., Zhao, X., Rocks, C., Thach, S., Cheung, P., Whitehead, B., 2011. Pharmaceuticals, hormones and bisphenol A in untreated source and finished drinking water in Ontario, Canada — Occurrence and treatment efficiency. Science of The Total Environment 409, 1481-1488.
1952 1953
Klinghoffer, N.B., Castaldi, M., 2014. Waste to Energy Conversion Technology, 1st ed. Woodhead Publishing.
1954 1955
Klöpffer, W., 2003. Life-Cycle based methods for sustainable product development. The International Journal of Life Cycle Assessment 8, 157-159.
1956 1957
Knight, P., Jenkins, J.O., 2009. Adopting and applying eco-design techniques: a practitioners perspective. Journal of Cleaner Production 17, 549-558.
1958 1959
Kondili, E., 2005. Review of optimization models in the pollution prevention and control. Computer Aided Chemical Engineering 20, 1627-1632.
1960 1961
Kothari, R., Tyagi, V.V., Pathak, A., 2010. Waste-to-energy: A way from renewable energy sources to sustainable development. Renewable and Sustainable Energy Reviews 14, 3164-3170.
1962 1963
Krajnc, D., Glavič, P., 2003. Indicators of sustainable production. Clean Techn Environ Policy 5, 279288.
1964 1965
Krogmann, U., Woyczechowski, H., 2000. Selected characteristics of leachate, condensate and runoff released during composting of biogenic waste. Waste Management and Research 18, 235-248.
1966 1967
Kümmerer, K., 2003. Significance of antibiotics in the environment. Journal of Antimicrobial Chemotherapy 52, 5-7.
1968 1969
Labuschagne, C., Brent, A.C., van Erck, R.P.G., 2005. Assessing the sustainability performances of industries. Journal of Cleaner Production 13, 373-385.
1970 1971 1972
Laurent, A., Bakas, I., Clavreul, J., Bernstad, A., Niero, M., Gentil, E., Hauschild, M.Z., Christensen, T.H., 2014. Review of LCA studies of solid waste management systems - Part I: Lessons learned and perspectives. Waste Management 34, 573-588.
1973 1974
Leal, W., Schultz, C., Gottwald, J., Weisleder, S., 2006. Construction and demolition waste management in Germany, EU-ASIA PRO ECO II B Post-Tsunami Programme.
AC C
EP
TE D
M AN U
SC
RI PT
1931 1932
67
ACCEPTED MANUSCRIPT Lee, K.-H., 2011. Integrating carbon footprint into supply chain management: the case of Hyundai Motor Company (HMC) in the automobile industry. Journal of Cleaner Production 19, 1216-1223.
1977 1978 1979
Lehmann, A., Bach, V., Finkbeiner, M., 2015. Product environmental footprint in policy and market decisions: Applicability and impact assessment. Integrated Environmental Assessment and Management 11, 417-424.
1980 1981
Leu, H.-G., H. Lin, S., 1998. Cost–benefit analysis of resource material recycling. Resources, Conservation and Recycling 23, 183-192.
1982 1983
Levasseur, A., Brandão, M., Lesage, P., Margni, M., Pennington, D., Clift, R., Samson, R., 2012. Valuing temporary carbon storage. Nature Climate Change 2, 6-8.
1984 1985
Liu, H., Polenske, K.R., Guilhoto, J.J.M., Xi, Y., 2014. Direct and indirect energy use in China and the United States. Energy 71, 414-420.
1986 1987
Longden, D., Brammer, J., Bastin, L., Cooper, N., 2007. Distributed or centralised energy-from-waste policy? Implications of technology and scale at municipal level. Energy Policy 35, 2622-2634.
1988 1989
Lund, R.T., Mundial, B., 1984. Remanufacturing: The experience of the United States and implications for developing countries. World Bank.
1990 1991 1992
Lyytimäki, J., Tapio, P., Varho, V., Söderman, T., 2013. The use, non-use and misuse of indicators in sustainability assessment and communication. International Journal of Sustainable Development & World Ecology 20, 385-393.
1993 1994
Machado, G., Schaeffer, R., Worrell, E., 2001. Energy and carbon embodied in the international trade of Brazil: an input–output approach. Ecological Economics 39, 409-424.
1995
MacKie, P., 2010. Cost-Benefit Analysis in Transport.
1996 1997 1998
Manfredi, S., Allacker, K., Chomkhamsri, K., Pelletier, N., de Souza, D.M., Leader, A., 2012. Deliverable 2 and 4A of the Administrative Arrangement between DG Environment and the Joint Research Centre No N 070307/2009/552517, including Amendment No 1 from December 2010.
1999 2000 2001 2002
Mathieux, F., Froelich, D., Moszkowicz, P., 2001. Development of recovery indicators to be used during product design process: method, potentialities and limits, Environmentally Conscious Design and Inverse Manufacturing, 2001. Proceedings EcoDesign 2001: Second International Symposium on, pp. 281-286.
2003 2004 2005
Mathieux, F., Froelich, D., Moszkowicz, P., 2008. ReSICLED: a new recovery-conscious design method for complex products based on a multicriteria assessment of the recoverability. Journal of Cleaner Production 16, 277-298.
2006 2007
Matthews, H.S., Hendrickson, C.T., Weber, C.L., 2008. The Importance of Carbon Footprint Estimation Boundaries. Environmental Science & Technology 42, 5839-5842.
2008 2009 2010 2011
Minx, J.C., Wiedmann, T., Wood, R., Peters, G.P., Lenzen, M., Owen, A., Scott, K., Barrett, J., Hubacek, K., Baiocchi, G., Paul, A., Dawkins, E., Briggs, J., Guan, D., Suh, S., Ackerman, F., 2009. Input–output analysis and carbon footprinting: An overview of applications. Economic Systems Research 21, 187-216.
2012 2013 2014
Monfreda, C., Wackernagel, M., Deumling, D., 2004. Establishing national natural capital accounts based on detailed Ecological Footprint and biological capacity assessments. Land Use Policy 21, 231246.
2015 2016
Morrissey, A.J., Browne, J., 2004. Waste management models and their application to sustainable waste management. Waste Management 24, 297-308.
2017 2018
Murray, A., Skene, K., Haynes, K., 2015. The Circular Economy: An Interdisciplinary Exploration of the Concept and Application in a Global Context. Journal of Business Ethics, 1-12.
AC C
EP
TE D
M AN U
SC
RI PT
1975 1976
68
ACCEPTED MANUSCRIPT Najm, M.A., El-Fadel, M., Ayoub, G., El-Taha, M., Al-Awar, F., 2002. An optimisation model for regional integrated solid waste management II. Model application and sensitivity analyses. Waste Management & Research 20, 46-54.
2022 2023
Nässén, J., Holmberg, J., Wadeskog, A., Nyman, M., 2007. Direct and indirect energy use and carbon emissions in the production phase of buildings: An input–output analysis. Energy 32, 1593-1602.
2024 2025
Ness, B., Urbel-Piirsalu, E., Anderberg, S., Olsson, L., 2007. Categorising tools for sustainability assessment. Ecological Economics 60, 498-508.
2026 2027
Nishimura, K., Hondo, H., Uchiyama, Y., 1997. Estimating the embodied carbon emissions from the material content. Energy Conversion and Management 38, Supplement, S589-S594.
2028 2029
Norris, G.A., 2001. Integrating life cycle cost analysis and LCA. The International Journal of Life Cycle Assessment 6, 118-120.
2030 2031
Nuortio, T., Kytöjoki, J., Niska, H., Bräysy, O., 2006. Improved route planning and scheduling of waste collection and transport. Expert Systems with Applications 30, 223-232.
2032 2033
Ochoa, L., Hendrickson, C., Matthews, H., 2002. Economic Input-output Life-cycle Assessment of U.S. Residential Buildings. Journal of Infrastructure Systems 8, 132-138.
2034 2035
Odum, H.T., Peterson, N., 1996. Simulation and evaluation with energy systems blocks. Ecological Modelling 93, 155-173.
2036
OECD, 2003. Glossary of Statistical Terms. On line at: http://stats.oecd.org/glossary/detail.asp.
2037 2038
OECD/IEA, 2005. Energy statistics manual. OECD/IEA, Cedex, France, Online at: http://www.oecdilibrary.org/energy/energy-statistics-manual_9789264033986-en, Paris, France.
2039 2040
Oppelt, E.T., 1987. Incineration of hazardous waste, a critical review. Journal of Air & Waste Management Association (JAPCA) 37, 558–586.
2041 2042
Östlin, J., Sundin, E., Björkman, M., 2009. Product life-cycle implications for remanufacturing strategies. Journal of Cleaner Production 17, 999-1009.
2043 2044
Øvergaard, S., 2008. Issue paper: Definition of primary and secondary energy. Statistics Norway, Oslo.
2045 2046
Park, J.Y., Chertow, M.R., 2014. Establishing and testing the “reuse potential” indicator for managing wastes as resources. Journal of Environmental Management 137, 45-53.
2047 2048 2049
Parkes, O., Lettieri, P., Bogle, I.D.L., 2015. Life cycle assessment of integrated waste management systems for alternative legacy scenarios of the London Olympic Park. Waste Management 40, 157166.
2050 2051
Patel, M., von Thienen, N., Jochem, E., Worrell, E., 2000. Recycling of plastics in Germany. Resources, Conservation and Recycling 29, 65-90.
2052
Patterson, M.G., 1996. What is energy efficiency? Energy Policy 24, 377-390.
2053 2054 2055
Perkoulidis, G., Papageorgiou, A., Karagiannidis, A., Kalogirou, S., 2010. Integrated assessment of a new Waste-to-Energy facility in Central Greece in the context of regional perspectives. Waste Management 30, 1395-1406.
2056 2057
Peters, G.P., 2010. Carbon footprints and embodied carbon at multiple scales. Current Opinion in Environmental Sustainability 2, 245-250.
2058 2059
Pickin, J., 2008. Representations of environmental concerns in cost–benefit analyses of solid waste recycling. Resources, Conservation and Recycling 53, 79-85.
2060 2061
Pires, A., Martinho, G., Chang, N.-B., 2011. Solid waste management in European countries: A review of systems analysis techniques. Journal of Environmental Management 92, 1033-1050.
AC C
EP
TE D
M AN U
SC
RI PT
2019 2020 2021
69
ACCEPTED MANUSCRIPT Powell, J., 2000. The Potential for Using Life Cycle Inventory Analysis in Local Authority Waste Management Decision Making. Journal of Environmental Planning and Management 43, 351-367.
2064 2065 2066 2067
Puckett, J., Byster, L., Westervelt, S., Gutierrez, R., Davis, S., Hussain, A., Dutta, M., 2002. Exporting Harm - The High-Tech Trashing of Asia. The Basel Action Network (BAN), Silicon Valley Toxics Coalition (SVTC) with contributions by Toxics Link India, SCOPE (Pakistan) and Greenpeace China.
2068 2069
Purnell, P., 2012. Material Nature versus Structural Nurture: The Embodied Carbon of Fundamental Structural Elements. Environmental Science & Technology 46, 454-461.
2070 2071
Quiggin, J., 1997. Discount rates and sustainability. International Journal of Social Economics 24, 6590.
2072 2073 2074
Rabl, A., Benoist, A., Dron, D., Peuportier, B., Spadaro, J.V., Zoughaib, A., 2007. How to account for CO2 emissions from biomass in an LCA. The International Journal of Life Cycle Assessment 12, 281281.
2075 2076
Ramoni, M.O., Zhang, H.-C., 2012. An entropy-based metric for product remanufacturability. Journal of Remanufacturing 2, 1-8.
2077 2078
Reddy, B.S., Ray, K.B., 2011. Understanding industrial energy use: Physical energy intensity changes in Indian manufacturing sector. Energy Policy 39, 7234-7243.
2079 2080
Renou, S., Givaudan, J.G., Poulain, S., Dirassouyan, F., Moulin, P., 2008. Landfill leachate treatment: Review and opportunity. Journal of Hazardous Materials 150, 468-493.
2081 2082 2083 2084 2085
Ridoutt, B., Fantke, P., Pfister, S., Bare, J., Boulay, A.-M., Cherubini, F., Frischknecht, R., Hauschild, M., Hellweg, S., Henderson, A., Jolliet, O., Levasseur, A., Margni, M., McKone, T., Michelsen, O., Milà i Canals, L., Page, G., Pant, R., Raugei, M., Sala, S., Saouter, E., Verones, F., Wiedmann, T., 2015. Making Sense of the Minefield of Footprint Indicators. Environmental Science & Technology 49, 2601-2603.
2086 2087
Rigamonti, L., Falbo, A., Grosso, M., 2013a. Improvement actions in waste management systems at the provincial scale based on a life cycle assessment evaluation. Waste Management 33, 2568-2578.
2088 2089
Rigamonti, L., Falbo, A., Grosso, M., 2013b. Improving integrated waste management at the regional level: The case of Lombardia. Waste Management & Research 31, 946-953.
2090 2091 2092
Ristimäki, M., Säynäjoki, A., Heinonen, J., Junnila, S., 2013. Combining life cycle costing and life cycle assessment for an analysis of a new residential district energy system design. Energy 63, 168179.
2093 2094 2095
Robotis, A., Boyaci, T., Verter, V., 2012. Investing in reusability of products of uncertain remanufacturing cost: The role of inspection capabilities. International Journal of Production Economics 140, 385-395.
2096 2097
Rodrigues, J.F.D., Lorena, A., Costa, I., Ribeiro, P., Ferrão, P., 2016. An Input-Output Model of Extended Producer Responsibility. Journal of Industrial Ecology, n/a-n/a.
2098 2099 2100
Saavalainen, P., Kabra, S., Turpeinen, E., Oravisjrvi, K., Yadav, G.D., Keiski, R.L., Pongrcz, E., 2015. Sustainability Assessment of Chemical Processes: Evaluation of Three Synthesis Routes of DMC. Journal of Chemistry 2015, 12.
2101 2102
Schaeffer, R., Wirtshafter, R.M., 1992. An exergy analysis of the Brazilian economy: From energy production to final energy use. Energy 17, 841-855.
2103 2104
Scheutz, C., Kjeldsen, P., Gentil, E., 2009. Greenhouse gases, radiative forcing, global warming potential and waste management — an introduction. Waste Management & Research 27, 716-723.
2105
Schmidt-Bleek, F., 2008. Factor 10: The future of stuff. Sustainability: Science, Practice, & Policy 4.
AC C
EP
TE D
M AN U
SC
RI PT
2062 2063
70
ACCEPTED MANUSCRIPT Schulz, N.B., 2010. Delving into the carbon footprints of Singapore—comparing direct and indirect greenhouse gas emissions of a small and open economic system. Energy Policy 38, 4848-4855.
2108 2109
Schwarz, J., Beloff, B., Beaver, E., 2002. Use sustainability metrics to guide decision-making. Chemical Engineering Progress 98, 58-63.
2110 2111
Seadon, J.K., 2010. Sustainable waste management systems. Journal of Cleaner Production 18, 16391651.
2112 2113
Siitonen, S., Tuomaala, M., Ahtila, P., 2010. Variables affecting energy efficiency and CO2 emissions in the steel industry. Energy Policy 38, 2477-2485.
2114 2115
Silva, A., Stocker, L., Mercieca, P., Rosano, M., 2016. The role of policy labels, keywords and framing in transitioning waste policy. Journal of Cleaner Production 115, 224-237.
2116 2117
Singh, R.K., Murty, H.R., Gupta, S.K., Dikshit, A.K., 2012. An overview of sustainability assessment methodologies. Ecological Indicators 15, 281-299.
2118 2119
Slaper, T.F., Hall, T.J., 2011. The triple bottom line: what is it and how does it work? Indiana Business Review 86, 4.
2120 2121
Smith, A., Brown, K., Ogilvie, S., Rushton, K., Bates, J., 2001. Waste Management Options and Climate Change: Final Report. AEA Technology, European Commission.
2122 2123
Sonesson, U., 2000. Modelling of waste collection - a general approach to calculate fuel consumption and time. Waste Management & Research 18, 115-123.
2124 2125
Sonnemann, G., Castells, F., Schuhmacher, M., Hauschild, M., 2003. Integrated life-cycle and risk assessment for industrial processes. The International Journal of Life Cycle Assessment 9, 206-207.
2126 2127 2128
Stanisavljevic, N., Brunner, P.H., 2014. Combination of material flow analysis and substance flow analysis: A powerful approach for decision support in waste management. Waste Management & Research 32, 733-744.
2129 2130
Steenkamer, D.A., Sullivan, J.L., 1997. Recycled content in polymer matrix composites through the use of A-glass fibers. Polymer Composites 18, 300-312.
2131 2132
Stiglitz, J.E., Sen, A., Fitoussi, J.-P., 2009. Report by the Commission on the Measurement of Economic Performance and Social Progress.
2133 2134 2135
Stranddorf, H., Hoffmann, L., Schmidt, A., 2005. Update on impact categories, normalisation and weighting in LCA-selected EDIP97-data. Danish Environmental Protection Agency, Environmental Project.
2136 2137
Stranddorf, H.K., Hoffmann, L., Schmidt, A., 2006. Impact categories, normalisation and weighting in LCA. Danish Ministry of the Environment, Environmental Protection Agency, Denmark.
2138 2139
Strobant, C., 2015. Alternative methods for the disposal of biodegradable waste: a cost analysis, Dept. of Economics, Uppsala: SLU. Uppsala University, Uppsala (Sweden).
2140 2141
Sudhir, V., Muraleedharan, V.R., Srinivasan, G., 1996. Integrated solid waste management in Urban India: A critical operational research framework. Socio-Economic Planning Sciences 30, 163-181.
2142 2143
Székely, F., Knirsch, M., 2005. Responsible Leadership and Corporate Social Responsibility:: Metrics for Sustainable Performance. European Management Journal 23, 628-647.
2144 2145
Tabone, M.D., Cregg, J.J., Beckman, E.J., Landis, A.E., 2010. Sustainability Metrics: Life Cycle Assessment and Green Design in Polymers. Environmental Science & Technology 44, 8264-8269.
2146 2147
Tanzil, D., Beloff, B.R., 2006. Assessing impacts: Overview on sustainability indicators and metrics. Environmental Quality Management 15, 41-56.
2148 2149
Tavares, G., Zsigraiova, Z., Semiao, V., Carvalho, M.G., 2009. Optimisation of MSW collection routes for minimum fuel consumption using 3D GIS modelling. Waste Management 29, 1176-1185.
AC C
EP
TE D
M AN U
SC
RI PT
2106 2107
71
ACCEPTED MANUSCRIPT Thames Water, 2016. Abstractions and low flows, Ensuring sufficient water resources. Thames Water Utilities Limited., Reading, Berkshire.
2152 2153
Thormark, C., 2000. Including recycling potential in energy use into the life-cycle of buildings. Building Research & Information 28, 176-183.
2154 2155
Truitt, M.M., Liebman, J.C., Kruse, C.W., 1969. Simulation Model of Urban Refuse Collection. Journal of the Sanitary Engineering Division 95, 289-298.
2156 2157 2158
Turner, D.A., Williams, I.D., Kemp, S., 2016. Combined material flow analysis and life cycle assessment as a support tool for solid waste management decision making. Journal of Cleaner Production 129, 234-248.
2159 2160 2161
Ulgiati, S., Ascione, M., Bargigli, S., Cherubini, F., Franzese, P.P., Raugei, M., Viglia, S., Zucaro, A., 2011. Material, energy and environmental performance of technological and social systems under a Life Cycle Assessment perspective. Ecological Modelling 222, 176-189.
2162
UN, 2016. Child Labour. United Nations, Resources for speakers on glabl issues.
2163 2164
UNCED, 1992 AGENDA 21. United Nations Conference on Environment and Development, Rio de Janeiro. https://sustainabledevelopment.un.org/content/documents/Agenda21.pdf
2165 2166
UNEP, 2010. Waste and Climate Change: Global trends and strategy framework. United Nations Environment Programme, Osaka, Shiga
2167 2168 2169
UNEP, ISWA, 2015. Global Waste Management Outlook, in: Wilson, D.C., Authors: Wilson DC, Rodic L, Modak, P, S.R., Carpintero A, Velis CA, Iyer M and Simonett O. (Eds.). United Nations Environment Programme (UNEP) and International Solid Waste Association (ISWA), Vienna.
2170 2171
UNEP, SETAC, 2009. Guidelines for Social Life Cycle Assessment of Products. United Nations Environment Programme, Nairobi.
2172 2173
UNEP, SETAC, 2011. Towards a life cycle sustainability assessment: Making informed choices on products. UNEP DTIE Sustainable Consumption and Production Branch.
2174 2175 2176 2177
UNEP/WHO, 1996. Chapter 6 - Field Testing Methods, in: Ballance, J.B.a.R. (Ed.), Water Quality Monitoring - A Practical Guide to the Design and Implementation of Freshwater Quality Studies and Monitoring Programmes. United Nations Environment Programme and the World Health Organization.
2178 2179
UNICEF, 2005. End Child Exploitation: Child labour today. UNICEF, Available at: http://www.darvag.com/jamiat/bultan/Child-Labour-today.pdf.
2180 2181
US EPA, 2006. Solid Waste Management and Greenhouse Gases: A Life-Cycle Assessment of Emissions and Sinks. US EPA.
2182 2183 2184
US EPA, 2014. Framework for assessing biogenic CO2 emissions from stationary sources. United States Environmental Protection Agency, Office of Air and Radiation Office of Atmospheric Programs, Climate Change Division.
2185 2186 2187
van Kempen, L., 2003. The world of consumption: The material and cultural revisited by Ben Fine (Routledge: London and New York, 2002, 2nd edn, pp. xiv + 313). Journal of International Development 15, 1131-1132.
2188 2189
Varouchakis, E.A., Palogos, I., Karatzas, G.P., 2016. Application of Bayesian and cost benefit risk analysis in water resources management. Journal of Hydrology 534, 390-396.
2190 2191 2192
Velis, C.A., 2014. Global recycling markets - plastic waste: A story for one player – China, Globalisation and Waste Management Task Force. Report prepared by FUELogy and formatted by Dwaste on behalf of International Solid Waste Association, Vienna.
2193 2194
Velis, C.A., 2015. Circular economy and global secondary material supply chains. Waste Management & Research 33, 389-391.
AC C
EP
TE D
M AN U
SC
RI PT
2150 2151
72
ACCEPTED MANUSCRIPT Velis, C.A., Wilson, D.C., Rocca, O., Smith, S.R., Mavropoulos, A., Cheeseman, C.R., 2012. An analytical framework and tool (‘InteRa’) for integrating the informal recycling sector in waste and resource management systems in developing countries. Waste Management & Research 30, 43-66.
2198 2199
Venetoulis, J., Talberth, J., 2008. Refining the ecological footprint. Environment, Development and Sustainability 10, 441-469.
2200 2201
Vogtländer, J.G., Brezet, H.C., Hendriks, C.F., 2001. Allocation in recycling systems. The International Journal of Life Cycle Assessment 6, 344.
2202 2203
Wackernagel, M., Rees, W., 1998. Our ecological footprint: reducing human impact on the earth. New Society Publishers.
2204 2205
Wall, G., 1977. Exergy: A Useful Concept Within Resource Accounting. Institute of Theoretical Physics, Chalmers University of Technology and University of Göteborg, Göteborg, Sweden.
2206
Wall, G., 1990. Exergy conversion in the Japanese society. Energy 15, 435-444.
2207
Wall, G., Sciubba, E., Naso, V., 1994. Exergy use in the Italian society. Energy 19, 1267-1274.
2208 2209 2210
Wall, J.A., Cotts, D.B., Frederickson, A.R., 1986. Required Properties of Dielectric Materials, Spacecraft Dielectric Material Properties and Spacecraft Charging. American Institute of Aeronautics and Astronautics, pp. 1-2.
2211 2212 2213
Wang, Y., Geng, S., Zhao, P., Du, H., He, Y., Crittenden, J., 2016. Cost–benefit analysis of GHG emission reduction in waste to energy projects of China under clean development mechanism. Resources, Conservation and Recycling 109, 90-95.
2214 2215
WBCSD, 2000. Eco-efficiency - Creating more value with less impact. World Business Council for Sustainable Development (WBCSD), Geneva, Switzerland.
2216 2217
Weinstein, P.E., 2006. Waste-to-energy as a key component of integrated solid waste management for Santiago, Chile: A cost-benefit analysis. Citeseer.
2218 2219
Wernick, I.K., Ausubel, J.H., 1995. National material metrics for industrial ecology. Resources Policy 21, 189-198.
2220 2221
Wiedmann, T., 2009. Editorial: Carbon Footprint and Input–Output Analysis – An Introduction. Economic Systems Research 21, 175-186.
2222 2223
Wiedmann, T., Barrett, J., 2010. A review of the ecological footprint indicator—perceptions and methods. Sustainability 2, 1645-1693.
2224 2225
Wiedmann, T., Minx, J., 2008. A definition of ‘carbon footprint’. Ecological economics research trends 1, 1-11.
2226 2227
Wilson, D.C., 1977. Strategy evaluation in planning of waste management to land-a critical review of the literature. Applied Mathematical Modelling 1, 205-217.
2228 2229 2230
Wilson, D.C., Rodic, L., Cowing, M.J., Velis, C.A., Whiteman, A.D., Scheinberg, A., Vilches, R., Masterson, D., Stretz, J., Oelz, B., 2015. ‘Wasteaware’benchmark indicators for integrated sustainable waste management in cities. Waste Management 35, 329-342.
2231 2232
Woodward, D.G., 1997. Life cycle costing—Theory, information acquisition and application. International Journal of Project Management 15, 335-344.
2233
World Steel Association, 2010. Life cycle assessment in the steel industry World Steel Association.
2234 2235 2236
Worrell, E., van Heijningen, R.J.J., de Castro, J.F.M., Hazewinkel, J.H.O., de Beer, J.G., Faaij, A.P.C., Vringer, K., 1994. New gross energy-requirement figures for materials production. Energy 19, 627-640.
AC C
EP
TE D
M AN U
SC
RI PT
2195 2196 2197
73
ACCEPTED MANUSCRIPT WRAP, 2008a. Reclaimed building products guide - A guide to procuring reclaimed building products and materials for use in construction projects, Practical solutions for sustainable construction. Waste & Resources Action Programme, Banbury, Oxon, UK.
2240 2241 2242
WRAP, 2008b. Recyclability efficiency metric - Development of options for setting client procurement requirements for recyclability in construction projects, Practical solutions for sustainable construction. Waste & Resources Action Programme, Banbury, Oxon, UK.
2243 2244
WRAP, 2010a. Environmental benefits of recycling – 2010 update Bio Intelligence Service and the Copenhagen Resource Institute Banbury, UK.
2245 2246
WRAP, 2010b. Scoping study into food grade polypropylene recycling, in: (WRAP), W.R.A.P. (Ed.). Waste & Resources Action Programme (WRAP), London.
2247 2248
WRI/WBCSD, 2011. Greenhouse Gas Protocol: Product Life Cycle Accounting and Reporting Standard. World Resources Institute and World Business Council for Sustainable Development USA.
2249 2250
Wu, C.Z., Huang, H., Zheng, S.P., Yin, X.L., 2002. An economic analysis of biomass gasification and power generation in China. Bioresource Technology 83, 65-70.
2251
Wu, R., Yang, D., Chen, J., 2014. Social life cycle assessment revisited. Sustainability 6, 4200-4226.
2252 2253 2254
Yuan, H.P., Shen, L.Y., Hao, J.J.L., Lu, W.S., 2011. A model for cost–benefit analysis of construction and demolition waste management throughout the waste chain. Resources, Conservation and Recycling 55, 604-612.
2255 2256
Zaman, A.U., 2014. Identification of key assessment indicators of the zero waste management systems. Ecological Indicators 36, 682-693.
2257 2258 2259
Zhang, Y., Baral, A., Bakshi, B.R., 2010. Accounting for Ecosystem Services in Life Cycle Assessment, Part II: Toward an Ecologically Based LCA. Environmental Science & Technology 44, 2624-2631.
2260 2261
Ziout, A., Azab, A., Atwan, M., 2014. A holistic approach for decision on selection of end-of-life products recovery options. Journal of Cleaner Production 65, 497-516.
2262 2263
Zurbrügg, C., Caniato, M., Vaccari, M., 2014. How Assessment Methods Can Support Solid Waste Management in Developing Countries—A Critical Review. Sustainability 6, 545.
SC
M AN U
TE D
EP AC C
2264
RI PT
2237 2238 2239
74
ACCEPTED MANUSCRIPT
RI PT
SC M AN U
•
TE D
•
EP
•
Comprehensive review of metrics for assessing resource recovery from waste in a circular economy considering all four key domains of value: environmental, economic, social and technical. Suitability of the individual metrics for incorporation into a systems analysis tool based on material flows was assessed. Whereas the environmental aspects seem to have revived most emphasis to date, technical feasibility and value of resource recovery is insufficiently described by generic metrics. Room for categorization (typology) of metrics, invention of more specific metrics relevant to resource recovery from waste within a circular economy, with uncertainty quantification and considering the between metrics interactions.
AC C
•