quires the design of new software development and business processes. Large scale component reuse leads to savings in development resources, enabling ...
Metria-Guided Quality Management for Component-Based Software Systems Sahra Sedigh-Ali and Arif Ghafoor School of Electrical and Computer Engineering Purdue University West Lafayette, IN 47907-1285 { sedigh,ghafoor}@ ecn .purdue.edu
Abstract
to system components or integration code, which are necessary for conforming to changes in requirements or system design [4]. COTS component acquisition can reduce time to market by shifting developer resources from component-level development to integration. Increased modularity also facilitates rapid incremental delivery, allowing developers to release modules as they integrate them and offer product upgrades as various components evolve. These advantages bring related disadvantages, including integration difficulties, performance constraints, and incompatibility among products from different vendors. Further, relying on COTS components increases the systems vulnerability to risks arising from third-party development, such as vendor longevity and intellectual-property procurement. Component performance and reliability also vary because component-level testing may be limited to black-box tests, and inherently biased vendor claims may be the only source of information [ 15, 4, 131. Such issues limit COTS component use to noncritical systems that require low to moderate quality. Systems that require high quality cannot afford the risks associated with employing these components [23,27]. One way of alleviating such concerns is by using software metrics to guide quality and risk management in a Component-Based System (CBS), accurately quantifying various factors contributing to the overall quality, and identifying and eliminating sources of risk. Metrics can also be used in guiding decisions throughout the software life cycle, determining whether software quality improvement initiatives are financially worthwhile [ 19, 22, 241. In this paper, we outline research addressing the issues of cost and quality management in CBSs. As in any development or manufacturing process, software quality is achieved at a cost. Our research uses metrics to quantify the concept of quality, aiming to investigate the tradeoff between cost and quality, and using the information gained to guide quality management. In the remainder of this paper, we describe the details of our research, and the approaches we are pursuing. Section 2 provides a summary of related research. Sec-
The growing reliance on Commercial-Off-The-Shelf (COTS) components for developing large-scale projects introduces a new paradigm in software engineering, which requires the design of new software development and business processes. Large scale component reuse leads to savings in development resources, enabling these resources to be applied to areas such as quality improvement. These savings come at the price of integration dificulties, performance constraints, and incompatibility of components from multiple vendors. Relying on COTS Components also increases the system’s vulnerability to risks arising from third-parq development, which can negatively affect the quality of the system, us well as causing expenses not incurred in traditional software development. We aim to alleviate such concerns by using software nietrics to accurately quantijj factors contributing to the overall quality of a ComponentBased System (CBS), guiding quality and risk nianagement by identifiing and eliminating sources of risk,
1 Introduction The paradigm shift to Commercial-Off-The-Shelf (COTS) components appears inevitable, necessitating drastic changes to current software development and business practices [6, 71. With software development proceeding at Internet speed, in-house development of all system components may prove too costly in terms of both time and money. Large-scale component reuse or COTS component acquisition can generate savings in development resources, which can then be applied to quality improvement, including enhancements to reliability, availability, and ease of maintenance. Prudent component deployment can also localize the effects of changes made to a particular portion of the application, reducing the ripple effect of system modifications. This localization can increase system adaptability by facilitating modifications
0-7695-1372-7/01 $10.00 0 2001 IEEE
Raymond A. Paul Department of Defense, OASD/C3I Pentagon Washington, DC 20453 ray.pau1@ osd.pentagon.mil
303
of quality improvement initiatives. In other related work, the tradeoff between cost and reliability has been widely studied, and several formulations for optimizing software reliability have been proposed. In [ 121, system-level reliability has been evaluated as a function of component-level failure intensities, and the optimization problem seeks to minimize the total cost of achieving the desired reliability, by allocating specific failure intensities to the components. This is of interest to our work, as we seek to develop similar formulations for other software metrics.
tion 3 elaborates upon the identification and collection of software metrics. In Section 4,we describe software quality costs, and discuss models depicting the tradeoff between cost and quality in CBSs. Section 5 discusses our approach to metrics-based quality management for software systems. The final section, sumrnarizes the preceding sections and describes the impact of the research in hand.
2 Related Work Considerable research has been conducted in software metrics in the past two decades, especially on reliability models, cost estimation, and application of software metrics [9, 16, 3, 211. The bulk of this research is restricted to traditional (non-component-based) software systems. In [22], a formal set of test and evaluation metrics is presented for traditional systems, which similar to our set, is comprised of management, requirements, and quality metrics. Both papers also investigate metrics-guided software reuse, which is related to quality management in our research, but the emphasis is on reuse decisions, not quality. [ 16, 31 conducts an assessment of the impact of reuse on quality and productivity in object-oriented systems. The metrics used are size, reusability, effort, productivity, and number of defects. These metrics can be used for CBSs, provided that the notion of size is suitably modified. Very little, if any, research has been conducted on the economics of quality in CBS development. Cost models for software reuse have been widely studied [2], but quality is largely ignored in these studies. In [ 171, an integrated cost model for software reuse is presented. This paper quantifies reuse decisions in economic terms, and evaluates their economic rationale by traditional investment analysis functions such as return on investment and net present value. The assessment is from a purely economic point of view, and quality plays no role in deciding for or against software reuse. COCOMO 2.0 [ 111 takes software reuse into account, and allows the use of Logical Lines of Code (LLOC) as the standard measure. This model has limited applicability to CBS, as COTS software, libraries, and auto-generated code are excluded when counting the LLOC, nonetheless, it can be used for estimating component-level cost factors. The Constructive COTS Model (COCOTS) [ 1, 51, an extension of COCOMO, addresses four sources of COTS software integration costs, namely, the costs of (1) assessing alternative components, (2) customizing the selected COTS components, (3) development and testing of middleware or integration code, and (4)increased risk management efforts. Quality attributes such as correctness, availabilityRobustness, and security are considered in the assessment phase, but do not reappear in other phases. The model we are currently developing can be applied at any stage of the life cycle, and is aimed at determining the value
3
Identification and Collection of Software Metrics for CBSs
In any development process, models depicting the relationship between costs and quality can be utilized to guide decisions regarding investments in quality improvement. In the case of CBSs, accurately representing the relationship between cost and quality can be particularly challenging, as can be the integration of component-level cost-quality models, or system-level models defined for an individual quality factor [12]. As in the case of traditional software environments, defining an appropriate set of software metrics can be the first step in developing cost-quality models.
3.1 Metrics for Component-Based Systems Central to the development of a CBS is the concept of a software component, which has various definitions in software engineering literature, including work by Hopkins [ 131, where a software component is defined as “a physical packaging of executable software with a well-defined and published interface.” This definition, as well as many others, stresses the requirement of well-defined interfaces for a component. The source code of most COTS components is inaccessible to the designers of systems deploying them, making highly structured interfaces essential for the success of the design. This leads to an important difference between metrics for CBSs and traditional systems, which is the unavailability of “size” as a metric. Most traditional metric sets incorporate the size of the source code, measured in Lines of Code (LOC) into several metrics. This size is generally not known for COTS components, hence, if a measure of program or component size is required, alternate measures can be used, such as the number of use cases supported by a given component, where a use case refers to a business task performed by the application [26]. Another difference is in the concept of time-to-market. The acquisition of components changes this concept, as their development time may not be known, and cannot be incorporated into time calculations in a straightforward manner. For CBSs, a simple delivery rate measure can be used in place
304
of the time-to-market measure. One proposed measure is based on the number of use cases divided by the elapsed time in months [26]. Metrics can guide risk and quality management, helping to reduce risks encountered during planning and execution of software development, resource and effort allocation, scheduling and execution, and product evaluation [22, 241. Risks can include performance issues, reliability, adaptability, and return on investment. Risk reduction can take many forms, such as using component wrappers or middleware, replacing components, relaxing system requirements, or even issuing legal disclaimers for certain failure-prone software features. Metrics let developers identify and isolate these risks, then take corrective action. The key to success is selecting appropriate metrics- especially metrics that provide measures applicable over the entire software cycle and that address both software processes and products. Selection criteria for the metrics set also include usefulness, clarity, and cost-effectiveness [ 191. Based on our previous research [22, 241, we propose a set of thirteen system-level metrics for CBS software engineering, as described in Table 1. These metrics help managers select appropriate components from a repository of software products and aid in deciding between using COTS components or developing new components. The primary considerations are cost, time to market, and product quality. We can divide these metrics into three categories: management, requirements, and quality. The management metrics include cost, time-to-market, system resource utilization, and software engineering environment. These metrics can be used for resource planning or other management tasks, or utilized by Enterprise Resource Planning (ERP) applications. The cost metric measures the overall expenses incurred during the course of software development. These expenses include the costs of component acquisition, integration, and quality improvements to the system. We discuss this metric in detail in the next section. The time-to-marketmetric is a measure of the time needed to release the product, from the beginning of development and COTS acquisition to delivery. This metric can also be modified to evaluate the speed of incremental delivery, by measuring the amount of time required to deliver a certain fraction of the overall application functionality. System resource utilization determines the percentage of target computer resources that will be consumed by the system. The software engineering environment metric is a measure of the capability of producing high quality software, and can be expressed in terms of the Software Acquisition Capability Maturity Model (SA-CMM) [ 101. The requirements metrics include measures of requirements conformance and requirements stability of the CBS, and enable monitoring of the specification, translation, and volatility of requirements, as well as the level of adherence
to the requirements. The quality metrics include adaptability, complexity of interfaces and integration, integration test coverage, endto-end test coverage, reliability, and customer satisfaction. Adaptability is a measure of the flexibility of the system, and evaluates the ability of the system to adapt to changes in requirements, whether as a result of system redesign, or to accommodate multiple applications. The complexity of interfaces and integration has also been chosen as a quality metric, as overly complex interfaces or integration code complicate testing, debugging, and maintenance, degrading the quality of the system. Two measures of test coverage are included in the metric set: integration test coverage, and end-to-end (E2E) test coverage, where each metric indicates the fraction of the system that has undergone the respective test. The reliability metric estimates the probability of fault-free operation of the system, and can be obtained by techniques similar to those used in traditional systems, including fault injection to the integration code. The fault projiles metric measures the cumulative number of detected faults. Finally, the customer satisfaction metric evaluates the degree to which the software has met the expectations and requirements of the customer. This metric can be estimated before final product delivery, using beta releases to estimate predictors of customer satisfaction. Sample predictors include schedule requirements, management maturity, culture of the customer, and marketplace and knowledge of the customer.
3.2 Relationships among Metrics The metrics we have proposed may not be independent of each other, and analyzing the relationships among them can yield valuable information for decision making regarding investments in quality improvement for CBSs. The most obvious relationship arises among the cost metric and quality metrics such as reliability. More subtle relationships among the metrics also exist. For instance, time-to-market is a critical management metric for many applications, as it may determine the commercial viability of the product. Delayed product releases due to extensions to phases such as testing and debugging will cause a loss of revenue, and in extreme cases, the market may be lost to a competitor with an earlier product release. Premature release of the product may lead to lower reliability. Analyzing the relationship among the time-to-market, test coverage, and reliability metrics can aid the selection of a suitable release schedule. One possible approach to modelling the relationships among metrics, which we are employing, are influence diagrams [18]. An injuence diagram is a network for probabilistic and decision analysis models. In order to con-
305
I Category 1
Management
-
EvaluatesMeasures
Metric
-
Total software development expenditure Time elapsed between start of development to delivery of software Capability of producing high quality software Utilization of target computer resources Adherence of integrated product to defined requirements Level of changes to established software requirements Ability of integrated system to adapt to changes in requirements
-c o s t
‘Time-to-market -:Software Engineering Environment -System Resource Utilization
:Requirements Conformance -
Requirements Stability
Adaptability -
Complexity of Interfaces and
-
integration Test Coverage
Fraction of the system that has undergone satisfactory integration testing Fraction of the system that has undergone satisfactory E2E testing Cumulative number of detected faults Probability of failure-free system operation Degree to which the software has met customer exDectations
-
End-to-End (E2E) Test Coverage -Fault Profiles -Reliability
(Customer Satisfaction
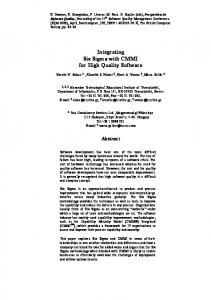
struct the influence diagram for our software metrics, we aggregate low level metrics such as requirements conformance and requiremenf s stability into higher level abstractions such as “requirements”, which represent quality or risk factors within the system. A preliminary influence diagram 1201 is presented in Figure l , and depicts the relationships among a subset of the metrics of Table 1. Vendor specifications for COTS components are often incomplete or unreliable, hence estimation techniques may be required for gathering metrics data from such components. The set of metrics we have proposed are defined at the system level. We are in the process of developing techniques for deriving system-level metrics from componentlevel information. Simj lar research has been conducted for the reliability metric, resulting in an expression for systemlevel reliability as a function of component-level fault densities [ 121. Estimation of COTS integration costs has also been performed in [14]. We will utilize both studies in developing accurate estimation techniques for the software metrics.
defined from several different perspectives, including the level of satisfaction of the customer, the key attributes of the software, or freedom from defects in the software’s operation. In metrics-guided quality management, software metrics are used to guide the allocation of resources to quality improvement initiatives. The Cost of Qualiv (Cue)determines the resources that can be dedicated to quality improvement in a project. In Table 1, CoQ is one component of the cost metric, and can be evaluated based on the costs of factors measured by the quality metrics. For example, increasing or maintaining reliability involves costs that can be considered the cost of reliability. The overall cost of quality is the sum of such costs and other costs that cannot be directly attributed to a factor measured by the quality metrics.
4.1
Modeling Tradeoffs between Cost and Quality
In any development process, models depicting the relationship between costs and quality can be utilized to guide decisions regarding investments in quality improvement. Such models have been discussed in economics and management literature [8] and generally depict a nonlinear relationship between CoQ and quality. Figure 2 depicts a general model of optimum quality costs. This model illustrates the relationship between the “cost per good unit of product” and the “quality of conformance” (expressed as a percent-
4 Modeling Cost and Quality in CBSs In deciding between in-house development and COTS component acquisition, the anticipated effect on system quality is an importanl: concern. Software quality can be
306
Figure 2. Optimum Quality Costs Model Source: Juran’s Quality Control Handbook, 4th Ed., by J. M. Juran and Frank M.Gryna. New York: McGraw-Hill Book Co., 1988.
Figure 1. Preliminary Influence Diagram for a Subset of the Software Metrics.
aforementioned challenges, and utilizing decision theory in management can lead to choices that are financially sound. Questions arising about investments in software quality improvement initiatives can be approached from a Return on Investment (ROI) perspective [25, 171. The ROI can be examined in terms of increased conformance to requirements such as reliability. We propose to use metrics to evaluate the quality improvement achieved as a result of a particular investment in software quality improvement initiatives.
age of total conformance), and accounts for recent technological developments that enable the achievement of very high quality (“perfection”) at finite costs. These models can be analyzed in terms of the quality metrics defined in the previous section. The horizontal axis, which represents quality of conformance in the original model, can be viewed as representing one of the quality metrics, such as adaptability and reliability. Accordingly, the vertical axis can represent a component of the CoQ, namely, the portion of quality costs dedicated to improving the quality factor corresponding to the metric represented by the horizontal axis. Intuitively, the same nonlinear relationship should hold. Increasing the investment in improving a certain quality factor should increase the value of the corresponding metric, and the amount of this increase should taper off as high quality levels are achieved. “Perfect” quality may not be achievable at finite costs, in particular in CBSs, where the quality and performance of the COTS components cannot be determined with certainty.
Cost-benefit analysis of traditional software systems [25, 81 concludes that quality improvements yield the greatest returns early in the life cycle. In CBSs, quality improvements are not possible during early stages of the development of the acquired components. To compensate for this problem, quality improvement efforts can be spread throughout the various stages of system design and development. In the design phase, such initiatives include identification of cost factors and cost-benefit analysis involving the unique risks associated with CBSs, determination of the level of architectural match between the application and the COTS components, and evaluation of the complexity and cost associated with integration, interoperability and middleware development. The metrics and models we have proposed can be used to guide these evaluations, with the objective of deciding between in-house development and COTS acquisition, and if the latter is chosen, selecting the most suitable component from a set of available alternatives. In the development phase, our proposed metricsbased cost-quality models can be used to estimate the costs associated with the traditional development process. During the entire life cycle, the models can guide the estimation
5 Metrics-Guided Quality Management A number of challenging issues hinder the development of CBSs [ 131, including component granularit),, specijicity, interoperubility, and qualit),, as discussed in Section 4. Software management decisions can involve any of the
307
of costs associated with the unique testing requirements of
[I 11 B. W. Boehm et. al. Cost models for future lifecycle processes: COCOMO 2.0. Annals of Software Engineering, 1:57-94, 1995. [ 121 M. E. Helander, M. Zhao, and N. Ohlsson. Planning models for software reliability and cost. IEEE Trans. on Software Eng., 24(6):420434, Jun. 1998. [13] J. Hopkins. Component primer. Comm. of the ACM, 43(10):27-30, Oct. 2000. [ 141 L. L. Jilani and A. Mili. Estimating COTS integration: An analytical approach. In Proc. 5th Maghrebian Con$ on Sofware Eng. and Artijcial Intelligence, Dec. 1998. [I51 J. McDermid. The cost of COTS. IEEE Computer, 31(6):46-52, Jun. 1998. [ 161 W. L. Melo, L. C. Briand, and V. R. Basili. Measuring the impact of reuse on software quality and productivity. Technical Report CS-TR-3395, Univ. of Maryland, College Park, MD, 1995. [ 171 A. Mili, S. F. Chmiel, R. Gottomukkala, and L.Zhang. An integrated cost model for software reuse. In Proc. 22nd Int’l Con$ on Software Eng. (ICSE ’OO), June 2000. [ 181 E Nadi et. al. Use of influence diagrams and neural networks in modeling semiconductor modeling processes. IEEE Transactions on Semiconductor Manufacturing, 4( 1):52-58, 1991. [I91 R. A. Paul. Metrics-guided reuse. Int’l J. on Artificial Intelligence Tools, 5(1 and 2):155-166, 1996. [20] R. A. Paul. Software Metrics. PhD thesis, School of Electrical Eng., Tokyo University, Tokyo, Japan, Jan. 1999. [21] R. A. Paul, A. Khan, and A. Ghafoor. A visual query interface for software metrics database. In Proc. 8th Int’l
COTS-based systems, such as integration, end-to-end, and thread testing. After delivery, cost metrics and models can be used for trend analysis of the COTS market.
6
Conclusions
Quality and risk concerns currently limit the application of COTS-based system design to noncritical applications. New approaches to quality and risk management will be needed to handle the growth of CBSs. The metrics-based approach and software engineering metrics presented in this paper can aid developers and managers in analyzing the return on investment in quality improvement initiatives for CBSs. These metrics also facilitate the modelling of cost and quality, although more complex models are needed to capture the intricate relationships between cost and quality metrics in a CBS. The findings can alleviate concerns about the risks associated with deploying COTS components in applications where quality is of importance and enable more wide-scale use of CBSs.
References [l] C. Abts. COTS software integration cost modeling study. Technical Report USC-CSE-98-520, University of Southern California, Los Angeles, 1998. [2] R. D. Banker, R. J. Kauffman, C. Wright, , and D. Zweig. Automating output s,ize and reuse metrics in a repositorybased computer-aided software engineering (case) environment. IEEE Trans. on Software Eng., 20(3):169-187, Mar. 1994. [ 3 ] V. R. Basili, L. C. Briand, and W. L. Melo. Measuring the impact of reuse on software quality and productivity. Comm. oftheACM, 39(10):104116, Oct. 1996. [4] B. Boehm and C. Abts. COTS integration: Plug and pray? IEEE Computer, 32(1):135-138, Jan. 1999. [5] B. W. Boehm, C. M. .4bts, and E. Bailey. COCOTS software integration cost model: An overview. In Proc. California Software Symposium, Oct. 1998. [6] P. Brereton and D. Budgen. Component-based systems: A classification of issues. IEEE Computer, 33(11):54-62, Nov. 2000. [7] L. Brownsword, T. Obemdorf, and C. A. Sledge. Developing new processes for COTS-based systems. IEEE Software, 17(4):48-55, Jul. 2000. [8] J. Campanella. Principles of Quality Costs: Principles, Implementation, and Use. ASQ Quality Press, Milwaukee, Wis., 3rd edition, 19!>9. [9] S. R. Chidamber and C. F. Kemerer. A metrics suite for object oriented design. ITSE, 20(6):476-493, Jun. 1994. [IO] J. Cooper, M. Fisher, and S. W. Sherer. Software Acquisition Capability Maturity Model (SA-CMM) version 1.02. Technical Report CMU/SEI-99-TR-002, Carnegie Mellon Software Eng. Inst., Philadelphia, 1999.
IEEE/KSI Con$ on Software Eng. and Knowledge Eng. (SEKE ’96),pages 317-322, June 1996. [22] R. A. Paul, T. Kunii, Y. Shinagawa, and M. E Khan. Soft-
[23] [24] [25] [26] [27]
308
ware metrics knowledge and databases for project management. IEEE Trans. on Knowledge and Data Eng., 11(1):255-264, JanJFeb. 1999. N. E Schneidwind. Methods for assessing COTS reliability, maintainability, and availability. In Proc. ofthe Int’/ Con$ on Sofbvare Maintenance (ICSM ’98), 1998. S. Sedigh-Ali, A. Ghafoor, and R. A. Paul. Software engineering metrics for COTS-based systems. IEEE Computer, 34(5):44-50, May 2001. S. A. Slaughter, D. E. Harter, and M. S. Krishnan. Evaluating the cost of software quality. Comm. of the ACM, 41(8):67-73, Aug. 1998. M. Tsagias and B. Kitchenham. An evaluation of the business object approach to software development. J. Systems and Software, 52: 149-156, June 2000. J. M. Voas. The challenges of using COTS software in component-based development. IEEE Computer, 3 1(6):4445, Jun. 1998.