Carbonate-bound. 25 mL 1.0 mol/L CH3COONaâ3H2O. pH=5.0 ± 0.2 60 min ultrasound (40 KHz, 25 ± 5°C),. Rinse with ultrapure H2O. F4. Humic acid-bound.
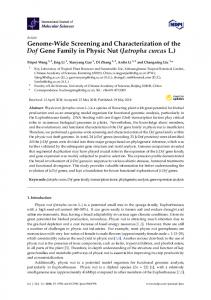
Supplementary Materials Figure 1 showed the contents of metal(loid)s in three surface waters and their maximum allowable concentrations (MAC) used for agricultural irrigating. Sample SY-1 (surface water sampling site were abbreviated by “SY”) was collected from the reservoir which is located in the upstream of the mining area. Site SY-2 is located in the Ji Changling reservoir which is close to the downstream of the mining area. Site SY-3 is also located in the downstream of the mining area but is farther from the mine zone, which is close to the residential areas. The surface water of Jichangling reservoir has been polluted by arsenic, and also showed higher Zn, Cu, Pb concentrations than the ones of the other reservoir.
MAC SY-2
SY-1 SY-3
Contents / mgL-1
0.15 1.6 0.10 0.8 0.05
0.0
Zn
Cu
0.00
Cd Cr Pb As
Figure S1. The contents of metal(loid)s and in three surface waters and their maximum allowable concentrations (MAC) used for agricultural irrigating.
S1
Table S1. Sequential extraction methods for metal(loid)s in different depth soils from the study area Step F1
Fractions Water soluble
Extract composition 25 mL ultrapure water
pH pH=8.0 ± 0.2
F2
Exchangeable
25 mL 1.0 mol/L MgCl26H2O
pH=7.0 ± 0.2
F3
Carbonate-bound
25 mL 1.0 mol/L CH3COONa3H2O
pH=5.0 ± 0.2
F4
Humic acid-bound
50 mL 0.1 mol/L Na4PO710H2O
pH=10.0 ± 0.2
Notes 30 min ultrasound (40 KHz, 25 ±5°C), rinse with ultrapure H2O. 30 min ultrasound (40 KHz, 25 ± 5°C), rinse with ultrapure H2O. 60 min ultrasound (40 KHz, 25 ± 5°C), Rinse with ultrapure H2O. 40 min ultrasound (40 KHz, 25 ±5°C ), rinse with ultrapure H2O.
F5
Fe and Mn oxide-bound
50 mL 0.25 mol/L HONH3Cl-HCl
F6
Refractory organic matter-bound
3 mL HNO3+5 mL 30% H2O2
1 h ultrasound (40 KHz, 25 ± 5°C), rinse with ultrapure H2O. pH=2.0±0.2
1.5 h bath (83 °C, stirred every 10 min), another 1.0 h bath with 3 mL 30% H2O2 (83 °C, stirred every 10 min), rinse with ultrapure H2O.
F7
Residual
5 mL mixture of 37%HCl -70%HClO4 -70%HNO3(1:1:1)/5 mL 40%HF
S2
Digested at 105 °C for 3h.
Table S2. Concentrations and enrichment factors (EFs) of metal(loid)s in top soils from the study area Sample
TY-1 TY-2 TY-3 TY-4 TY-5 TY-6 TY-7 TY-8 TY-9 TY-10 TY-11 Max Min Mean SD BV a MAC b
Cr Concentration (mg/kg) 43.7 ± 0.8 8.1 ± 0.2 44.9 ± 0.3 44.0 ± 0.2 46.6 ± 0.8 42.4 ± 0.3 47.3 ± 0.4 37.4 ± 0.3 16.9 ± 0.1 18.6 ± 0.1 49.7 ± 0.2 49.7 8.1 36.3 14.5 50.5 300
EF 0.69 0.27 0.52 0.52 0.61 0.64 0.62 0.62 0.64 0.19 0.40 0.69 0.19 0.52 0.16
Ag Concentration (mg/kg) 0.454 ± 0.003 0.072 ± 0.004 0.523 ± 0.005 0.250 ± 0.004 0.194 ± 0.003 0.291 ± 0.002 0.394 ± 0.002 0.150 ± 0.002 0.095 ± 0.005 0.162 ± 0.002 0.876 ± 0.006 0.876 0.072 0.314 0.237 0.108 ---
EF 3.34 1.13 2.82 1.38 1.18 2.07 2.40 1.16 1.69 0.79 3.30 3.34 0.79 1.93 0.91
B Concentration (mg/kg) 200.0 ± 1.2 22.0 ± 0.4 200.0 ± 0.9 200.0 ± 0.8 91.6 ± 0.6 53.8 ± 0.3 79.1 ± 0.2 89.5 ± 0.6 11.5 ± 0.1 9.9 ± 0.3 54.3 ± 0.4 200 9.9 91.9 74.9 21.8 ---
EF 7.30 1.71 5.34 5.49 2.76 1.89 2.39 3.42 1.01 0.24 1.01 7.30 0.24 2.96 2.22
Bi Concentration (mg/kg) 13.10 ± 0.07 0.53 ± 0.01 8.47 ± 0.08 2.66 ± 0.05 1.68 ± 0.04 1.33 ± 0.04 2.66 ± 0.04 0.25 ± 0.02 1.12 ± 0.01 0.47 ± 0.01 2.61 ± 0.06 13.10 0.25 3.17 4.00 0.54 ---
EF 19.30 1.67 9.14 2.95 2.04 1.89 3.24 0.39 3.99 0.46 1.96 19.30 0.39 4.27 5.52
Co Concentration (mg/kg) 11.7 ± 0.3 5.0 ± 0.2 20.2 ± 0.5 10.0 ± 0.2 10.5 ± 0.3 7.7 ± 0.2 13.2 ± 0.6 11.5 ± 0.1 4.3 ± 0.3 14.3 ± 0.3 14.5 ± 0.4 20.2 4.3 11.17 4.54 7.0 ---
EF 1.33 1.21 1.68 0.85 0.98 0.84 1.24 1.37 1.18 1.07 0.84 1.68 0.84 1.15 0.26
BV: background value; MAC: maximum allowable concentration. a background values of elements in the soils of Guangdong Province (CNEMC, China National Environmental Monitoring Ceter, 1990 [27]), b The maximum allowable concentrations of contaminants in Chinese soils (EPAC, Environmental protection Administration of China, 2008 [41]).
S3
Mo Concentration (mg/kg) 1.29 ± 0.03 1.13 ± 0.02 1.21 ± 0.04 0.89 ± 0.03 1.07 ± 0.03 0.87 ± 0.02 1.11 ± 0.02 1.48 ± 0.04 3.80 ± 0.08 1.89 ± 0.04 1.91 ± 0.02 3.8 0.87 1.51 0.83 7.7 ---
EF 0.13 0.25 0.09 0.07 0.09 0.09 0.09 0.16 0.95 0.13 0.10 0.95 0.07 0.20 0.25
Table S2. (Continued) Concentrations and enrichment factors (EFs) of metal(loid)s and phosphorus in top soils from the study area. Sample
Sb Concentration
Ti EF
Concentration
(mg/kg)
V EF
Concentration 60.5 ± 0.9
(mg/kg)
W
Sn
EF
Concentration
0.74
130.0 ± 0.5
32.83
(mg/kg)
EF
(mg/kg)
Concentration
P EF
Concentration
35.9 ± 0.6
4.92
942.1 ± 1.0
(mg/kg)
(mg/kg)
TY-1
1.41 ± 0.04
2.08
4790.1 ± 7.6
1.31
TY-2
0.60 ± 0.06
1.89
1708.2 ± 5.3
1.00
16.9 ± 0.3
0.44
1.8 ± 0.05
0.96
5.8 ± 0.3
1.70
199.8 ± 1.5
TY-3
1.46 ± 0.03
1.57
4979.0 ± 6.2
1.00
64.0 ± 0.8
0.57
53.8 ± 0.6
9.95
34.6 ± 0.5
3.47
1430.1 ± 1.5
TY-4
1.69 ± 0.05
1.87
4850.2 ± 3.2
1.00
60.2 ± 0.4
0.55
7.7 ± 0.4
1.46
28.9 ± 0.4
2.98
772.3 ± 1.6
TY-5
1.08 ± 0.01
1.31
4419.0 ± 4.0
1.00
69.8 ± 0.2
0.70
10.7 ± 0.3
2.23
16.9 ± 0.3
1.91
909.4 ± 1.4
TY-6
0.92 ± 0.06
1.30
3776.8 ± 3.2
1.00
53.2 ± 0.5
0.63
6.3 ± 0.4
1.54
23.1 ± 0.2
3.06
1793.9 ± 1.5
TY-7
1.31 ± 0.03
1.60
4402.6 ± 5.6
1.00
72.5 ± 0.6
0.73
20.4 ± 0.5
4.27
19.2 ± 0.8
2.18
1451.2 ± 1.3
TY-8
1.21 ± 0.03
1.87
3479.5 ± 5.6
1.00
47.3 ± 0.6
0.60
2.4 ± 0.2
0.64
3.3 ± 0.2
0.47
464.8 ± 1.3
TY-9
1.04 ± 0.02
3.70
1507.8 ± 6.7
1.00
19.2 ± 0.3
0.57
2.6 ± 0.2
1.59
9.7 ± 0.2
3.22
374.3 ± 0.9
TY-10
1.54 ± 0.04
1.50
5518.2 ± 3.6
1.00
84.7 ± 0.6
0.68
2.0 ± 0.1
0.34
6.9 ± 0.2
0.63
479.6 ± 1.2
TY-11
1.61 ± 0.03
1.21
7135.5 ± 8.9
1.00
113.4 ± 0.5
0.71
8.0 ± 0.4
1.04
20.7 ± 0.4
1.45
1496.9 ± 1.0
Max
1.69
3.70
7135.5
1.31
113.4
0.74
130
32.83
35.9
4.92
1793.9
Min
0.60
1.21
1507.8
1.00
16.9
0.44
1.79
0.34
3.3
0.47
199.8
Mean
1.26
1.81
4233.3
1.03
60.1
0.63
22.3
5.17
18.6
2.36
937.7
SD
0.33
0.69
1611.3
0.09
27.3
0.09
38.7
9.57
11.4
1.32
511.3
BV
a
MAC b
0.54
2900
65.3
3.15
5.8
---
---
---
---
---
---
---
BV: background value; MAC: maximum allowable concentration. a background values of elements in the soils of Guangdong Province (CNEMC, China National Environmental Monitoring Ceter, 1990 [27]), b The maximum allowable concentrations of contaminants in Chinese soils (EPAC, Environmental protection Administration of China, 2008 [41]).
S4
Table S3. Major constituents (mg/kg) of the common chemical fertilizers and pesticides from the study area. Type
Description
Unit
As
Cu
Pb
Zn
Cd
Ni
Cr
Ca
Mn
K
Mg
N
P
Chemical fertilizers
Kalium chloratum
mg/kg


![MG-1-PENDAHULUAN-1 [Compatibility Mode]](https://m.moam.info/img/260x300/mg-1-pendahuluan-1-compatibility-mode_59d4b9d31723dd351103628d.jpg)