Dec 6, 1995 - the recent history of welfare policy in the United. States. Then ...... Detroit received one of the WTW grants made directly to localities. It used its ...
17
Michigan’s Welfare System Kristin S. Seefeldt, Sheldon Danziger, and Sandra K. Danziger
M
ichigan’s welfare system has undergone dramatic changes over the last twenty years, some of which have resulted from federal legislation, others from state initiatives. This chapter focuses on changes in cash assistance for the poor. We begin by briefly reviewing the recent history of welfare policy in the United States. Then, we turn to Michigan’s response to the Family Support Act of 1988, the first significant piece of welfare reform legislation since the 1960s. Most of the remainder of the chapter focuses on Michigan’s implementation of the Personal Responsibility and Work Opportunity Reconciliation Act of 1996, which dramatically restructured the cash welfare system into a workbased system. We then review the effects on recipients of the post-1996 welfare changes. We conclude with a discussion of unresolved issues facing the state, present some policy options the state might consider implementing in the future, and provide information on trends in poverty during the 1980s and 1990s.
A Brief Overview of AFDC, 1960–80 In the United States, “welfare” is most often associated with cash assistance for low-income families, usually those headed by a single mother with
children. Until 1996, this program was known as Aid to Families with Dependent Children (AFDC). The purpose of AFDC was to provide financial support to children who were “deprived of parental support or care because their father or mother is absent from the home continuously, is incapacitated, is deceased or is unemployed” (U.S. House of Representatives 1994). In certain instances, two-parent families were also eligible for cash assistance (this will be discussed later in the text). AFDC evolved out of the Aid to Dependent Children (ADC) program, created by the Social Security Act of 1935. ADC was not a large program, serving about 350,000 families in 1940, primarily widows and their children. By the 1960s, the program’s name had changed (to AFDC), the number receiving assistance had grown (to about 4 million recipients in just over 1 million families in the mid-1960s), and the type of family served was different (primarily divorced or nevermarried mothers and their children). Throughout the 1970s, the AFDC caseload continued to grow. By 1980, 10.6 million people in 3.6 million families were on the rolls, an increase of 3.2 million recipients and 1.7 million families from 1970. Caseloads in Michigan increased from 304,000 to 782,000 between 1970 and 1980. Increased caseloads led to rapid increases in spending. States shared responsibility with the 351
352
M I C H I G A N AT T H E M I L L E N N I U M
TABLE 17.1N
The Family Support Act
Trends in AFDC Caseloads: U.S. and Michigan United States
FY FY FY FY FY FY
1977 1980 1983 1987 1990 1994
Michigan
Cases
Recipients
Cases
Recipients
3,575,494 3,642,404 3,650,746 3,784,014 3,974,321 5,046,326
11,188,354 10,596,045 10,659,365 11,065,027 11,460,379 14,225,651
202,214 225,095 240,069 214,410 218,137 223,950
650,814 683,799 751,634 652,076 665,101 665,785
SOURCE: U.S. Department of Health and Human Services (2001a).
federal government for financing AFDC. States with lower per-capita incomes received a greater proportion of their AFDC funds (close to 80% in a state like Mississippi) from the federal government than states with higher incomes, such as Michigan—which received approximately 50% of costs. In the 1980s, the Reagan administration sought to cut welfare rolls and reduce spending on welfare. The 1981 Omnibus Budget Reconciliation Act (OBRA) tightened AFDC eligibility requirements and increased the rate at which AFDC benefits were reduced when a recipient went to work. These changes removed just under 500,000 families from the rolls, saving an estimated $93 million in state and federal funds (U.S. House of Representatives 1993) but also pushing many families into poverty (Levitan 1985). Additionally, OBRA allowed states to implement community work experience or “workfare” programs, whereby recipients had to earn their grants by working in unpaid positions for a certain number of hours (equal to their grant amount divided by the minimum wage). These programs were the precursors to the changes that would unfold a decade later.
Welfare in the Late 1980s and Early 1990s A great deal of welfare reform activity occurred in the late 1980s and early 1990s, at both the federal and the state levels. Changes in federal law sought to move more welfare recipients into work, and states, including Michigan, began experimenting with their own policies to encourage work and parental responsibility. This section describes changes in federal law, Michigan’s implementation of those laws, and other policies enacted by the state prior to 1996.
In 1988 Congress passed the Family Support Act (FSA). Its centerpiece was the Job Opportunities and Basic Skills (JOBS) program, which encouraged participation in education and training programs, with the ultimate goal of moving recipients from welfare to self-sufficiency. States could offer a variety of activities under JOBS, such as education and training programs—including high school completion and post-secondary education, job-search assistance, and placement in community-service jobs. Beginning in 1990, at least 7% of a state’s caseload had to participate in these activities, with this rate rising to 15% in 1995. Some recipients were excluded from the participation requirements due to their age, health, or other factors. Recipients not meeting these criteria were mandatory JOBS participants. Michigan’s JOBS program was called “MOST”— the Michigan Opportunities and Skills Training program. The state chose to offer the full range of JOBS activities, although it did not use JOBS funds to support post-secondary education. Recipients could fulfill the JOBS participation requirement by attending college if they could access federal scholarships and loans. In the early 1990s the largest proportion of MOST/JOBS participants in an average month in Michigan were in highschool completion programs (about 20% of participants, or between 8,500 and 9,300 individuals, depending on the year) or in college (16% to 24%, or between 7,900 and 10,000 individuals) (U.S House of Representatives 1994, 1996). At the same time that states had to start meeting JOBS participation requirements, a recession hit. As a result, AFDC caseloads increased from about 11 million recipients in the late 1980s to about 14 million in 1994. Caseloads in Michigan during this period ranged from 650,000 to 700,000 persons, and, unlike U.S. caseloads, peaked in the mid-1980s and then declined (see table 17.1). This is due in part to benefit reductions instituted in the early 1990s (discussed later in the text), which had the effect of making fewer families eligible for assistance.
AFDC Benefits and Eligibility While passage of FSA changed the education and training component of AFDC, it did not alter the basic eligibility and benefit structure of the program. Within certain limits, states could set finan-
353
Michigan’s Welfar e System
cial eligibility criteria (including the amount of income and assets a family could have) and cash benefit levels. Due to this flexibility, there was a great deal of variation in AFDC benefit levels across states. In the late 1980s and early 1990s, the maximum monthly benefit for a family of three ranged from $120 in Mississippi to $924 in Alaska. This large difference is in part due to different costs of living between states, in part to differences in state per-capita income, and in part to political factors, such as states’ willingness to raise revenues. To some degree, AFDC benefit differences were offset by Food Stamps, a fully federally funded program providing food assistance to low-income families in the form of vouchers. Families in lower-benefit states were eligible for more assistance from food stamps than families living in higher-cash-benefit states. Nearly all AFDC recipients were eligible for and received food stamps, and payment levels were adjusted each year for inflation. Additionally, families receiving AFDC were automatically eligible for Medicaid, a federal-state-funded program providing health care benefits to low-income families. Michigan’s AFDC benefit levels varied by region of the state, with differences based on the cost of housing in the area. Maximum benefit levels in 1990 in Washtenaw County, for example, were $546 (for a family of three), compared to $516 in Wayne County. As shown in table 17.2, compared to other Midwestern states, Michigan’s benefit levels were above the average, but the state reduced benefit amounts after 1990. In most of the nation, benefit levels were fairly constant during the 1990s, contributing to a decline in purchasing power, since benefits are not adjusted for inflation. This trend began in the 1970s, with the real spending power of AFDC in the median state eroding by 21% over the 1970–80 period, although by only 2% in Michigan.
Funding for AFDC and JOBS Like most states, Michigan faced fiscal challenges in implementing FSA. One challenge stemmed from the legislation that required a mix of federal and state funds for JOBS, as had been the case for AFDC funding. The proportion of state matching funds for both programs varied based on a state’s income relative to that of other states. Michigan was responsible for about 55% of AFDC-related costs, with the federal government covering the
TABLE 17.2N
Maximum AFDC Benefits (for a Three-Person Family with No Income) in Nominal Dollars, Midwestern States, 1987–92
Illinois Indiana Iowa Michigan (Wayne County) Minnesota Ohio Wisconsin
1987
1990
1992
1996
$342 $256 $381 $473 $532 $302 $544
$367 $288 $410 $516 $532 $334 $517
$367 $288 $426 $459 $532 $334 $517
$377 $288 $426 $459 $532 $341 $517
SOURCE: U.S. House of Representatives (1994, 1998).
rest. Including costs paid by the federal government, in the early 1990s this was approximately $1.2 billion per year (equivalent to $1.4 billion in 2001 dollars) (U.S. House of Representatives 1996). Total AFDC expenditures in Michigan were third-highest in the nation, behind California and New York. Whereas states were mandated to pay their share of AFDC benefit costs, the same was not true for JOBS. In order to receive the full amount of federal funds available under JOBS, states had to contribute their full “match.” However, they could receive some proportion of federal funds if they matched with state funds at a lower level. The economic downturn in the early 1990s meant that most states did not commit their full state obligation and were unable to obtain the maximum amount of federal JOBS funds available. Michigan spent just 42% of available federal funds in fiscal year 1990, rising to 64% and 71% by fiscal years 1993 and 1994 (U.S. House of Representatives 1996).
To Strengthen Michigan Families As did many states during the early 1990s, Michigan pursued changes to its welfare system, some by changes in state laws and regulations, and others through a federal “waiver” process. Beginning in 1992, Michigan obtained a number of waivers. Most of these changes were part of a vision for reform called To Strengthen Michigan Families (TSMF). TSMF articulated principles such as encouraging employment and increasing personal responsibility of welfare recipients. Although many policy changes were enacted to achieve these goals, a core set focused on the
354
M I C H I G A N AT T H E M I L L E N N I U M
AFDC program (Werner and Kornfeld 1997). In 1992, the state received waivers to broaden eligibility for two-parent families, to allow families to keep more of their AFDC checks when they took a job (i.e., to reduce the marginal tax rate on earnings), and to extend participation in employmentrelated activities. Under AFDC, two-parent families were served by the AFDC-UP (Unemployed Parent) program, and eligibility criteria were strict (for example, parents had to meet a series of requirements including a previous work history, but benefits were easily lost if a parent went back to work). Because state policy makers believed that these rules created a disincentive for two-parent families to remain together or to seek employment, Michigan received waivers to eliminate these rules. After OBRA, once a parent went to work, AFDC benefits were reduced by nearly a dollar for each dollar of earnings after four months of employment. In some cases, children’s earnings were treated the same way. Because of expenses associated with going to work (e.g., child care and transportation), parents taking low-wage jobs often found themselves no better off, or even worse off, financially than when they received AFDC (Blank 1997). As a way to encourage employment, Michigan obtained a waiver allowing working recipients to keep the first $200 per month and 20% of the remaining earnings, without affecting the amount of AFDC received. As another way to encourage and move recipients to employment, all adults receiving AFDC were required to enter into a “Social Contract” with the Michigan Department of Social Services (MDSS), the agency overseeing welfare programs. The Social Contract specified that the client would attempt to achieve self-sufficiency, and the state would provide services and other assistance to help the recipient leave the welfare rolls. Additionally, in 1994 the state received a waiver to eliminate nearly all exemption categories, meaning that many more AFDC recipients could be mandated to participate in JOBS/MOST. JOBS/MOST participants could have their benefits reduced if they did not participate in assigned activities. Between 1992 and 1994, the federally specified penalty for noncompliance, called a sanction, was removal of the noncompliant person from the grant calculation, resulting in a reduced AFDC check. This reduction continued until the person was compliant or, in cases of repeated noncompliance, for a minimum of one to six months. Toward the end of fiscal year 1994,
roughly 3% of the state’s AFDC caseload was in sanction status (computations based on data reported in Michigan Department of Social Services 1995a). Waivers also let the state increase penalties for noncompliance: recipients faced a 25% reduction in their AFDC check and in their food stamp benefits for every month of noncompliance. After twelve months of noncompliance, the AFDC case could be closed and the family would receive no cash assistance, although food stamp benefits could continue. From April through June 1996, the first few months that cases could lose benefits under the new policy, 1,201 families had their cases closed due to sanctions, representing 4.5% of all closed AFDC cases during those months (Michigan Department of Social Services 1996).
The General Assistance Program Another major change in Michigan’s income-support system was the elimination of the state’s General Assistance (GA) program in 1991. General Assistance programs are state-funded cash or inkind programs, primarily serving low-income persons ineligible for AFDC or federal disability programs. Because they are fully funded by states, there is variability between state programs (and sometimes within a state) in terms of eligibility and payments. Some states never operated a GA program. In the late 1980s, thirty-eight states had General Assistance programs, including Michigan (Gallagher 1999). Until 1991, Michigan provided maximum benefits of $231 per month for nonelderly, impoverished adults without dependent children. To qualify in Michigan, recipients had to earn less than $160 per month, have less than $250 in assets, and if they owned a car, its value had to be less than $1,500. In addition to cash benefits, GA recipients received state medical coverage and were eligible for federal food stamp benefits. Governor Engler proposed to end the program in Michigan, and GA benefits ceased in October 1991. More than 80,000 people lost benefits, although about 11% were automatically transferred to one of two new state-funded programs, State Disability Assistance (SDA) or State Family Assistance (SFA), a program for individuals formerly covered by GA family benefits. At the time of GA elimination, the MDSS director noted that the state expected to save about $240 million in
355
Michigan’s Welfar e System
fiscal year 1992 and “help break this cycle of dependence” on public assistance (Walsh 1991). A number of analysts have characterized Michigan’s GA termination as among the most drastic of state social welfare spending cuts that were implemented across the nation in the early 1990s (Center on Social Welfare Policy, and Law 1994; Nichols and Porter 1995). Research on the effects of the GA termination documented that the majority of former recipients did not find jobs after they lost benefits. A study found that slightly less than one-third of the 530 former recipients surveyed had found employment one year after GA ended; and much of this employment was unstable (Henly and Danziger 1996). While tremendous increases in homelessness, predicted by many advocates, did not occur, a survey of former recipients reported that more than one-fifth were living in shelters, on the streets, or in other unstable living arrangements, up from 11% the year before GA was eliminated (Kossoudji, Danziger, and Lovell 1993).
Reforming Welfare at the State and Federal Level in the Mid-1990s Michigan took on a leadership role in the welfare reform debate of the mid-1990s, in part because of the reforms the state was implementing, and in part due to the lobbying efforts in Washington of Governor Engler and his staff. This section discusses the evolution of state and national welfare policies, provides an overview of Michigan and federal welfare reform laws, and highlights important changes in funding for welfare programs.
Michigan’s Role in Welfare Reform The waivers and other policy changes Michigan implemented during the early 1990s were relevant to the national welfare reform debate, and Michigan emerged as one of the leaders in welfare reform. For example, Michigan and several other states moved away from the education and training philosophy of JOBS and implemented “work first” programs that assume that finding a job quickly and developing work skills through direct experience—rather than participating in education and training—will be more effective in moving recipients off the rolls. The Engler administration implemented its “Work First” program in October 1994. The popularity of work first
programs was due in part to the success of a Riverside, California, welfare-to-work program that placed a strong emphasis on finding work. During 1994 and 1995 a number of federal welfare reform plans were proposed to turn welfare into a work-based system. In June 1994, President Clinton unveiled his welfare reform plan, but no action was ever taken on it. In December 1995 and January 1996, President Clinton vetoed two Republican welfare reform plans. Although Clinton and congressional Republicans shared a similar vision, they differed on key issues: (a) funding levels (Republicans wanted federal funding cuts, Clinton’s plan would have increased funding); (b) the entitlement to assistance (Republicans favored capped block grants to states, with states deciding how to fund particular welfare provisions, while Clinton wanted to maintain the entitlement to cash assistance); and (c) time limits (Republicans proposed putting an absolute limit on the amount of time that families could receive welfare benefits, whereas Clinton would have provided assistance in the form of community-service jobs to families who had not found employment after two years of receiving benefits). Despite federal impasse during this time, welfare reform occurred in Michigan. Public Acts 223 and 224 were signed into law by Governor Engler on 6 December 1995, amending the Social Welfare Act of 1939 (P.A. 280) and the Administrative Procedures Act of 1980 (P.A. 122). Michigan’s new laws were quite similar to legislative proposals being discussed in Washington, D.C. Michigan eliminated the AFDC program and replaced it with a new cash assistance program called the Family Independence Program (FIP), administered by the Family Independence Agency (FIA), the new name for the Department of Social Services. Unlike AFDC, FIP would not be an entitlement program, meaning that eligible families would not necessarily be assured of assistance. Adult recipients, unless exempted, would be required to participate in Work First or go to work at least part-time. Additionally, Michigan’s new law gave greater discretion to MDSS/FIA, by exempting it from the Administrative Procedures Act for twelve months after the law went into effect (Weissert 2000). This provision allowed the state to develop program rules and regulations for FIP without, for example, holding public hearings on them. However, unless the federal law changed, Michigan would need waivers to implement its reform plan.
356
M I C H I G A N AT T H E M I L L E N N I U M
The Personal Responsibility and Work Opportunity Reconciliation Act of 1996 Nearly six months after Clinton’s second veto, Congress passed the Personal Responsibility and Work Opportunity Reconciliation Act (PRWORA) of 1996. The body representing the nation’s governors, the National Governors’ Association (NGA), played a key role in this process by proposing its own welfare reform plan, which was viewed by many as a bipartisan compromise (Weaver 2000). Many of the provisions in Michigan’s P.A. 223 are similar to those in PRWORA. This is not surprising, since Governor Engler helped formulate the NGA plan (Weaver 2000; Weissert 2000). Clinton signed PRWORA in August 1996; states could begin implementing the Temporary Assistance to Needy Families (TANF) program, which replaced AFDC, as early as 1 October 1996. TANF was authorized and funded through 30 September 2002 and, like P.A. 223, ends the entitlement to cash assistance, gives increased discretion for states and localities in defining and operating their programs, imposes work requirements, and makes it more difficult for teen mothers to receive cash assistance on their own. A major difference between TANF and AFDC is the former’s lack of entitlement—each state decides which families to assist, subject only to a requirement that they receive “fair and equitable treatment.” Additionally, states must meet “work participation rate” requirements. A certain proportion of the state’s caseload must be working or participating in a work-related activity (e.g., looking for a job, receiving short-term training in how to find a job, and, on a limited basis, participating in a short-term training program that prepares the recipient for a specific job). In fiscal year 1997, states had to have 25% of the caseload in work activities for at least twenty hours a week. Each year that proportion rose by five percentage points, to 50% in 2002. Additionally, hours of participation required climbed, to twenty-five hours in 1999 and to thirty hours in 2000 and thereafter, although parents with a child under age six are required to participate only twenty hours per week. Two-parent cases are held to a different participation standard. In 1997 and 1998, states had to have 75% of these cases engaged in work activities for thirty-five hours per week, and the rate rose to 90% in 1999 and thereafter. Having already passed its own welfare reform law, Michigan quickly implemented PRWORA, since the new law eliminated the need for waivers.
The newly renamed Michigan Family Independence Agency (FIA) administered FIP, the state’s TANF program. Individuals could meet TANF’s work requirements through participation in Work First. Unlike P.A. 223, though, PRWORA includes time limits on receipt of cash assistance funded by federal dollars, to ensure that assistance is “temporary.” First, recipients who are not employed or in a work activity after receiving assistance for twenty-four months may be dropped from the rolls. Second, adults, with few exceptions, are barred from receiving federally funded assistance for more than sixty months, or fewer, at state option. Although Michigan is barred from using federal funds for families after sixty months, it has chosen to support these families with state funds (as will be discussed later). Only Michigan and Vermont have no time limit.
PRWORA’s Changes to Welfare Funding and Implications for Michigan PRWORA also changed the federal-state funding structure for cash assistance that had been in place since 1935. Instead of matching state expenditures and providing funds for states to draw down for employment and training services, TANF provides a capped block grant to each state that does not change over time. The states’ block grant is based on a formula that takes into account historical federal spending on AFDC, JOBS, and the Emergency Assistance program, a joint federal-state program that helped families in short-term crises, which was also abolished by TANF. Because of a “maintenance of effort” (MOE) provision, states must maintain their own spending at a level equal to or greater than 80% of 1994 state welfare expenditures, or risk penalties of reduced federal funding. However, states meeting the work-participation rates are allowed to drop their spending to 75% of historic expenditures. A criticism of block grant funding is that increased welfare costs associated with population growth, economic downturns, or inflation must now be borne by the states or else by the poor—the federal contribution remains constant (Sheldon Danziger 2001). The law set aside $2 billion in a contingency fund for states experiencing growth in their low-income populations (e.g., due to a recession). However, if those funds were exhausted, states would bear any additional costs for the program. Because caseloads have fallen in
357
Michigan’s Welfar e System
most states since 1994, many states were allocated more federal funds in the first five years postPRWORA than they would have received under the AFDC matching-grant arrangement. From fiscal year 1997 through fiscal year 2000, Michigan was awarded $3.1 billion total in federal TANF funds. The state transferred $282 million to the Child Care Development Fund to fund child care for recipients, and $309 million to the Social Services Block Grant to fund child-abuse and child-neglect programs. The amount available for direct TANF use (i.e. for FIP) was just over $2.5 billion. Of this amount, the state spent just over $2.3 billion, leaving a TANF surplus of just under $200 million (U.S. Department of Health and Human Services 2001a). State MOE funds from fiscal year 1997 through fiscal year 2000 amounted to $469 million, which satisfies the 75% MOE requirement, as Michigan met federal work-participation requirements (U.S. Department of Health and Human Services 2001a).
Welfare Reform in Michigan: FIP, Work First, and Project Zero Although Michigan had been moving toward a work-based welfare system since the early 1990s, implementation of PRWORA accelerated that change. The Work First program is the central activity by which welfare clients meet federal work requirements. Most clients in Work First participate in job search and other activities designed to help them find employment quickly. However; in 1999 the state expanded Work First to include some education and training activities. This section describes the organization of Michigan’s welfare system, services provided through Work First and FIP, the state’s TANF program, and how the state met PRWORA’s work participation requirements.
Organization of Work First Programs Prior to the introduction of Work First, FIA (and DSS) administered all welfare-to-work activities directly or through referrals to or local contracts with not-for-profit and public agencies. In 1994, Governor Engler created the Michigan Jobs Commission (MJC), charged with improving the state’s business climate through a range of initiatives, including Work First and workforce development.
TANF funds used for Work First were passed from the FIA to the MJC. The MJC then allocated funds for employment and training services and workforce development programs among local Workforce Development Boards and their staff, called Michigan Works! Agencies (MWAs). Until 1997, MWA staff could provide services directly, or the MWA could contract out for services. In 1996, for example, MWA staff provided Work First services directly in ten of the twenty-six MWAs, while the other sixteen contracted out for services, primarily with nonprofit and school-based organizations, and a smaller number with for-profit providers (Seefeldt, Sandfort, and Danziger 1998). In April 1999, Governor Engler dismantled the MJC and placed economic development functions in the new Michigan Economic Development Corporation (MEDC). Job training and workforce development functions and former MJC staff overseeing these programs, including Work First, were put in another new agency, the Michigan Department of Career Development (MDCD). Like the MJC, MDCD sets policy, provides guidance to localities, and administers state and federal funds, while local Workforce Development Boards and their contractors oversee program operations.
FIP and Work First Service Delivery Entrance into a Work First program starts when a potential welfare recipient applies for FIP, or at benefit redetermination, or upon job loss for a client receiving FIP. Families apply for assistance (or have eligibility redetermined) at a local FIA office. In most areas of the state, there is one FIA office per county. Larger urban areas have multiple district offices located throughout the county. After meeting with FIA staff (see the following for more details), the applicant/client is referred to an orientation session. As of 1 October 1996, to be eligible for cash assistance, all recipients and applicants are required to attend this orientation session, during which the rules and regulations of the Family Independence Program and Work First are explained. Unless deferred from further participation, the client must continue to participate in Work First and find employment. As of October 1998, ties between participation in Work First and FIP program eligibility were further strengthened, with applicants now required to attend orientation and the first day of a Work First program
358
M I C H I G A N AT T H E M I L L E N N I U M
before their FIP case is opened and receipt of benefits can begin. In Work First programs clients typically participate in “job search readiness” activities, such as résumé and cover letter preparation and mock interviews. They are also required to search for work. During job search, clients have access to a variety of tools to help them in their search (e.g., phones to call employers, lists of job openings from newspapers and from the state employment agency) (Danziger and Seefeldt 2000). Hours of participation in Work First follow federal guidelines. Although the details of other states’ program vary, most were operating “work first” programs after PRWORA went into effect (Holcomb et al. 1998). Clients who participate in Work First and follow other eligibility rules receive a monthly FIP check. The maximum monthly benefit is between $424 and $489 (for a family of three), depending on the county of residence. Average monthly benefits in Michigan were $357 in 1999 (U.S. House of Representatives 2000). These benefit levels have not increased since 1993, although families in which only the children receive benefits (e.g., the children live with a noneligible relative) received increases in 2000 and 2001. In terms of benefit generosity, Michigan’s maximum monthly FIP payment ($459 in Wayne County for a family of three) in 2000 is the sixteenth-highest in the nation and about 9% higher than the $429 benefit in the median state. However, Michigan’s benefit fell from 142% of that of the median state in 1990 to 109% of that of the median state in 2000. Comparing Michigan to other Midwestern states, benefits are higher in Minnesota and Wisconsin, and lower in Illinois, Indiana, Iowa, and Ohio (U.S. House of Representatives 2000). The goal of Work First participation is to find employment and ultimately leave the FIP rolls. Clients may take part-time work, as long as the hours fulfill the federal work participation requirement. Starting in mid-2002, some clients may be required to work forty hours per week, based on determination by their FIA caseworker. Clients who do not find employment within four weeks may stay in Work First and continue searching for work, or they may be placed in another activity, such as vocational training.
Other Employment-Related Activities For the first several years post-reform, participation in Work First or working in paid employment
were the primary work-related activities for welfare recipients in Michigan. Beginning in October 1999, the state allowed clients to engage in some forms of education and training to satisfy the work requirement. Clients can combine ten hours of employment per week with ten hours of class and ten hours of study time (called the “10-10-10”) or can attend a full-time, short-term (six months or fewer) vocational training program. Clients without a high-school diploma or GED may fulfill up to ten hours of their work requirement by participating in GED preparation activities. According to MDCD data and reports from Work First staff, few welfare recipients participate in education or training activities—about 3% to 4% in fiscal years 2000 and 2001 (Michigan Department of Career Development 2002). This may be due to difficulties some clients have in balancing training with work and family responsibilities. Also, Work First staff reported challenges in finding employers willing to provide jobs for only ten hours per week, or training programs willing to admit clients without GEDs or high school degrees, limiting the choices for clients who lack this certificate (Seefeldt et al. 2001).
Work First Funding Work First is funded by a mixture of TANF, federal Welfare-to-Work program dollars, and state General Fund/General Purpose revenues. In 2001 dollars, about $43 million in federal TANF funds and $34.4 million in state funds were expended on work-related activities (primarily Work First) during fiscal year 1997 (U.S. Department of Health and Human Services 1998). By fiscal year 1999, $141.2 million federal TANF dollars and $16.7 million in state funds were spent on work activities and training (U.S. Department of Health and Human Services 2001a). During fiscal year 2000, federal funds increased to $165.3 million, while state funds fell to $6.9 million (Center for Law and Social Policy 2002a). This represents both a reduction in the welfare caseload and a shift in state dollars toward funding child care services (discussed further in the following section). Welfare-to-Work (WTW), passed by Congress in 1997, authorized funding to states and localities to serve “hard to employ” TANF recipients and the noncustodial parents of children on TANF. Michigan received $42 million in federal WTW funds in fiscal year 1998, and $39 million in fiscal year 1999, both matched at a 50% rate with state
359
Michigan’s Welfar e System
funds. No further funds are authorized under WTW. Michigan used its WTW funds primarily to offer employment services to noncustodial parents as well as to augment Work First and pay for services for welfare recipients who fall into one of WTW’s target groups (e.g., long-term recipients, recipients with poor work histories). Detroit received one of the WTW grants made directly to localities. It used its $4.9 million to subsidize the full wages of approximately 2,400 recipients placed into public- or private-sector jobs with employers recruited to participate in its project (Nightingale et al. 2000). Kalamazoo’s Metro Transit Service also received $375,000 to enhance the city’s public transportation service, particularly to assist welfare recipients’ commute to work.
Work Participation Rates Michigan has had no trouble meeting the federal work-participation rates. Although the participation rates increase each year, these increases may be offset or eliminated by credits states receive for reductions in their TANF caseloads. With the caseload reduction credit, Michigan’s 1997 participation rate was reduced from 25% to 13% for all families and from 75% to 47% for two-parent families. Actual participation was 41% for all families and 60% for two-parent families. Levels of participation rose in 1998 and 1999, but Michigan’s required (adjusted) participation rate continued to drop due to further caseload reductions, with the state having an adjusted participation rate of 0% for all families and 15% for two-parent families in 1999 (U.S. Department of Health and Human Services 1998, 1999, 2000).
Exemptions from the Work Requirement Exemptions (called “deferrals”) from Work First and the work requirement are limited primarily to clients who are disabled or caring for a disabled family member. Shorter-term deferrals are available to mothers with a child under three months old, victims of domestic violence, clients with temporary mental or physical illnesses or injuries, and clients experiencing a temporary crisis that limits their ability to participate. A comparison of Michigan’s work requirement deferral criteria to those of other states characterized Michigan’s criteria as narrower than those of many other states, in part because the definition of “disabled” is tied
to eligibility for the Supplemental Security Income (SSI) program, the federal disability program for low-income individuals (Thompson et al. 1998). While the FIP rolls have declined, the number of deferred cases receiving assistance has grown. In December 1997, just under 33,000 cases were deferred, or 26% of the caseload (Michigan Family Independence Agency 1998a). Four years later, approximately 39,700 cases were deferred. Because the total caseload was lower in 2001 (about 71,000 cases in 2001, compared to 122,500 in 1997), deferred cases made up about 58% of FIP cases (Michigan Family Independence Agency 2002c).
The Family Independence Specialist and Service Delivery PRWORA also sought to “change the culture of the welfare office.” For states to be successful in placing recipients into jobs, the work of welfare office staff had to be changed from primarily determining eligibility and providing cash benefits (clerical functions) to providing employment and social services with an emphasis on “case management,” a term often used to describe holistic treatment of clients. Michigan adopted a case-management philosophy in its FIA offices, and implemented the Family Independence Specialist (FIS) in April 1997. Welfare applicants and recipients are assigned to a single Family Independence Specialist. Previously, an applicant might see up to three workers to open his or her case and receive other services. The FISs perform all eligibility functions and also may visit clients in their homes, provide (as needed) counseling services, and perform other client-assessment and case-management activities.
Project Zero In July 1996, Michigan initiated “Project Zero” as a six-site effort to achieve zero unemployment among nondeferred AFDC/FIP recipients. Project Zero sites undertook surveys of client barriers to employment, and then sites were provided with increased resources to help alleviate those barriers. In the first six sites, these funds were primarily used for additional child care and transportation services, for example, giving funds to a
360
M I C H I G A N AT T H E M I L L E N N I U M
day-care center to expand its hours of service (Seefeldt, Sandfort, and Danziger 1997). In the first year of operation, one site (Ottawa County) attained the goal of zero unemployment, and all six sites showed higher rates of cases with earned income than the rest of the state. For example, in February 1997, 54% of Project Zero cases expected to work had earnings during the month, compared with 35% of cases in the balance of the state (Seefeldt et al. 1998). Project Zero was expanded to all FIA offices by October 2000. As of February 2002, all but twelve of FIA’s 104 offices had reported zero unemployment at least once since implementing Project Zero.
Work Supports for Welfare Recipients For welfare reform to be successful in moving recipients to work, other types of assistance, besides cash and job search assistance, are needed. Child care and transportation problems are frequently mentioned hurdles for recipients attempting to enter or stay in the workforce. Many states, including Michigan, have invested funds to provide such assistance. Earnings disregards are another tool the state uses to support the work efforts of welfare recipients. Finally, the federal Food Stamp program can be an important source of income for families moving from welfare to work. This section discusses work-support programs and policies.
Child Care The federal government and states have greatly expanded child-care spending since 1996. PRWORA enhanced several sources of federal child-care funding (AFDC Child Care, Transitional Child Care, At-Risk Child Care, and the Child Care Development Block Grant—CCDBG), each with different eligibility rules, and consolidated them into the Child Care and Development Fund (CCDF). Consolidation has the potential to eliminate gaps in coverage that existed under the old system. For example, consider a working AFDC recipient who received child-care assistance through the AFDC system. When she left welfare, she could continue to receive assistance for up to another year through the Transitional Child Care program. However, she might have had to make a separate application, potentially going without child-care assistance while her application was
processed. With the CCDF, families in Michigan fill out one application that covers all eligibility categories (Seefeldt et al. 2001). Approximately twenty billion dollars are available to states through CCDF for the period 1997 to 2002, a 25% increase over spending prior to 1996 (U.S. House of Representatives 2000). States can increase funding further by moving TANF funds into the CCDF. Of the more than $3 billion in TANF funds allocated to it between 1997 and 2000, Michigan has transferred just under $3 million to the CCDF (U.S. Department of Health and Human Services 2001a). As with TANF, states must match federal CCDF funds. Federal regulations specify that CCDF funds may be used only for care of children under age thirteen in families with income up to 85% of the median state income (although states can set lower age and income limits). In Michigan, employed FIP recipients and those participating in Work First are automatically eligible for childcare assistance. Other low-income families with qualifying children may receive assistance if monthly income does not exceed certain limits (188% of the poverty line in 1999 and about 56% of the median state income), although they have a co-pay. Unlike a number of other states, Michigan does not have a waiting list to receive child care assistance (Seefeldt et al. 2001). Families can choose any type of care—a child day-care center, a nonlicensed family day-care home, a group day-care home (license required, and more children allowed than a family day-care home), a relative, or a nonrelative in-home day care provider (called a day-care aide). In-home care provided by a relative accounted for nearly half of the child-care settings receiving FIA subsidies in 1998. The next most common were centerbased (18%) and in-home care by nonrelatives (16%). Eleven percent of providers that the state supported were family child-care homes, and 9% were family group homes (Public Sector Consultants, Inc. 1998). Child-care providers are reimbursed for care. The amount up to which FIA will reimburse providers is determined by a legislatively mandated market rate survey for different types of providers in different areas of the state, with maximum reimbursement currently set at 75% of the market rate. Rates of reimbursement have not been adjusted for several years, and, as of 1 June 1999, the reimbursement rates in Michigan were based on the seventy-fifth percentile of the 1995–96 market (Seefeldt et al. 2001).
361
Michigan’s Welfar e System
Transportation Assistance Both FIA and Work First can provide transportation assistance to recipients to attend Work First, look for a job, or go to work. This assistance can take the form of bus tickets, mileage reimbursement, funds to repair a personal automobile, or, under some circumstances, funds to help purchase a car. The maximum amount available for car repairs is $900 (per twelve-month period) and the maximum for car purchase is $1,200 per participant. For fiscal year 2000, FIA spent $5.4 million for car repair, $6.2 million for car purchase, and $300,000 for other transportation-related costs (Michigan Family Independence Agency 2001a).
Earned-Income Disregards Under AFDC, when a recipient first went to work, the first $120 and an additional 33% of the remainder of his or her earnings were not counted, or were disregarded, when calculating the grant amount. However, after four months of employment, this disregard was eliminated, and the recipient’s grant would be reduced by nearly a dollar for every dollar he or she earned. PRWORA allows states to set their own earnedincome disregard policies. Three states have retained the old AFDC policy, but the rest, including Michigan, have policies that allow recipients to keep more of their earnings (Seefeldt 2002). Michigan retains its waiver policy of not counting the first $200 per month and an additional 20% of remaining earnings. Blank and Schmidt (2001) categorize the state’s earned-income disregard as “medium” in terms of its generosity relative to that of other states. A low-wage working recipient would keep more money (benefits plus wages) in the Midwestern states of Illinois, Iowa, and Ohio than in Michigan.
all (80% to 90%) welfare recipients are eligible for and receive food stamps. For most of the Food Stamp program’s history, benefits were issued in the form of vouchers (stamps) that allowed families to purchase food but not other items. In the 1990s, some states received waivers to “cash out” food stamps, allowing recipients to receive benefits in the form of a check. This provided the flexibility to purchase nonfood items and eliminated the stigma of using food stamps in a grocery store. In May 1996, Michigan implemented a cash-out program for recipients who had earnings of at least $350 a month for three consecutive months. PRWORA requires states to convert food stamps to an Electronic Benefit Transfer (EBT) system. Instead of getting stamps or checks, recipients receive a card, much like an ATM card, to use at grocery or other authorized food retailers. As of July 2001, food stamp beneficiaries in Michigan receive a “Bridge Card” through which they can access their monthly food stamp and FIP benefits. Welfare reform’s emphasis on work has major implications for the Food Stamp program. The federal government oversees a quality-control system for food stamps, whereby states must monitor the rate at which they make mistakes in eligibility or benefit issuances. States can be assessed financial penalties if they have high error rates. Between fiscal years 1996 and 2000, Michigan had food stamp error rates between 11% and 16%, above the national average of 9% to 10%, and faces up to $20 million in sanctions from the federal government (Michigan Family Independence Agency 2001b). Most of the errors resulted from overpayments, which the state has attributed to the fluctuating earnings of working recipients. While PRWORA’s flexibility allows Michigan to adjust FIP benefits only when income changes by $100 or more from month to month, federal Food Stamp rules mandate that states take into account any variation in income when computing benefits.
Food Stamps Food Stamps is a federal food-assistance program for low-income families. Benefits are 100% federally funded, and are adjusted each year for inflation. Most program rules are set by the federal government, although states can request waivers. Food stamps are available for lowincome individuals, childless families, and families with children, unlike AFDC and TANF. Nearly
Welfare, Food Stamp, and Child Care Caseloads In the media, dramatic reductions in the number of families receiving TANF have been noted as a great success of welfare reform. Between January 1993 and January 2002, the number of families on welfare was cut by 58% nationwide and by 66% in
362
M I C H I G A N AT T H E M I L L E N N I U M
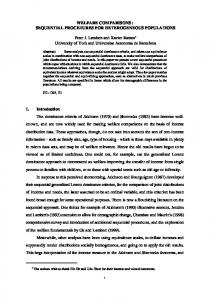
FIGURE 17.1N
Changes in Michigan Caseloads, 1995–2001
Cases (in tens of thousands of families)
45 40 389393
370821
35
331851 330819
30
305079
25 20
AFDC/FIP
186484
FS 15
Child Care 103046
10 5
73293 24470
58493
59425
77163 57162
68958 62460
0 Oct-95 Oct-96 Oct-97 Oct-98 Oct-99 Oct-00 Oct-01 Feb-02 Jul-02 SOURCE: Michigan Department of Social Services (1995b); Michigan Family Independence Agency (1996,
1997b, 1998b, 1999, 2000b, 2001e, 2002d, 2002e).
Michigan. A variety of factors have been credited with spurring that decline, including welfare policies, other federal policy changes, and the booming economy. This section discusses welfare and related caseload trends, and the potential impact of policies and the economy on those trends.
Caseload Trends In most states, including Michigan, caseload declines pre-date PRWORA. As shown in figure 17.1, just under 190,000 families received FIP (TANF) in October 1995. One year later, the FIP caseload was down to 166,000 families. The decline continued steadily until the end of fiscal year 2000, when the caseload was about 68,000 families. As the economy went into recession, caseloads grew to approximately 77,000 families in early 2002. By July 2002, that number was back down to just under 69,000. The composition of the caseload has also changed. In fiscal year 1995, just over half (52%) of adults on FIP were African American, 43% were white, and 3% Hispanic (U.S. Department of Health and Human Services, n.d.). In 2000, nearly 57% of adults on FIP were African American and 38% were white (Michigan Family Independence Agency 2001c). With TANF’s time limits and work requirements, some caseload decline was anticipated.
Less expected, though, were the declines seen in the Food Stamp program, both nationally and in Michigan. Nationwide, the number of households receiving food assistance through this program dropped by 36% over the 1996–2000 period. In Michigan, the drop has not been as great, with Food Stamp rolls (including those who received cashed out benefits) declining by 29% and then starting to rise in late 2000. The Food Research and Action Center, a Washington, D.C.–based advocacy group, ranks Michigan as one of the top ten states with regard to the estimated proportion of Food Stamp–eligible persons receiving assistance (Food Research and Action Center 2002). On the other hand, the caseload of the Child Day Care program has steadily increased. Figure 17.1 shows that the number of families receiving child care assistance has more than doubled since 1995 (from 24,000 cases in October 1995 to about 62,000 in July 2002). State policy makers attribute the increase in Child Day Care cases to increases in employment (Michigan Family Independence Agency 2001a). Of cases in which the adult is expected to work, the proportion with earnings grew from 37% in October 1996 to 72% by the end of 2000 (Michigan Family Independence Agency 2001d). Also, in late 1996, about 30% of FIP cases closed were due to increased earnings, but by the end of 2000, closures due to earnings accounted for almost half of all closures (Michigan Family Independence Agency 1997a; 2000a). Both working recipients and many of those whose cases were closed due to earnings are eligible for childcare assistance.
Welfare Policies and Caseload Declines Federal welfare reform and state policies, such as Work First and Project Zero, have contributed to higher employment among FIP recipients and reductions in the caseload. While work is one route off welfare, other policies also have reduced the welfare rolls. Sanctions. In Michigan, failure to participate in Work First and to find employment can result in sanctions. Michigan’s sanction policy is fairly severe compared to those of other states. As of April 1997, recipients on FIP for fewer than sixty days who do not comply with Work First may be terminated immediately from both the FIP and Food Stamp rolls. This is an immediate, full-family sanction, in that the entire case is closed and
363
Michigan’s Welfar e System
must remain so for at least one month. Recipients who have been on FIP for at least sixty days face a 25% reduction in both FIP and Food Stamp benefits for noncompliance with Work First, with case closure occurring after four months of noncompliance. Legislation modifying the state sanction policy went into effect in mid-2002. Clients have ten days to show good cause for noncompliance. If the client is still determined to be noncompliant, the entire case is closed for at least one month. Time Limits. In most states, welfare recipients can also lose TANF benefits when they reach a time limit. PRWORA requires recipients to be engaged in a work activity within twenty-four months of coming on the welfare rolls, or cash assistance can be terminated. However, Michigan’s regulations specify immediate referral to Work First for new applicants and for current recipients who are unemployed, so the twentyfour-month time limit is not a factor. Additionally, receipt of TANF benefits, with few exceptions, is limited to sixty months during one’s lifetime, or less at state option. Just over half (twenty-eight) of states, including the Midwestern states of Illinois, Iowa, Minnesota, and Wisconsin, adopted the sixty-month federal policy. The other twenty-two states have policies that limit benefits for a certain number of months, followed by a period of ineligibility before the recipient can reapply (thirteen states), limit benefits to fewer than sixty months (five states), or limit assistance to adults, allowing children to continue receiving cash assistance, either up to sixty months or indefinitely (Seefeldt 2002). Michigan must abide by the prohibition against using federal funds to provide cash assistance to adults beyond the sixty-month limit. However, it has not adopted a time limit. Only Vermont has a similar time-limit policy. In December 2001, approximately 4,500 Michigan families on FIP, or about 6% of the caseload, had exceeded the sixty-month federal limit (Michigan Family Independence Agency 2002b). The state continues to provide cash grants to these cases by using state funds.
Caseload Trends and the Economy While federal and state reforms put increased pressure on recipients to leave welfare for work,
the reforms were implemented during a period of unprecedented economic growth. Given the booming economy in the late 1990s, it is likely that some welfare recipients would have entered the labor force even in the absence of welfare reform. The Council of Economic Advisers attempted to sort out the effect of welfare reform on caseloads versus the effect of the economy. By their estimates, welfare reform policies played a small role in the caseload declines between 1993 and 1996, but accounted for approximately one-third of the caseload declines between 1996 and 1998. The economy was estimated to have had a large effect (26% to 36%) on pre-PRWORA declines but much less (about 8% to 10%) between 1996 and 1998 (Council of Economic Advisers 1999). Similar analyses were undertaken to examine national Food Stamp caseload declines. Here, drops in state unemployment rates accounted for twothirds of caseload reductions, and changes in welfare and child-care policies the other third (Jacobs et al. 2001). Other, nonwelfare policies, primarily a 1997 increase in the minimum wage and the expansion of the Earned Income Tax Credit (EITC), have made it much more beneficial for welfare recipients to go to work, and may also account for welfare and Food Stamp caseload reductions. The EITC provides tax relief to low- and moderateincome families in the form of a refund, even if the family’s earnings were so low that they did not owe income taxes. By the late 1990s a minimumwage worker employed full–time, full-year could receive an EITC of more than $3,500 if he or she had two or more children. As the nation’s and Michigan’s economy experienced a recession in 2001, the relationship between caseloads and the economy was evident. From 2000 to 2001, the total number of TANF cases nationwide declined by 4%. However, between March and December 2001, thirty-three states, including Michigan, experienced increases (Center for Law and Social Policy 2002b). With the exception of a few very small increases, Michigan’s welfare caseload had declined steadily since March 1994, reaching a low of 66,715 in November 2000 (Michigan Family Independence Agency 2001c). After that, caseloads began to rise in nearly every month, reaching more than 77,000 families in early 2002, the approximate size of the caseload in December 1999 (Michigan Family Independence Agency 2000a, 2002a). Although caseloads began to fall after that, they are still higher than the November 2000 low.
364
M I C H I G A N AT T H E M I L L E N N I U M
TABLE 17.3N
Comparison of Expenditures for Welfare, Child Care, and Food Stamps, FY 1995 and 2000
Cash Benefits (AFDC and FIP)
a
Education, Training, and Work Assistanceb (JOBS/MOST and Work First) Child Carec Food Stamp Benefits TOTAL
FY 1995 (in millions)
FY 2000 (in millions)
$636.0 (federal) $482.9 (state)
$160.9 (federal) $180.1 (state)
$56.3 $35.9 $66.0 $27.4 $902.6 $2,207.1
(federal) (state) (federal) (state) (federal)
$165.4 $6.9 $197.9 $269.4 $465.8 $1,446.4
(federal-TANF) (state) (federal) (state) (federal)
SOURCES: California Dept. of Social Services (1999); Greenberg and Richer (2002); Seefeldt et al. (1998); U.S. Department of Health and Human Services (2002). NOTES: Amounts reported in 2001 dollars. (a) State funds are AFDC matching funds (1995) and TANF maintenance of effort funds (2000). (b) State funds are JOBS matching funds (1995) and TANF maintenance of effort funds (2000). (c) Federal Child Care funds in 1995 include those from AFDC, the At-Risk Child Care Program, and the Child Care Development Block Grant. State funds for 1995 are the matches required under AFDC and the At-Risk program. Federal funds for 2000 include TANF funds expended on child care and funds spent through the Child Care Development Fund (CCDF). State funds in 2000 are CCDF matching funds and the TANF maintenance of effort funds spent on child care.
Caseload Trends and Expenditures Welfare caseload declines have also affected overall spending on benefits and services to welfare recipients. As shown in table 17.3, federal and state expenditures on AFDC benefit payments, education, training, and work assistance through JOBS, child care, and Food Stamp benefit payments exceeded $2.2 billion in fiscal year 1995. By fiscal year 2000, spending had dropped to slightly more than $1.4 billion. However, nearly all of the spending decline was driven by decreases in direct benefits through FIP and food stamps. The shift in the goal of welfare, from providing income support to providing work supports, is reflected in increased spending in 2000 on job-related and child-care assistance, particularly the latter. For example, in fiscal year 2000, the Family Independence Agency expended more state and federal funds on the Child Day Care program ($467 million) than it did on FIP benefit payments ($341 million).
Welfare Recipients in Michigan, Post-Reform The previous discussion of declining caseloads and increased employment does not provide any information on the economic well-being of families who have left welfare. The Women’s Employment Study (WES), conducted by the Program on Poverty and Social Welfare Policy at the University of Michigan, surveyed about 750 women from one
urban Michigan county who received FIP in February 1997. Interviews were conducted in 1997, 1998, and 1999, and the resulting data contain information on respondents’ education, employment, welfare receipt, family income, physical health, mental health, and other personal characteristics. This section presents selected WES findings (see Danziger et al. 2000; Danziger and Seefeldt 2002; Danziger et al. 2002). All WES respondents were single mothers receiving FIP in February 1997. By the fall of 1999, only 32% still received FIP. Many left welfare for work; employment rates increased (from 40% in February 1997 to 73% in fall 1999), as did hours of work. Not only has the level of work increased, but so too has the proportion of women who worked but did not receive cash welfare (FIP)—from 20% in fall 1997 to 52% in fall 1999. Median hourly wages of those who work have also increased over time, from about $6.00 per hour in 1997 to just under $7.00 per hour in 1999. However, many experienced employment instability—almost half of employed respondents reported at least one spell of unemployment during the study period. These respondents usually were fired, were laid off, or quit due to dissatisfaction with the job. A small subset of respondents did not work at all or worked very little over the study period. Some of these women are now married or living with a partner, and rely on that person’s earnings. However, some have remained on welfare, and others have cycled between welfare and work. Comparing respondents who accumulated few
365
Michigan’s Welfar e System
months of work over the study period to those with more, the former group are more likely to have various barriers to employment, such as no high school diploma or GED, few job-related skills, lack of transportation, and mental health problems, which persist over time for some respondents. WES respondents who left welfare for work had higher net incomes and lower poverty rates than those who still relied on welfare for support. Average annual income (in 1998) of work-reliant respondents was $17,000, while those on welfare (with and without working) had incomes between $9,000 and $13,000. Just under half of the wagereliant had annual incomes below the federal poverty line, while between 70% and 88% of those who received welfare for most of the year were below the poverty line.
TABLE 17.4N
Prevalence of Selected Employment Barriers, Women’s Employment Study, Fall 1999 Barrier
No HS diploma/GED Reads below fifth-grade level Low work experience Major depressive disorder Post-traumatic stress disorder Generalized anxiety disorder Social phobia Alcohol dependence Drug dependence Physical health problem Experienced domestic violence Transportation problem Child-care problem
Wage Reliant
20% 16% 10% 16% 10% 7% 5% 1% 1% 13% 5% 19% 8%
SOURCE: University of Michigan, Program on Poverty and Social Welfare Policy (2001).
Issues for Future Consideration Welfare reform has been hailed by many as a success, due to increased work effort on the part of current and former recipients and decreased caseloads and expenditures. However, the recession of 2001–02 and other factors may present challenges to the state. We conclude with a discussion of these issues, and suggest some policy options for consideration if it is desired to address these concerns.
Welfare Reform and Slower Economic Growth PRWORA and many state-level reforms were implemented during a period of unprecedented economic growth, both nationally and in Michigan. Low unemployment and the availability of jobs have helped welfare recipients meet work requirements. It is less clear how a workbased welfare system will operate during a prolonged economic slowdown. When jobs are less plentiful, Work First may need to expand the education and training component of the program and increase enrollment in those activities, or the state may need to design other options for recipients to meet the work requirement. Also, an economic slowdown may lead to increased spending for welfare services, as caseloads grow. The experience during the slowdown in 2001 indicates that some recipients returned to the rolls and others perhaps entered welfare for the first time, since, as noted earlier, FIP caseloads
increased throughout 2001 and early 2002. The state’s current TANF surplus could disappear if caseload growth continues.
Caseload Composition Another factor that could affect the state’s budget is the needs of current FIP recipients. With welfare caseloads declining so sharply, many speculate that those left on the rolls are increasingly “hardto-serve,” with many impediments to employment. The Women’s Employment Study collected data on barriers to employment in the domains of: (a) education and work experience; (b) psychiatric disorders or substance dependence; (c) physical health problems; and (d) other barriers such as domestic violence, transportation problems, and child-care problems. Table 17.4 compares the prevalence of some of these barriers between WES respondents who worked and did not receive welfare in the fall of 1999 survey month (wage reliant) with those who were not working and were receiving FIP (welfare reliant). Previous research has shown that these barriers negatively affect the likelihood of working (see Danziger et al. 2000). A greater proportion of welfare-reliant women had each of the barriers, and with the exception of work norms and low literacy, the differences are statistically significant. Not only are welfare-reliant women more likely to have these barriers than wage-reliant women,
Welfare Reliant
48% 24% 25% 28% 23% 14% 18% 4% 8% 44% 23% 57% 18%
366
M I C H I G A N AT T H E M I L L E N N I U M
the prevalence of many of these barriers among the welfare reliant are quite high. For example, between 18% and 28% meet the diagnostic screening criteria for at least one psychiatric condition, whereas national studies of women find rates of 4% to 13%. More than half of the welfare reliant have a transportation problem (compared to 8% nationally), and nearly half lack a high school diploma or equivalency certificate (national average is 13%) (Danziger et al. 2000; University of Michigan 2001).
Possible Policy Options and Service Delivery Strategies As welfare reform continues to evolve, Michigan might consider adopting different policies and services to deal with recipients who lose jobs, especially when unemployment increases, and with those for whom Work First has not proven an effective employment strategy, especially those with multiple barriers to work. Policies and services we will discuss in this section are: assessment and referral, community service jobs, and supported work. Assessment and Referral. The kinds of personal problems documented for Michigan TANF recipients in table 17.4, particularly mental health, domestic violence, and other barriers, may not be easily observed by welfare office staff. Recipients themselves may not be aware they have a mental health problem, or they may be reluctant to talk about it with a welfare caseworker. In Michigan, as in many other states, self-disclosure is the primary means by which a caseworker finds out about a recipient’s potential problems (Danziger and Seefeldt 2000; Thompson and Mikelson 2001; U.S. General Accounting Office 2001). A few states have developed programs that use trained staff or standardized instruments to identify a wide range of problems and provide mental health, substance abuse, and other counseling/ treatment services. For example, TANF workers in Utah screen clients for a number of barriers using a standardized tool. If the results from that screening indicate a possible mental health or substance-abuse problem, the client is seen by a trained social worker, who administers further diagnostic assessment tests and makes appropriate referrals for services (Thompson and Mikelson 2001).
Community Service Jobs. In Community Service Jobs (CSJ), sometimes called Public Service Employment), clients work in public-sector jobs or in nonprofits in exchange for their welfare checks. A frequently mentioned benefit of CSJ is that recipients have an employment opportunity, while providing often-needed services for the community (Savner and Greenberg 1997). For example, CSJ participants might do landscaping in public parks or serve as teacher’s aides in schools. Washington and Wisconsin are two states in which CSJ is a major activity for TANF recipients. Participation in CSJ can serve a dual purpose. First, clients who are unable to find regular employment because they lack work experience can gain skills and experience. Second, CSJs may be an option for clients who have lost jobs and cannot find employment due to slack labor markets. Supported Work. Supported work programs have received attention as a policy option for “hard-to-employ” TANF recipients, because of their success in working with other difficult-toemploy populations, particularly the physically and developmentally disabled, as well as those with severe mental illness. In supported work programs, participants work in a job, but with more supervision and structure than in the private sector, and they also receive services to address problems that might interfere with employment. For example, participants might work in a production facility run by a nonprofit, such as a Goodwill or other vocational rehabilitation agency. While working, they are overseen by a job coach, who monitors the employees’ work skills, as well as their “soft skills,” such as their ability to get along with co-workers and supervisors. Case managers also provide assistance with personal and family challenges, making referrals to services as necessary (Pavetti and Strong 2001). After working successfully in this environment, many clients can move into private-sector employment. Currently, a number of supported-work programs serving TANF recipients operate throughout the country, including several in Michigan.
Trends in Poverty Welfare has always been the United States’ most controversial anti-poverty program. Yet, cash assistance plays a relatively small role in our income-support system as a whole. For example,
367
Michigan’s Welfar e System
FIGURE 17.2N
Trends in U.S. and Michigan Poverty Rates, All Families, 1980–1999 Percentage of families below poverty line
the typical social security recipient receives several times as much per month as the typical welfare recipient. Nonetheless, a discussion of welfare reform would not be complete without a discussion of recent trends in poverty. Figure 17.2 shows the official poverty rate for all families in the United States and in Michigan for each year between 1980 and 1999; it also shows the Michigan unemployment rate. In 1999, the official poverty line was $16,895 for a family of four with two related children, and about half that for one person living on his or her own. The census reports pre-tax money income and thus does not include noncash income, such as Food Stamps, or tax credits, such as the Earned Income Tax Credit, and does not exclude taxes paid. The poverty line varies with family size and has been increased since the mid-1960s only to correct for inflation. Many researchers prefer an alternative measure of poverty—valuing noncash income and tax credits would lower the poverty rate, while choosing an updated poverty line would raise the poverty rate. However, Burtless and Smeeding (2002) show that in recent years trends in the official and alternative measures that take the criticisms of the official poverty rate into account are similar. The family poverty rate (which excludes households with only one person) increased in the early
16 14 12 10 8 6 U.S. Poverty Rate
4
MI Poverty Rate 2
MI Unemployment Rate
0 1980
1983
1986
1989
1992
from the Census Bureau’s annual March Current Population Survey.
1980s to about 14% in both the United States (1985) and in Michigan (1983) as a result of the severe recession during that period. Poverty then declined to about 10.5% in both in the late 1980s, rose some during the recession of the early 1990s, and then fell throughout the rest of the 1990s to about 9% of families in the United States and 7% in Michigan in 1999. Results are similar for the
FIGURE 17.3N
70
Percentage below poverty line
White Families 60
Black Families Married Families
50
Female Head Families
40 30 20 10 0 1983
1986
1989
1992
1995
1998
Year SOURCE: Professor James Ziliak, Department of Economics, University of Kentucky, based on calculations from the Census Bureau’s annual March Current Population
Survey.
1998
SOURCE: Professor James Ziliak, Department of Economics, University of Kentucky, based on calculations
Trends in Michigan Poverty Rates by Race and Family Type, 1980–1999
1980
1995
Year
368
M I C H I G A N AT T H E M I L L E N N I U M
trend in poverty for all persons. In 1999, 11.8% of all persons in the United States were poor, compared to 10.8% in Michigan. The unemployment rate and the poverty rate in Michigan are highly correlated. For example, when unemployment in Michigan rose from 11.5 to 15.1% between 1980 and 1983, the poverty rate followed; when the state unemployment rate rose from 7 to 9.2% between 1989 and 1992, the state poverty rate rose again. This is not surprising, as earned income is the largest component of family income, and hence, changes in earnings brought about by the business cycle have a strong effect on poverty. Data on poverty in cities is available only from the Decennial Censuses. The city of Detroit has a very high poverty rate, 26.1% in 1999, making it one of five cities among the largest fifty to have a poverty rate above 25%. However, Detroit’s poverty rate fell over the 1990s from 32.4% in 1989, when it had the highest rate of any of the fifty largest cities (Metzger and Booza 2002). Figure 17.3 shows trends in family poverty in Michigan by race—families whose head is white or black—and by family structure—families headed by married couple or an unmarried woman. Poverty rates are much higher for families headed by an African American and by an unmarried woman, but trends are similar. Between 1989 and 1999, the family poverty rate fell from 7.4 to 4.3% for white families and from 32.3 to 23.5% for black families. Poverty rates for families headed by women fell from about 51% in 1994 to 35% in 1999.
Summary The 1996 welfare reform act was to be reauthorized by Congress in 2002, although in late fall 2002, Congress extended the deadline to March 2003. Most analysts agree that reform, in Michigan and the nation, has contributed to large reductions in welfare caseloads, large increases in work by single mothers, and small reductions in poverty. However, poverty rates remain high for many single mothers who have made the transition from welfare to work and for those who have had a difficult time finding or keeping a job, even when the economy was booming. A recent public opinion poll shows that while an overwhelming majority of Americans (85%) believe moving welfare recipients into work is a very important goal of welfare reform, just slightly fewer (74%) also
think welfare reform should result in fewer poor families (Lake, Snell, Perry, and Associates 2002). A challenge for the next decade is to raise both incomes and employment of Michigan families at the lower end of the economic ladder. ■
REFERENCES Blank, Rebecca. 1997. It takes a nation. New York: Russell Sage Foundation. Blank, Rebecca, and Lucie Schmidt. 2001. Work, wages, and welfare. In The new world of welfare. Washington, D.C.: Brookings Institution Press. Burtless, Gary, and Timothy Smeeding. 2002. The level, trend, and composition of poverty. In Understanding poverty. New York: Russell Sage Foundation. California Department of Social Services. 1999. Food stamp household characteristics survey. www.dss .cahwnet.gov/research/res/pdf/foodstamp99.pdf. Accessed August 2002. Center for Law and Social Policy. 2002a. Analysis of fiscal year 2000 TANF and MOE spending by states. Washington, D.C.: Center for Law and Social Policy. ———. 2002b. New data show most states had TANF caseload increases in last year. Washington, D.C.: Center for Law and Social Policy. Council of Economic Advisers. 1999. The effects of welfare policy and the economic expansion on welfare caseloads: An update. Washington, D.C.: CEA. Danziger, Sandra K., Mary Corcoran, Sheldon Danziger, Colleen Heflin, Ariel Kalil, Judith Levine, Daniel Rosen, Kristin S. Seefeldt, Kristine Siefert, and Richard Tolman. 2000. Barriers to the employment of welfare recipients. In Prosperity for all? New York: Russell Sage Foundation. Danziger, Sandra K., and Kristin S. Seefeldt. 2000. Ending welfare through work first. Families in Society 81 (6): 593–604. ———. 2002. Barriers to employment and the “hard to serve”: Implications for services, sanctions, and time limits. Focus 22 (1): 76–81. Danziger, Sheldon. 2001. Welfare reform policy from Nixon to Clinton. In Social science and policy making. Ann Arbor: University of Michigan Press. Danziger, Sheldon, Colleen M. Heflin, Mary E. Corcoran, Elizabeth Oltmans, and Hui-Chen Wang. 2002. Does it pay to move from welfare to work? Journal of Policy Analysis and Management 21(4): 671–92. Food Research and Action Center. 2002. State of the states: A profile of food and nutrition programs
369
Michigan’s Welfar e System
across the nation. Washington, D.C.: FRAC. Gallagher, Jerome. 1999. A shrinking portion of the safety net: General Assistance from 1989 to 1998. Washington, D.C.: Urban Institute. Greenberg, Mark, and Elise Richer. 2002. Analysis of fiscal year 2000 TANF and MOE spending by states. Washington, D.C.: Center for Law and Social Policy. www.clasp.org/Pubs/TANF/michigan.pdf. Accessed August 2002. Gueron, Judith M., and Edward Pauly. 1991. From welfare to work. New York: Russell Sage Foundation. Henly, Julia R., and Sandra K. Danziger. 1996. Confronting welfare stereotypes: Characteristics of General Assistance recipients and post-Assistance employment. Social Work Research 20 (4): 217–27. Holcomb, Pamela, LaDonna Pavetti, Caroline Ratcliffe, and Susan Riedinger. 1998. Building an employment-focused welfare system: Work First and other work-oriented strategies in five states. Washington, D.C.: Urban Institute. Jacobs, Jonathan, Nuria Rodriguez-Planas, Loren Puffer, Emily Pas, and Laura Taylor-Kale. 2001. The consequences of welfare reform and economic change for the Food Stamp program: Illustrations from microsimulation, final report. Washington, D.C.: USDA. Kaplan, Jan. 2002. TANF reauthorization and time limits. Welfare Information Network Reauthorization Notes, May 2002. http://www.welfareinfo.org/ timelimits_trn.htm. Accessed August. Kossoudji, Sherrie, Sandra K. Danziger, and Robert Lovell. 1993. Michigan’s General Assistance population: An interim report of the General Assistance Termination Project. Ann Arbor: University of Michigan. Lake, Snell, Perry, and Associates. 2002. Public views on welfare reform and children in the current economy. Prepared for the David and Lucile Packard Foundation, February 2002. http://www .futureofchildren.org/usr_doc/lsp_welfare_survey. PDF. Accessed September 2002. Levitan, Sar A. 1985. Programs in aid of the poor. Baltimore, Md.: Johns Hopkins University Press. Metzger, Kurt, and Jason C. Booza. 2002. Poverty in the United States, Michigan, and metropolitan Detroit: An analysis of Census 2000. Working paper, Center for Urban Studies. Detroit: Wayne State University. Michigan Department of Career Development. 2002. Preliminary data from MWA extract, March 2002. Lansing, Mich.: MDCD. Michigan Department of Social Services. 1995a. To strengthen Michigan families: Welfare reform data monitoring, August–September 1995. Lansing, Mich.: MDSS.
———. 1995b. Assistance payments data, October, 1995. Lansing, Mich: MDSS. ———. 1996. Assistance payments data, June 1996. Lansing, Mich.: MDSS. Michigan Family Independence Agency. 1996. Assistance payments data, October, 1996. Lansing, Mich.: MFIA. ———. 1997a. Assistance payments data, December 1996. Lansing, Mich.: MFIA. ———. 1997b. Assistance payments data, October, 1997. Lansing, Mich.: MFIA. ———. 1998a. Project Zero data monitoring packet, December 1997. Lansing, Mich.: MFIA. ———. 1998b. Assistance payments data, October, 1998. Lansing, Mich.: MFIA. ———. 1999. Assistance payments data, October, 1999. Lansing, Mich.: MFIA. ———. 2000a. Assistance payments data, December 1999. Lansing, Mich.: MFIA. ———. 2000b. Assistance payments data, October, 2000. Lansing, Mich.: MFIA. ———. 2001a. 1999–2000 biennial report to the legislature. Lansing, Mich.: MFIA. ———. 2001b. Information packet, April 2001. Lansing, Mich.: MFIA. ———. 2001c. Assistance payments data, December, 2000. Lansing, Mich.: MFIA. ———. 2001d. Project Zero data monitoring packet, December 2000. Lansing, Mich.: MFIA. ———. 2001e. Assistance payments data, October, 2001. Lansing, Mich.: MFIA. ———. 2002a. Assistance payments data, January 2002. Lansing, Mich.: MFIA. ———. 2002b. Fact sheet, January 2002. Lansing, Mich.: MFIA. ———. 2002c. Project Zero data monitoring packet, December 2001. Lansing, Mich.: MFIA. ———. 2002d. Assistance payments data, February, 2002. Lansing, Mich.: MFIA. ———. 2002e. Assistance payments data, July, 2002. Lansing, Mich.: MFIA. Michigan Jobs Commission. 1995. Work First monthly report. Lansing, Mich.: MJC. November. ———. 1997. Work First monthly report. Lansing, Mich.: MJC. November. Nichols, Marion, and Kathryn Porter. 1995. General assistance programs: Gaps in the safety net. Washington, D.C.: Center on Budget and Policy Priorities. Nightingale, Demetra Smith, Terri Thompson, Nancy Pindus, Pamela Holcomb, Edgar Lee, Jesse Valente, and John Trutko. 2000. Early implementation of the Welfare-to-Work grants program: Findings from exploratory site visits and review of program plans.
370
M I C H I G A N AT T H E M I L L E N N I U M
Washington, D.C.: Urban Institute. Pavetti, LaDonna, and Debra Strong. 2001. Work-Based strategies for hard-to-employ TANF recipients: A preliminary assessment of program models and dimensions. Washington, D.C.: Mathematica Policy Research. Public Sector Consultants, Inc. 1998. Michigan in brief: 1998–99. 6th ed. Lansing, Mich.: Public Sector Consultants, Inc. Savner, Steve, and Mark Greenberg. 1997. Community service employment: A new opportunity under TANF. Washington, D.C.: Center for Law and Social Policy. Seefeldt, Kristin S., LaDonna Pavetti, Karen Macguire, and Gretchen Kirby. 1998. Income support and social services for low-income people in Michigan. Washington, D.C.: Urban Institute. Seefeldt, Kristin S., Jodi Sandfort, and Sandra K. Danziger. 1997. Project Zero: The view from the sites. Ann Arbor: University of Michigan. ———. 1998. Moving toward a vision of family independence: Local managers’ views of Michigan’s welfare reforms. Ann Arbor: University of Michigan. Seefeldt, Kristin S., Jacob Leos-Urbel, Patricia McMahon, and Kathleen Snyder. 2001. Changes to Michigan’s welfare and work, child care, and child welfare systems since 1997. Washington, D.C.: The Urban Institute. Seefeldt, Kristin S. 2002. Welfare reform: CQ Vital Issues series. Washington, D.C.: Congressional Quarterly Press. Their promises: Excerpts from the candidate’s basic stump speeches, a look at what they vow to do for the nation; Clinton. 1992. Decision ’92: Special Voter’s guide to the Presidential Election, Los Angeles Times, 18 October, 4. Thompson, Terri S., Pamela A. Holcomb, Pamela Loprest, and Kathleen Brennan. 1998. State welfare to work policies for people with disabilities: Changes since welfare reform. Washington, D.C.: U.S. Department of Health and Human Services, Assistant Secretary for Planning and Evaluation. Thompson, Terri, and Kelly Mikelson. 2001. Screening and assessment in TANF/Welfare-to-Work: Ten important questions TANF agencies and their partners should consider. Washington, D.C.: U.S. Department of Health and Human Services. U.S. Department of Health and Human Services, Administration for Children and Families. n.d. Aid to Families with Dependent Children, characteristics and financial circumstances of AFDC recipients FY 1995. Washington, D.C.: U.S. Department of Health and Human Services.
———. 1998. TANF annual report to Congress, 1998. Washington, D.C.: U.S. Department of Health and Human Services. ———. 1999. TANF annual report to Congress, 1999. Washington, D.C.: U.S. Department of Health and Human Services. ———. 2000. TANF annual report to Congress, 2000. Washington, D.C.: U.S. Department of Health and Human Services. ———, Office of Administration, Financial Services. 2001a. Spending under welfare reform. http://www .acf.dhhs.gov/programs/ofs/ data/index.html, 2001. Accessed April 2002. ———, Office of Administration, Financial Services. 2001b. Aid to Families with Dependent Children caseload data, 1977–1997. www.acf.dhhs.gov/ programs/opre/afdc/afdc.htm. Accessed March 2002. ———, Office of Administration, Child Care Bureau. 2002. Fiscal year 2000, Child Care Development Fund grant award summary. www.afc.dhhs.gov/ programs/ccb/research/00acf696/grant.htm. Accessed August 2002. U.S. General Accounting Office. 2001. Welfare reform: More coordinated federal effort could help states and localities move TANF recipients with impairments toward employment. Washington, D.C.: GPO. U.S. House of Representatives, Committee on Ways and Means. 1993. 1993 overview of entitlement programs. Washington, D.C.: GPO. . ———. 1994. 1994 overview of entitlement programs. Washington, D.C.: GPO. ———. 1996. 1996 overview of entitlement programs. Washington, D.C.: GPO. ———. 1998. 1998 overview of entitlement programs. Washington, D.C.: GPO. ———. 2000. 2000 overview of entitlement programs. Washington, D.C.: GPO. University of Michigan, Program on Poverty and Social Welfare Policy. 2001. Unpublished Women’s Employment Study data. Walsh, Edward. 1991. Michigan’s welfare cut, a “social experiment”; More “able-bodied” homeless are expected. Washington Post, 19 November, A1. Weaver, R. Kent. 2000. Ending welfare as we know it. Washington, D.C.: Brookings Institution Press. Weissert, Carol. 2000. Michigan’s welfare reform: Generous but tough. In Learning from leaders: Welfare reform politics and policy in five Midwestern states. Albany, N.Y.: Rockefeller Institute Press. Werner, Alan, and Robert Kornfeld. 1997. The evaluation of To Strengthen Michigan Families: Final impact report. Cambridge, Mass.: Abt Associates.