Aarhus et al. Cerebrospinal Fluid Research 2010, 7:6 http://www.cerebrospinalfluidresearch.com/content/7/1/6
RESEARCH
CEREBROSPINAL FLUID RESEARCH
Open Access
Microarray-based gene expression profiling and DNA copy number variation analysis of temporal fossa arachnoid cysts Mads Aarhus1,2,4*, Christian A Helland2,3, Morten Lund-Johansen2,3, Knut Wester2,3, Per M Knappskog1,4
Abstract Background: Intracranial arachnoid cysts (AC) are membranous sacs filled with CSF-like fluid that are commonly found in the temporal fossa. The majority of ACs are congenital. Typical symptoms are headache, dizziness, and dyscognition. Little is known about genes that contribute to the formation of the cyst membranes. Methods: In order to identify differences in gene expression between normal arachnoid membrane (AM) and cyst membrane, we have performed a high-resolution mRNA microarray analysis. In addition we have screened DNA from AC samples for chromosomal duplications or deletions using DNA microarray-based copy number variation analysis. Results: The transcriptome consisting of 33096 gene probes showed a near-complete similarity in expression between AC and AM samples. Only nine genes differed in expression between the two tissues: ASGR1, DPEP2, SOX9, SHROOM3, A2BP1, ATP10D, TRIML1, NMU were down regulated, whereas BEND5 was up regulated in the AC samples. Three of the AC samples had unreported human DNA copy number variations, all DNA gains. Conclusions: Extending results of previous anatomical studies, the present study has identified a small subset of differentially expressed genes and DNA alterations in arachnoid cysts compared to normal arachnoid membrane.
Background Arachnoid cysts (AC) are relatively common benign lesions, reported to be found in 1.1% of the adult population [1]. Typical symptoms in adults are headache, dizziness, seizures [2] and dyscognition [3]. Although ACs can be found throughout the central nervous system (CNS), they show a marked predilection for the temporal fossa (figure 1) [2,4-6]. In the majority of cases, skull indentations and a large corresponding temporal fossa, as seen on MRI or CT, suggest that ACs arise before the neurocranium is fully developed. Anatomically, ACs are formed by a splitting of the arachnoid mater (AM) [7-9]. The size of ACs is classified according to three Galassi types [10]. Briefly, a type I cyst is small, biconvex, and located at the anterior temporal pole. A type II cyst involves the proximal and intermediate segments of the Sylvian fissure, and a type III cyst * Correspondence:
[email protected] 1 Centre for Medical Genetics and Molecular Medicine, Haukeland University Hospital, NO-5021 Bergen, Norway
involves the entire Sylvian fissure, and has often a marked radiological mass effect. The cyst wall is composed of non-neoplastic arachnoid cells, and it has been suggested that these cells could secrete cerebrospinal fluid (CSF) [11,12]. The cyst fluid has a chemical composition similar to that of CSF [13-15]. Thus, the frequently seen stable size of ACs might represent a steady state where fluid influx equals the efflux. However, until a proteomic profiling comparing CSF and AC fluid is performed, it remains questionable how similar these fluids are. Given the likely congenital nature of ACs, it is possible that altered gene expression in neural crest cells at the time of leptomeningeal development may contribute to cyst formation. However, so far there has been very little research on the molecular biology of AC. Hence, putative candidate genes with a role in AC formation are yet to be found. Several methods are available for studying gene expression. As mRNA microarray has the advantage that it can be used to analyze a large number of genes simultaneously, it has
© 2010 Aarhus et al; licensee BioMed Central Ltd. This is an Open Access article distributed under the terms of the Creative Commons Attribution License (http://creativecommons.org/licenses/by/2.0), which permits unrestricted use, distribution, and reproduction in any medium, provided the original work is properly cited.
Aarhus et al. Cerebrospinal Fluid Research 2010, 7:6 http://www.cerebrospinalfluidresearch.com/content/7/1/6
Page 2 of 8
Methods Patients and tissue sampling
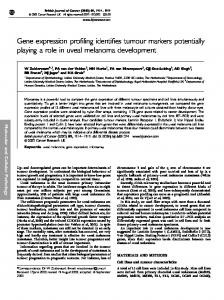
Figure 1 Radiological presentation of an arachnoid cyst (AC). Computed tomography (CT) scan of a large, left-sided temporal AC. Note the splitting of the Sylvian fissure and the compression of the frontal and temporal lobes, all classical features of a Galassi type 3 cyst [10]. The midline is displaced 6 mm to the right. Note the enlargement of the left cranial vault suggesting that the AC was present before the neurocranium was fully developed.
evolved to be the method of choice in screening projects of the transcriptome. Previously, we have characterized the molecular signature of intracranial meningiomas [16]. As these tumors derive from arachnoid cap cells, and normal arachnoid in sufficient quantities is difficult to obtain, we used samples from arachnoid cysts as control tissue. Therefore, it would be interesting to determine whether the gene expression signature of normal arachnoid membrane differs from that of AC membranes. If these signatures were similar, it would imply that AC tissue could be used as a justified source of control tissue in molecular biological studies of conditions involving the arachnoid, such as subarachnoid haemorrhage, meningiomas, and meningitis. In the current study we have performed a molecular characterization of temporal fossa AC membranes. The aims were: 1) to determine the general gene expression profile of AC samples compared with that of normal AM tissue. In this way we aimed at finding candidate genes with a role in AC development; 2) to search for DNA regions with altered copy number variations (CNV) in AC tissue. The study showed marked similarities in the gene expression profiles of the AC and AM samples; however, we identified a small subset of differentially expressed genes and DNA alterations in arachnoid cysts compared to normal tissue.
Tissue from sporadic, non-familial ACs, as well as normal arachnoid, was harvested during surgery and stored in liquid N2 in the Bergen neurosurgical tissue bank at the Department of Neurosurgery, Haukeland University Hospital, until analysis. A parallel sample was taken for histological verification of the diagnosis. We obtained written consent from the patients for the study, which was approved by the Regional Ethical Committee. A total of 11 temporal AC were included in the study (table 1), and we used samples from the arachnoid membrane (cisterna magna) of four adult patients as control tissue. These patients were all undergoing posterior fossa surgery for a solitary cerebellar tumour without radiological or intraoperative signs of extension to the cerebellar surface and removal of the arachnoid was part of the surgical procedure. Three of these patients had metastases from adenocarcinoma and one had a hemangioblastoma (not von Hippel-Lindau type). None of the patients had any signs of tumour cell dissemination to the arachnoid, and there was no history or MRI sign of previous haemorrhage in the patient with hemangioblastoma. Because of the very limited amounts of tissue available for analysis, not all the cysts and normal AM were studied with all the techniques; details are given under each method section below (see also table 1). RNA extraction and microarray
Seven AC and two controls were studied with mRNA microarray. The details of RNA extraction and microarray analysis have previously been reported [16]. Briefly, we used the Qiagen RNeasy minikit (QIAGEN GmbH, Hilden, Germany) to extract total RNA. After RNA quality and quantity assessment, we then constructed cDNA with RT-PCR reagents (Applied Biosystems, Foster City, USA). Gene expression microarray analysis was performed on the ABI 1700 Expression Array System (Applied Biosystems) using the Applied Biosystems Chemo luminescent RT-IVT Labeling Kit and Human Genome Survey Microarray V1.0. Analysis of microarray data
Signal intensities generated with the ABI 1700 Expression Array System were imported into the J-Express Pro 2.7 software (MolMine AS, Bergen, Norway) [17], where inter-array quantile normalization was performed to minimize the effect of external variables on the data. All control spots and flagged spots were removed, leaving 33096 gene probes available for analysis. First, we performed an unsupervised hierarchical cluster analysis in which the group belonging to the samples was defined. Second, we used Significance Analysis of Microarrays
Aarhus et al. Cerebrospinal Fluid Research 2010, 7:6 http://www.cerebrospinalfluidresearch.com/content/7/1/6
Page 3 of 8
Table 1 Demographic data and techniques used on membrane tissue from 11 arachnoid cyst (AC) patients and 4 arachnoid membrane (AM) patients. Case #
ID
Gender
Age
Galassi type
Side
Method of investigation
1
AC_2005-056
Male
52
3
Left
mRNA microarray, qRT-PCR, CNV
2
AC_2006-004
Female
34
2
Left
mRNA microarray, qRT-PCR, CNV
3 4
AC_2006-049 AC_2006-051
Male Female
50 35
3 2
Right Right
mRNA microarray, qRT-PCR, CNV mRNA microarray, qRT-PCR, CNV
5
AC_2006-058
Female
33
2
Right
mRNA microarray, qRT-PCR
6
AC_2008-005
Female
27
2
Left
mRNA microarray, qRT-PCR, CNV
7
AC_2008-010
Male
44
2
Left
mRNA microarray, qRT-PCR, CNV
8
AC_39
Male
51
1
Right
qRT-PCR
9
AC_2003_031
Male
54
2
Left
qRT-PCR
10
AC_2004_060
Female
64
3
Left
qRT-PCR
11 12
AC_2008-004 AM_2006-048
Male Female
9 82
2 n.a.
Left n.a.
qRT-PCR mRNA microarray, qRT-PCR
13
AM_2008-008
Male
49
n.a.
n.a.
mRNA microarray, qRT-PCR
14
AM_2006-044
Female
43
n.a.
n.a.
qRT-PCR
15
AM_2006-057
Female
53
n.a.
n.a.
qRT-PCR
qRT-PCR: quantitative reverse transcriptase real-time polymerase chain reaction, CNV: DNA copy number variation analysis, n.a: not applicable.
(SAM) with 400 and 1000 permutations to compare AC and AM samples [18] and generate gene lists of differentially expressed genes between these groups. With SAM, the false discovery rate (FDR) of the gene lists was calculated. FDR returned the number of false positive genes present on the gene list. A measure of FDR is the Q value, which conveniently shows an estimation of the FDR in percent. In the current study only genes with a Q value