agriculture Article
Microarray-Based Screening of Differentially Expressed Genes of E. coli O157:H7 Sakai during Preharvest Survival on Butterhead Lettuce Inge Van der Linden 1,2,3, *, Bart Cottyn 1 , Mieke Uyttendaele 3 , Geertrui Vlaemynck 2 , Marc Heyndrickx 2,4 , Martine Maes 1,5 and Nicola Holden 6 1
2
3 4 5 6
*
Institute for Agricultural and Fisheries Research (ILVO), Plant Sciences Unit—Crop Protection B. Van Gansberghelaan 96, Merelbeke B-9820, Belgium;
[email protected] (B.C.);
[email protected] (M.M.) Institute for Agricultural and Fisheries Research (ILVO), Food Sciences Unit—Food Safety Brusselsesteenweg 370, Melle B-9090, Belgium;
[email protected] (G.V.);
[email protected] (M.H.) Ghent University (UGent), Department of Food Safety and Food Quality, Laboratory of Food Microbiology and Food Preservation, Coupure links 653, Ghent B-9000, Belgium;
[email protected] Ghent University (UGent), Department of Pathology, Bacteriology and Poultry Diseases, Faculty of Veterinary Sciences, Salisburylaan 133, Merelbeke B-9820, Belgium Ghent University (UGent), Department of Biochemistry and Microbiology, Laboratory of Microbiology, K.L. Ledeganckstraat 35, Ghent B-9000, Belgium The James Hutton Institute, Cell and Molecular Sciences, Human and Animal Pathogens on Plants, Invergowrie, Dundee DD2 5DA, UK;
[email protected] Correspondence:
[email protected]; Tel.: +44-844-928-5428
Academic Editors: Pascal Delaquis and Susan Bach Received: 12 October 2015; Accepted: 13 January 2016; Published: 26 January 2016
Abstract: Numerous outbreaks of Escherichia coli O157:H7 have been linked to the consumption of leafy vegetables. However, up to the present, little has been known about E. coli O157:H7’s adaptive responses to survival on actively growing (and thus responsive) plants. In this study, whole genome transcriptional profiles were generated from E. coli O157:H7 cells (isolate Sakai, stx-) one hour and two days after inoculation on the leaves of growing butterhead lettuce, and compared with an inoculum control. A total of 273 genes of E. coli O157:H7 Sakai (5.04% of the whole genome) were significantly induced or repressed by at least two-fold (p < 0.01) in at least one of the analyzed time points in comparison with the control. Several E. coli O157:H7 genes associated with oxidative stress and antimicrobial resistance were upregulated, including the iron-sulfur cluster and the multiple antibiotic resistance (mar) operon, whereas the Shiga toxin virulence genes were downregulated. Nearly 40% of the genes with significantly different expression were poorly characterized genes or genes with unknown functions. These genes are of special interest for future research as they may play an important role in the pathogens’ adaptation to a lifestyle on plants. In conclusion, these findings suggest that the pathogen actively interacts with the plant environment by adapting its metabolism and responding to oxidative stress. Keywords: Escherichia coli O157:H7; lettuce; gene expression; preharvest
1. Introduction Leafy vegetables, such as lettuce, are considered a high-risk food since numerous outbreaks with enteric pathogens have been linked to the consumption of these products [1]. Escherichia coli O157:H7 (E. coli O157:H7) is one of the pathogens that is frequently involved and is of special interest due to the
Agriculture 2016, 6, 6; doi:10.3390/agriculture6010006
www.mdpi.com/journal/agriculture
Agriculture 2016, 6, 6
2 of 22
severe consequences of the illness it may cause. Infection may lead to bloody diarrhea, and, on rare occasions, kidney failure with damage to the central nervous system in severe cases. Young children, the elderly and immunocompromised persons are at higher risk of severe illness. The bacterium can enter the agricultural environment via animal feces and is able to enter our food chain from this point by, e.g., contaminating the irrigation water used for growing crops, or the use of untreated or non-sufficiently treated manure. As governments promote the consumption of a wide variety of fresh fruit and vegetables, it is important that there is no increased risk for foodborne infections. Therefore, the understanding of plant-pathogen interactions such as initial adherence, invasion and establishment is essential for the development of effective control measures. Numerous studies have investigated the factors which may influence the preharvest survival, growth and attachment of E. coli O157:H7 on growing plants. The majority of investigations focused on the influence of temperature, relative humidity, irrigation treatment, UV radiation, leaf age, crop stage, crop variety, etc. However, less is known about the underlying genetic mechanisms that E. coli O157:H7 uses to survive and proliferate on plants. On the plant surface, the pathogen may encounter various stresses. For example, nutrient scarcity is likely to occur, especially within the phyllosphere compared to a mammalian intestinal environment. This may enhance resistance of the pathogen to subsequent physical or chemical challenges and is thus highly relevant to the pathogen’s behavior during processing and storage of the produce, but has yet to be intensively investigated [2]. Gene expression profiling such as microarray technology is one of the techniques used to determine which adaptive and regulatory processes are involved in the pathogen response to specific environmental variables. Only a few microarray studies have been performed on the interaction between E. coli O157:H7 and fresh produce. Two studies mainly focused on post-harvest contamination. Kyle et al. (2010) [3] have investigated the short-term effects of the influence of leaf injuries and damaged leaf tissue on the gene expression of E. coli O157:H7 EDL933 on romaine lettuce leaf lysate. Fink et al. (2012) [4] have performed a study on the gene expression of pathogenic and a laboratory reference strain of E. coli (serotype K-12) on harvested, intact lettuce leaves. They have studied the mid-term effect (one to three days) on surface sterilized leaves. Preharvest contamination conditions were also investigated for E. coli K12 and O157:H7 interacting with the lettuce rhizosphere [5,6] but not with the phyllosphere, and this is important as this is the part of the crop that is consumed. Only recently was a report on the gene expression of E. coli O157:H7 on radish sprouts published [7]. The aim of the present study was to characterize the transcriptional response of E. coli O157:H7 Sakai during interaction with the phyllosphere of growing butterhead lettuce plants, which has relevance to previous food-borne outbreaks and horticultural production. Gene expression changes were assessed at two time points to represent the very initial interactions (at one hour post-inoculation) and after sufficient time to allow establishment and colony development (two days post-inoculation). 2. Experimental Section 2.1. Bacterial Strains and Culture Conditions E. coli O157:H7 Sakai strain RIMD 0509952 (Sakai; Stx- Kanamycin-resistant) was used and was previously described by Dahan et al. (2004) [8]. The Sakai strain was isolated from the Sakai city outbreak in Japan in 1996 [9,10] and possesses a double Shiga toxin knockout (stx knockout). A kanamycin cassette was inserted into the SmaI site in the stx2A gene, and a 0.6 kb BsiWI fragment, which contained the stx1A gene and the upstream region, was deleted [8]. Cells were pre-cultured in 5 mL LB and grown overnight at 37 ˝ C, 200 rpm. This culture was diluted 1:100 in pre-tempered MOPS medium [11] enriched with essential and non-essential tissue culture amino acids (M5550 and M7145, Sigma-Aldrich, S. Louis, MO, USA) and supplemented with 0.2% glycerol, and grown at 18 ˝ C, 200 rpm for 22 h to the early stationary phase of growth. The OD600 was measured (Genesys 10uv, Thermo Fischer Scientific Inc., Waltham, MA, USA). In order to remove nutrients from the culture broth which could bias the survival and establishment of cells once in contact with the phyllosphere,
Agriculture 2016, 6, 6
3 of 22
the culture was washed with sterile pretempered 10 mM MgSO4 (230291, Sigma-Aldrich, S. Louis, MO, USA) at 18 ˝ C (10 min, 5000 ˆ g, 4 ˝ C), and re-suspended in sterile pretempered 10 mM MgSO4 at 18 ˝ C to an OD600 of 0.5 which corresponded with 8.7 ˘ 0.1 log CFU/mL as determined by plate counting on the selective medium sorbitol MacConkey Agar (SMAC, Sigma-Aldrich, Sigma-Aldrich, St. Louis, MO, USA) (24 h, 37 ˝ C). These MgSO4 suspended cells were used as inoculum for the plants. 2.2. Plant Growth Conditions Pelletized butterhead lettuce seeds (Lactuca sativa L. var. capitata “Alexandria”) were obtained from Rijk Zwaan Distribution B.V., De Lier, the Netherlands. The seeds were sown in a mixture of peat, sand, limestone, perlite, celcote, sincrostart and multicote-4. One week after sowing, the seedlings were placed in square pots of 10 cm and grown in the greenhouse at The James Hutton Institute (Dundee, UK). Four-week-old plants were moved from the greenhouse to the growth chamber (Microclima1000, Snijders, Tilburg, The Netherlands) one day before the start of each experiment. Growth chamber conditions were set at continuously ˘18 ˝ C with a relative humidity (RH) of 75% and 16/8 hour light/dark cycle. 2.3. Inoculation of the Lettuce Plants and Measurement of Total Pathogen Populations on Lettuce Leaves Four-week-old lettuce plants (˘9-leaf stage) were spray-inoculated in a biosafety cabinet. A total of 100 mL inoculum (described in Section 2.1) was used to inoculate 16 plants. The pathogen population on the leaves was determined in duplicate one hour after inoculation (1 hpi) and one, two and three days thereafter. For each sample, 1 g of leaves from three lettuce plants was used. The sample was ground aseptically with sterilized sand and 2 mL phosphate buffered saline (PBS), using a pestle and mortar. Serial dilutions were made in PBS and the appropriate dilutions were plated onto SMAC (24 h, 37 ˝ C). Maceration does not recover all of the interacting bacteria, but it is still one of the best methods for direct plate counts [12]. For each experiment two samples were analyzed (n = 2) and the experiment was performed three times. Non-inoculated plants were analyzed as control. 2.4. RNA Extraction for Microarray Experiment A total of 10 g lettuce leaves from three lettuce plants were removed with sterile forceps and placed in a sterile beaker with 200 mL ice-cold RNA-stop wash solution (0.5% phenol pH 4.3, 9.5% ethanol absolute and 90% PBS). The lettuce was cut into pieces of ˘2 cm2 with sterile scissors and stirred on a magnetic stirrer for 5 min at level 3 (Stuart stir UC151, Bibby Scientific Limited, Staffordshire, UK). The RNA extraction was performed on the wash water. Therefore, the 200 mL RNA-wash solution was pipetted into four 50 mL RNAse free polypropylene tubes and centrifuged for 10 min, 4 ˝ C, 5000 rpm. The supernatant was removed and the pellets were dissolved in 1 mL ice-cold RNA-stop (5% phenol pH 4.3, 95% ethanol absolute). These solutions from the four tubes were collected in a 50 mL tube. Subsequently, the emptied tubes were rinsed with another 1 mL of ice-cold RNA-stop and this was added to the 50 mL tube as well and centrifuged as described above (5 mL in total). The supernatants were removed and the pellet was once more washed with 1 mL ice-cold RNA-stop solution. The pellet was immediately stored at ´80 ˝ C. The bacterial pellets were treated with 50 mg/mL of lysozyme (5 min) (L3790, Sigma Aldrich, St. Louis, MO, USA). Subsequently, RNA was extracted with the Qiagen RNeasy kit with an additional on-column DNase digestion performed following the instructions of the manufacturer (Qiagen, Hilden, Germany). As a reference control, a cell pellet of 1 mL of the inoculum was made one hour after resuspending the cells in the MgSO4-buffer, treated with the Qiagen RNeasy protocol as described above and immediately stored at ´80 ˝ C. Total RNA was quantified spectrophotometrically (NanoDrop ND 1000, Thermo Scientific, Wilmington, DE, USA) and the quality examined with a Bioanalyzer 2100 (Agilent technologies, Palo Alto, CA, USA).
Agriculture 2016, 6, 6
4 of 22
2.5. Microarray Labeling Procedure A volume of 17.7 µL of total RNA was combined with Enterobacteriaceae specific 10 ˆ 11-mer oligos, 100 ng/µL as described by [13], on ice, incubated 10 min at 70 ˝ C and cooled on ice again. A volume of 17.3 µL of a master mix (5ˆ first strand buffer, 9.0 µL; 0.1 M DTT, 4.5 µL, 25ˆ aa-dNTP labeling mix 1.8 µL Superscript RT 2.0 µL) was added and the samples were incubated for 2 h at 42 ˝ C. A total of 15 µL of 1 M NaOH and 15 µL 0.5 M EDTA (pH 8.0) was added to hydrolyze the RNA and the samples were incubated for 15 min at 65 ˝ C. Then 15 µL 1 M HCl was added to neutralize the samples. cDNA was purified by adding 450 µL PB buffer (Qiagen) mix and 1applied to a Qiagen MinElute column. The samples were centrifuged. Centrifugation always occurred at 10,000 ˆ g for 1 min unless stated otherwise. The supernatant was removed and 750 µL filter sterilized phosphate wash buffer (0.25 mL 1 M phosphate buffer, 7.7 mL sterile distilled water (SDW), 42.2 mL absolute ethanol) was added and centrifuged. The supernatant was removed and the nucleic acid trapped in the column centrifuged for another 2 min. The column was transferred to a new amber 1.5 mL tube and 10 µL filter sterilized phosphate elution buffer (0.2 mL 1 M phosphate buffer, 49.8 mL SDW) was added to the center of the membrane, left for one minute at room temperature and subsequently centrifuged. This step was repeated with another 10 µL filter sterilized phosphate elution buffer. The subsequent reactions were performed in low light and the incubations were performed in the dark. Sodium carbonate buffer (2.0 µL, 1 M) was added to the purified cDNA and mixed. Subsequently, 1.0 µL of the appropriate Cy-dye (GE Healthcare #PA23001, PA25001) (in DMSO) was added and incubated for 1 h at room temperature in the dark. The labeled cDNA was purified by adding 3.0 µL 4.0 M hydroxylamine hydrochloride, mixed and incubated in the dark for 30 min. The volume of each reaction was made up to 100 µL with SDW. Five hundred µL of PB buffer were added, mixed and applied to a Qiagen MinElute (Qiagen,Valencia, CA, USA) column and centrifuged. The supernatant was removed and 750 µL PE buffer was added and then centrifuged. The supernatant was removed and the tube was once more centrifuged. The column was transferred to a new 1.5 mL tube and 10 µL elution buffer was added to the center of the membrane and left for 1 min at room temperature and then centrifuged. The sample was re-eluted with an additional 10 µL elution buffer into the same tube. The Cy3/Cy5 incorporation was estimated by NanoDrop ND 1000. 2.6. Preparation of Prokaryotic Hybridization Samples for Agilent 8 ˆ 15K Arrays The volume of each labeled cDNA was calculated to give 600 ng and pipetted into a fresh 1.5 mL amber tube. Nuclease-free water (Sigma-Aldrich, St. Louis, MO, USA) was added up to 20 µL. A volume of 5 µL of Agilent 10 ˆ Blocking Agent was added to each tube and the samples were denatured at 98 ˝ C for 3 min and cooled to room temperature. Twenty-five µL of 2 ˆ GEx Hybridization Buffer HI-RPM was added to each tube, mixed well by careful pipetting. The tubes were spun for 1 min at room temperature and immediately placed on ice and loaded onto the Agilent 8 ˆ 15K Arrays (Agilent, Santa Clara, CA, USA). Forty microliter of each mix was added to the gasket slide and the Agilent array slide was placed on top. The slides were incubated for 17 h at 65 ˝ C with rotation at 10 rpm in a hybridization oven. A selection of four samples with the highest quality RNA from three independent experiments were prepared for each time point (1 h and two days after inoculation) and are subsequently called four biological replicates. 2.7. Uninoculated Lettuce Control To check whether the microbial background microbiota on the lettuce may interfere with the micro-array spots, uninoculated samples were checked for the presence of the gadA gene, a housekeeping gene of E. coli. The presence of gadA was checked by conventional PCR. The forward primer was 51 -ACCTGCGTTGCGTAAATA and the reverse 51 -GGGCGGGAGAAGTTGATG and were described in Kim et al. (2006) [14]. Each PCR reaction consisted of 5 µL GoTaq Buffer Green, 3 µL dNTPs (2.5 mM), 0.2 µL 50 µM forward primer, 0.2 µL 50 µM reverse primer, 0.5 µL cDNA, 0.2 µL
Agriculture 2016, 6, 6
5 of 22
polymerase and 15.9 µL SDW. The reaction mixture was processed in a thermocycler (TProfessional basic Thermocycler gradient, Biometra GmbH, Göttingen, Germany) with the following settings: 2 min at 94 ˝ C, 30 cycles: 30 s at 95 ˝ C, 30 s at 56.7 ˝ C, and 1 min at 72 ˝ C, followed by a final extension time at 72 ˝ C for 7 min. Five µL of PCR-product was loaded on a 1% agarose gel and imaged under UV illumination. 2.8. Data Analysis The data were analyzed using the software Genespring version 7.0 (Agilent/Stratagene, Palo Alto, CA, USA). The data from all four biological replicates were further tested by a Principal Component Analysis (PCA) on the different conditions (mean centering and scaling). The outliers were removed by filtering on flags (present or marginal). The data were normalized to the control samples (inoculum) and the replicates combined. Genes showing a greater than two-fold upregulation or downregulation following Volcano Plot analysis (0.01 ď p < 0.05 or p < 0.01) and a raw expression value >50 were considered to be differentially regulated. Comparison of the expression levels was done for the expression after 1 h (day 0) with the inoculum, day 2 with the inoculum and day 2 in comparison with 1 h after inoculation (day 0). A False Discovery Rate (FDR) was not conducted at these significance levels. Subsequently, a single gene list was made as the Agilent array slide contained the genes of four different E. coli strains: the core genome derived from E. coli K-12 strain MG1655, and strain-specific genes of E. coli O157:H7 strains EDL933 and Sakai, and uropathogenic E. coli strain CFT073. Genes of uropathogenic E. coli CFT073 were not taken into consideration. For the single gene list, gene sequences of all significantly differentially regulated E. coli K-12, E. coli O157:H7 EDL933 and E. coli O157:H7 Sakai assigned with a gene name were taken into consideration. Furthermore, all significantly differentially regulated E. coli K-12, O157:H7 EDL933 and O157:H7 Sakai genes with only a “b”, “Z” or “ECs” accession pre-fix, resp. were looked up on XBase [15]. Where duplicates were present in the database, the E. coli Sakai gene was kept if possible, if duplicates were present between E. coli K12 and E. coli O157:H7 EDL933, the E. coli K12 gene was kept. Unknown E. coli O157:H7 EDL933 genes were discarded from the list as well. This single gene list, therefore, includes all genes spotted on the microarray relevant to E. coli Sakai, and was used to link the genes with a COG-annotation [16]. Furthermore, gene lists were made based on the GenProtEC Multifun classes. Since E. coli K-12 is often the only E. coli reference, all E. coli K-12 and Sakai genes with a gene name similar to K-12 were linked to the following classes: class 5 cell processes, class 6.3 pilus, 6.4 flagella and 6.6 ribosomes [17]. For the virulence gene list, E. coli O157:H7 Sakai virulence genes as described in Hayashi et al. were taken into account and a keyword search was performed on the GIRC-site [18,19]. The keywords that were used were: invasion, adhesion, fimbria, effacement, toxin and type III secretion. As an internal validation, a gene list with housekeeping genes was composed based on genes that have been suggested by Rocha et al. (2015) and Zhou et al. (2011) to be used for these purposes [20,21]. For each gene list, the relative expression levels on day 0 and day 2 were plotted against the inoculum and significantly differentially regulated genes were highlighted using Matlab. The nucleotide sequence of the significantly differentially regulated unknown genes with Sakai-specific ECs number was obtained by XBase search. This nucleotide sequence was blasted in the Basic Local Alignment Search Tool (BLAST) in order to find out if the gene was already known or described in related strains. 3. Results and Discussion In this study, the response of E. coli O157:H7 with intact growing young lettuce plants was investigated by the microarray technique to explore the transcriptional changes in E. coli O157:H7. In parallel, the fate of the bacteria was determined with the conventional plate-counting technique. The results will be discussed and compared with the existing literature, in particular with two gene expression studies on lettuce and E. coli [3,4]. Since there are apparent similarities, a comparative overview between these and the current study has been compiled (Table 1).
Agriculture 2016, 6, 6
6 of 22
Table 1. Overview of the main differences between the different gene expression studies with E. coli Agriculture 2016, 6, 6 6 of 21 O157:H7 and fresh produce. Table 1. Overview of the main differences between the different gene expression studies with E. coli Kyle et al., 2010 [3] Fink et al., 2012 [4] This Study O157:H7 and fresh produce. E. coli K12 MG1655 Strain E. coli O157:H7 EDL933 E. This coli O157:H7 Kyle et al., 2010 [3] Fink et al., 2012 [4] Study Sakai E. coli O157:H7 EDL933 E. coli K12 MG1655 a Strain E. coli O157:H7 EDL933 E. coli O157:H7 Sakai c Growth medium M9-glucose MOPS-enriched LB b EDL933 E. coli O157:H7 a c Growth medium M9-glucose LB b MOPS-enriched Growth temperature of 28 ˝ C 37 ˝ C 18 ˝ C E. Growth coli temperature 28 30 °Cmin 37three °C days 18 Time points of 15 min; One and 1 h,°C2 days E. coli Lettuce type romaine lettuce green leaf lettuce butterhead lettuce Time points 15 min; 30 min One and three days 1 h, 2 days surface sterilized leaves Lettuce type romaine lettuce green leaf lettuce butterhead lettuce growing non-sterilized plants Type of interaction leaf lysate supernatant sodiumsterilized hypochlorite surface leaves growing non-sterilized Type of interaction leaf lysate supernatant 7 CFU/cm 2 lettuce sodium hypochlorite Inoculum level 108 CFU/mL 10 108 plants CFU/g lettuce Inoculum level 108 CFU/mL 107 CFU/cm2 lettuce 108 CFU/g lettuce ˝ Growth chamber, 18 C, 75% Plant growth 100% RH, 25 ˝ C photoperiod Growth chamber, 18 °C, Not applicable RH, photoperiod 16 h for Plant growth 100% RH, 25 °C photoperiod conditions 16 h for three days. Not applicable 75% RH, photoperiod two days 16 h conditions 16 h for three days. for two days Cells were were re-suspended re-suspended and Cells kept forfor 1 h1in MgSO4 buffer Reference control and kept h in MgSO4 Reference control for Cells grown in Cells grown in˝ Cells grown in LB at 37 ˝ C after initial growth in for expression Cells grown in LB at 37 °C buffer after initial growth expression analysis M9-glucose at 28 C M9-glucose at 28 °C MOPS-enriched medium, both analysis in MOPS-enriched at 18 ˝ C medium, both at 18 °C a M9= Minimal 9; b LB = Luria Bertani; c MOPS = potassium morpholinopropane sulfonate. a b c M9= Minimal 9; LB = Luria Bertani; MOPS = potassium morpholinopropane sulfonate.
3.1. Survival and Association of E. coli Sakai on/with Growing Butterhead Lettuce 3.1. Survival and Association of E. coli Sakai on/with Growing Butterhead Lettuce
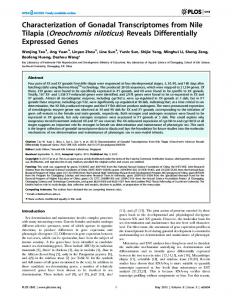
The The survival of E. O157:H7 Sakai lettuceduring during3 3days days shown in survival ofcoli E. coli O157:H7 Sakaionon4-week 4-weekold old butterhead butterhead lettuce is is shown Figure 1. E. coli Sakai was inoculated at a level of 7.45 ˘ 0.37 log CFU/g lettuce. A high inoculum in Figure 1. E. coli Sakai was inoculated at a level of 7.45 ± 0.37 log CFU/g lettuce. A high inoculum level was used ensure recovered for subsequent whole transcriptome analysis, not level to was used sufficient to ensure bacteria sufficientwere bacteria were recovered for subsequent whole transcriptome analysis, not to mimic ecologically levels.ofThe number of bacteria recovered days˘was to mimic ecologically relevant levels. relevant The number bacteria recovered after 2 daysafter was25.02 0.27 log 5.02and ± 0.27 lognot CFU/g, and did not significantly at day 3,stabilization suggesting stabilization at this level. CFU/g, did significantly change at day change 3, suggesting at this level.
Figure 1. Survival of coli E. coli O157:H7Sakai Sakai on on butterhead butterhead lettuce. For each experiment 2 samples were were Figure 1. Survival of E. O157:H7 lettuce. For each experiment 2 samples analyzed (n = 2) and the experiment was performed three times. analyzed (n = 2) and the experiment was performed three times.
3.2. Differentially Regulated TranscriptomeofofE. E.coli coli O157:H7 O157:H7 Sakai Butterhead Lettuce 3.2. Differentially Regulated Transcriptome SakaiononGrowing Growing Butterhead Lettuce A total of 273 genes (5.04%) of the Sakai genome were induced or repressed by at least two-fold A total of 273 genes (5.04%) of the Sakai genome were induced or repressed by at least two-fold (p < 0.01, raw value >50 for all treatments) at either 1 hpi or 2 dpi in comparison with the inoculum (p < 0.01, value >50 for all treatments) at either 1 hpi or 2 dpi in comparison with the inoculum (cellsraw suspended in MgSO 4 buffer). There was a difference between the functions of the genes that (cellswere suspended in MgSO wasthe a difference the genes 4 buffer). differently regulated after There being on lettuce for between one hourthe andfunctions after twoofdays (Figurethat 2). were differently regulated after being on the lettuce for one hour and after two days (Figure 2). One One hour after inoculation, 164 of the selected genes were significantly differentially regulated, with hour after the inoculation, the selected significantly regulated, the majority majority of164 theofgenes induced genes (71%). were The induced genes differentially that could be assigned to awith category of
of the genes induced (71%). The induced genes that could be assigned to a category of orthologous
Agriculture 2016, 6, 6
7 of 22
genesAgriculture (COG),2016, belonging mainly to the transport and metabolism of amino acids and inorganic 6, 6 7 of 21 ions on the one hand, and to transcription, translation, ribosomal structure and biogenesis on the other genes (COG), belonging mainly to the transport and metabolism of amino of acids hand.orthologous At day 2, 147 genes were significantly differentially regulated with the majority the and selected inorganic ions on the one hand, and to transcription, translation, ribosomal structure and biogenesis genes (65%) repressed. E. coli O157:H7 genes that were downregulated included those involved in on the other hand. At day 2, 147 genes were significantly differentially regulated with the majority of carbohydrate transport and metabolism, cell wall/membrane, envelope biogenesis, and transcription. the selected genes (65%) repressed. E. coli O157:H7 genes that were downregulated included those Only involved 37 of thein 273 genes of the selected genes were significantly upregulated or downregulated at both carbohydrate transport and metabolism, cell wall/membrane, envelope biogenesis, and time points and for only3723ofgenes wasgenes the expression significantly different between 1 hpi andor2 dpi. transcription. Only the 273 of the selected genes were significantly upregulated For almost 40% (39.9%) of time the selected genes, a COG classwas could not be assigned or thedifferent genes were downregulated at both points and for only 23 genes the expression significantly assigned as poorly function Furthermore, 23.8% of the selected between 1 hpi characterized and 2 dpi. For or almost 40% unknown. (39.9%) of the selected genes, a COG class could genes not be were orSakai-specific the genes weregenes assigned as poorly characterized function unknown. Furthermore, 23.8% or E. coliassigned O157:H7 (ECs) for which only theor ECs number referred to a hypothetical of the selected genes were E. coli O157:H7 Sakai-specific genes (ECs) for which only the ECs number uncharacterized open reading frame. referred to a hypothetical orexpression uncharacterized reading frame. As an internal control, the of 31 open housekeeping genes, whose expression is expected to be As an internal control, the expression of 31 housekeeping genes, whose expression is expected consistent under a wide variety of conditions, was assessed. Only three of 35 were significantly affected to be consistent under a wide variety of conditions, was assessed. Only three of 35 were significantly in expression (rho, cca and ftsZ), and the majority were unchanged (see supplemental information). affected in expression (rho, cca and ftsZ), and the majority were unchanged (see supplemental Furthermore, the gadA gene was not detected on uninoculated lettuce and generic E. coli was not information). Furthermore, the gadA gene was not detected on uninoculated lettuce and generic E. detected on the coli was not SMAC-plates. detected on the SMAC-plates.
(a)
(b) Figure 2. Overview of the significantly differentially regulated genes (p < 0.01, at least two-fold,
Figure 2. Overview of the significantly differentially regulated genes (p < 0.01, at least two-fold, raw raw value > 50) at 1 hpi (day 0) or 2 dpi (day 2), (a) classified by COG group and (b) COG value > 50) at 1 hpi (day 0) or 2 dpi (day 2), (a) classified by COG group and (b) COG functional category. functional category.
Agriculture 2016, 2016, 6, 6, 66 Agriculture
88 of of 22 21
3.3. Transcription, Translation 3.3. Transcription, Translation One hour after inoculation, genes associated with transcription and translational processes were One hour after inoculation, genes associated with transcription and translational processes were induced (Figures 3 and 4), for example the 30S (e.g., rpsU at p < 0.01 and rpsJT at p < 0.05), 50S induced (Figures 3 and 4), for example the 30S (e.g., rpsU at p < 0.01 and rpsJT at p < 0.05), 50S ribosomal ribosomal subunit proteins (rplCM at p < 0.05), and cell division-related genes such as dacA, groS subunit proteins (rplCM at p < 0.05), and cell division-related genes such as dacA, groS (p < 0.01) and (p < 0.01) and mnmG (p < 0.05). Furthermore, genes related to transcription and translation such as fis, mnmG (p < 0.05). Furthermore, genes related to transcription and translation such as fis, transcripts transcripts coding for, among others, RNA-helicases (rhlE), translation initiation factor IF-1 (infA), coding for, among others, RNA-helicases (rhlE), translation initiation factor IF-1 (infA), transcription transcription termination (rho), and genes responsible for rRNA modification such as methylation of termination (rho), and genes responsible for rRNA modification such as methylation of nucleotides nucleotides (mnmA, rumB, ECs4154) were significantly upregulated. In contrast, ftsN, an essential cell (mnmA, rumB, ECs4154) were significantly upregulated. In contrast, ftsN, an essential cell division division protein, was significantly downregulated. protein, was significantly downregulated. The transcriptional profiles at 2 dpi were quite different. All the ribosomal subunit proteins were The transcriptional profiles at 2 dpi were quite different. All the ribosomal subunit proteins were significantly repressed compared to their expression level 1 hpi (rpsUJT, rplCM at p < 0.05), as were significantly repressed compared to their expression level 1 hpi (rpsUJT, rplCM at p < 0.05), as were other ribosomal subunit proteins (rpsFP at p < 0.01, rpsDIKT, rplKUXY at p < 0.05), and ftsN. This 2 dpi other ribosomal subunit proteins (rpsFP at p < 0.01, rpsDIKT, rplKUXY at p < 0.05), and ftsN. This 2 dpi data agrees with the cell die-off after one day (see Figure 1) and with the data of Fink et al. (2012) [4], data agrees with the cell die-off after one day (see Figure 1) and with the data of Fink et al. (2012) [4], who observed a decrease in the expression of the E. coli O157:H7 ribosomal-related genes 1 and 3 dpi who observed a decrease in the expression of the E. coli O157:H7 ribosomal-related genes 1 and 3 dpi onto detached lettuce leaves. onto detached lettuce leaves.
Figure Figure 3. 3.Relative Relativeexpression expressionof ofE. E.coli coliO157:H7 O157:H7Sakai Sakairibosomal-related ribosomal-related genes genes one one hour hour and and two two days days after inoculation on lettuce plants. A colored line between the control and hour 1 shows that a after inoculation on lettuce plants. A colored line between the control and hour 1 shows that a particular particular gene was significantly expressed one inoculation hour after inoculation on in the lettuce in gene was significantly differentlydifferently expressed one hour after on the lettuce comparison comparison with the inoculum. A colored line between hour 1 and day 2 shows that the gene with the inoculum. A colored line between hour 1 and day 2 shows that the gene expression of a expression of a particular gene was significantly different between these two time points. particular gene was significantly different between these two time points. Colored dots at dayColored 2 show dots at daywhich 2 showwere the genes which were significantly differently on day with 2 in comparison the genes significantly differently expressed on dayexpressed 2 in comparison the control. with control. Light green:atdownregulation 0.01green: ≤ p < downregulation 0.05, dark green:atdownregulation at Lightthe green: downregulation 0.01 ď p < 0.05,atdark p < 0.01, light red: pupregulation < 0.01, light red: upregulation 0.01 red: ≤ p < upregulation 0.05, dark red:atupregulation at pno < 0.01. Grey: no significant at 0.01 ď p < 0.05,atdark p < 0.01. Grey: significant difference in difference in expression. Data represent the mean of four biological replicates. expression. Data represent the mean of four biological replicates.
Agriculture 2016, 6, 6 Agriculture 2016, 6, 6
9 of 22 9 of 21
Figure Figure 4. 4. Relative Relative expression expressionof of E. E. coli coli O157:H7 O157:H7 Sakai Sakai genes genes related related with with cell cell division division one one hour hour and and two plants. A colored lineline between the the control and and hourhour 1 shows that twodays daysafter afterinoculation inoculationononlettuce lettuce plants. A colored between control 1 shows athat particular genegene was was significantly differently expressed one one hourhour afterafter inoculation on the lettuce in a particular significantly differently expressed inoculation on the lettuce comparison with the inoculum. A colored line between hour 1 and day 2 shows that the gene in comparison with the inoculum. A colored line between hour 1 and day 2 shows that the gene expression particulargene genewas wassignificantly significantly different between these points. Colored expression of aa particular different between these twotwo timetime points. Colored dots dots at 2day 2 show the genes were significantly differently expressed 2 in comparison at day show the genes whichwhich were significantly differently expressed on day 2oninday comparison with the with theLight control. Light green: downregulation 0.01 dark ≤ p