138
Microbial community structure and function in the spermosphere as affected by soil and seed type Jeffrey S. Buyer, Daniel P. Roberts, and Estelle Russek-Cohen
Abstract: Colonization of the spermosphere and rhizosphere by plant-beneficial bacteria is limited by competition with indigenous soil microbes for resources such as reduced carbon compounds. A study of the soil microbial community around germinating seeds was undertaken as a necessary first step in understanding the competition between the introduced plant-beneficial bacteria and the indigenous microbial community. Two soil types, Galestown gravely loamy sand soil, with pH 5.8 and 0.6% humic material, and Hatborough loamy sand soil, with pH 4.5 and 3.2% humic material, were compared. Five seed types, corn, cucumber, radish, soybean, and sunflower were used. Microbial communities were characterized functionally, using a substrate utilization assay, and structurally, using fatty acid methyl ester analysis, over a 96-h period after the onset of germination. Soil type affected the microbial communities far more than seed type. The communities in Hatborough soil had greater functional and structural changes compared with the control than Galestown soil. The communities changed more functionally than structurally, with increased substrate utilization compared with the soil controls. Key words: spermosphere, microbial community, Biolog, substrate utilization, fatty acid. Resumé : La colonisation de la spermosphère et de la rhizosphère par les bactéries profitables aux plantes est limitée par la compétition avec les microorganismes indigènes du sol pour des ressources comme les composés carbonés réduits. Une étude de la population microbienne du sol autour des graines en germination a été entreprise comme première étape nécessaire pour comprendre cette compétition entre les bactéries profitables introduites et la population microbienne indigène. Nous avons comparé deux types de sol, soit le sable loameux graveleux de Galestown à pH 5,8 contenant 0,6% de matières humiques et le sable loameux d’Hatborough à pH 4,5 contenant 3,2% de matières humiques. Nous avons comparé cinq sortes de graines, soit maïs, concombre, radis, soja et tournesol. Les populations microbiennes ont été caractérisées sur le plan fonctionnel par un test d’utilisation de substrats et sur le plan structural par analyse des méthyl esters d’acides gras, pendant une période de 96 h suivant le début de la germination. Le type de sol a affecté les populations microbiennes beaucoup plus que la sorte de semence. Comparativement aux témoins, les populations du sol Hatborough ont montré des plus gros changements fonctionnels et structuraux que les populations du sol Galestown. Les populations changeaient plus sur le plan fonctionnel que structural et révélaient une plus forte utilisation de substrats comparativement aux sols témoins. Mots clés : spermosphère, population microbienne, Biolog, utilisation de substrats, acide gras. [Traduit par la Rédaction]
Buyer et al.
144
Introduction It is important for certain plant-beneficial bacteria, including biocontrol agents and plant growth-promoting rhizobacteria, to colonize the spermosphere and rhizosphere for Received June 29, 1998. Revision received November 6, 1998. Accepted November 23, 1998. J.S. Buyer.1 Soil Microbial Systems Laboratory, United States Department of Agriculture, Agricultural Research Service, Building 001 BARC-West, Beltsville, MD 20705-2350, U.S.A. D.P. Roberts. Biocontrol of Plant Diseases Laboratory, USDA-ARS, Beltsville, MD 20705, U.S.A. E. Russek-Cohen. Department of Animal and Avian Science, University of Maryland at College Park, College Park, MD 20742-2311, U.S.A. 1
Author to whom all correspondence should be addressed (e-mail:
[email protected]).
Can. J. Microbiol. 45: 138–144 (1999)
many agricultural applications. Plant-beneficial bacteria typically colonize at least a small portion of the rhizosphere when applied as treatments of seeds or seed pieces (Bahme and Schroth 1987; Leben et al. 1987; Xu and Gross 1986) and can become widely distributed in the rhizosphere (Weller 1984, 1987). However, these bacteria are typically lognormally distributed along the root system (Loper et al. 1984), and populations of these biocontrol bacteria can decrease with increasing distance from the point of introduction into the soil (Chao et al. 1986). This colonization process requires the uptake and conversion of reduced carbon compounds and other nutrients into energy and cellular components required for growth. Competition with indigenous soil microbes for resources such as reduced carbon compounds is thought to be a major factor limiting colonization by biocontrol bacteria (Chao et al. 1986; Cook 1992; Weller and Cook 1983). Nutrients released into the spermosphere and rhizosphere are derived from plant exudates, plant secretions, lysis of © 1999 NRC Canada
Buyer et al.
epidermal plant cells, and plant mucilages (Bowen and Rovira 1976, 1991). These nutrients can vary with plant species (Richardson et al. 1982; Vancura 1964; Vancura and Hanzlikova 1972), plant age (Martin 1978; Martinez et al. 1994), and plant nutrition (Turner and Newman 1984; Turner et al. 1985). Seed and root exudates have been extensively studied. These exudates include carbohydrates, amino acids, and other organic acids (Curl and Truelove 1986). As with other forms of rhizodeposition, there are qualitative and quantitative differences in carbohydrates, amino acids, and other organic acids released into the soil as seed and root exudates from various plant species. We used Enterobacter cloacae as a model organism to study the role of various reduced carbon nutrients in colonization of seeds of crop plants. Enterobacter cloacae has practical importance as a potential biocontrol agent of Pythium spp. (Hadar et al. 1983; Nelson 1988). Using a mutational approach, we have demonstrated that E. cloacae displays considerable metabolic flexibility during growth in the spermosphere, since specific carbohydrates, amino acids, and peptides found in exudates are not absolutely required. However, the importance of carbohydrates and amino acid utilization varies with seed type (Roberts et al. 1992, 1996a, 1997). Mutants affected in utilization of carbohydrates and amino acids found in seed exudates were reduced in colonization of some, but not all, seed types relative to the parental strain (Roberts et al. 1992, 1996b, 1997). There was no correlation between the quantity of total carbohydrate and total amino acid released by each seed type and the reduction in colonization by this collection of mutants. However, the spermospheres of these seeds may develop communities with different competitive abilities for available reduced carbon compounds leading to the behavior of these mutants relative to the parental strain. The purpose of the studies presented here was to determine if structurally different communities, with potentially different competitive abilities for exudates, develop in the spermospheres of different seed types. A functional assay based on carbon source utilization has been shown to be effective in differentiating between communities from different ecosystems and agricultural management regimes (Bassio and Scow 1995; Buyer and Drinkwater 1997; Garland and Mills 1991). Fatty acid analysis has been shown to be an effective method for structural analysis of soil microbial communities (Buyer and Drinkwater 1997; Haack et al. 1994; Zelles et al. 1995). We used these assays to measure and compare the functional and structural changes the microbial community in the spermosphere undergoes during the germination of different seeds.
Materials and methods Analysis of spermosphere microbial communities Two soils were used. The Galestown gravely loamy sand soil had a pH of 5.8, cation exchange capacity of 4.0, and 0.6% humic material. The Hatborough loamy sand soil had a pH of 4.5, cation exchange capacity of 4.5, and 3.2% humic material. Soils were collected from the top 6–10 in. (1 in. = 25.4 mm), sieved through a 0.5-cm sieve, and air-dried for 48 h. Soil was equilibrated to –75 kPa water potential for several days before use. Corn (Zea mays), cucumber (Cucumis sativum cv. Marketmore 76), rad-
139 Table 1. Fatty acid biomarkers. Group
Fatty acidsa
Biomass Gram+ bacteria Gram– bacteria Eubacteria
14:0, 16:0, 18:0 Iso- and anteiso-branched fatty acids β-OH fatty acids 15:0, 17:0 cyclo, 19:0 cyclo, 15:1 iso, 17:1 iso and anteiso 18:2 ω6c 20:3, 20:4 Polyunsaturated fatty acids
Fungi Protozoa Eukaryotes
a See Cavigelli et al. (1995), Frostegård et al. (1993), Zelles et al. (1994), and Zelles et al. (1995).
ish (Raphinus sativus cv. Cherry bomb), soybean (Glycine max cv. Chesapeake), and sunflower (Helianthus giganteus) seeds (not surface sterilized) were sown in 2 g of soil in sterile test tubes. Controls consisted of soil without seeds. Tubes were incubated on a laboratory bench at approximately 22°C with approximately 12 h light : 12 h darkness. Six replicate soil samples were harvested 0 and 96 h after sowing by adding 1 mL sterile deionized water, sonicating (Branson Ultrasonics Corp., Danbury, Conn.) for 5 min, vortexing, and removing the seeds. Each experiment was performed twice. The substrate utilization assay was conducted by serially diluting a portion of each sonicated sample to achieve a final dilution of 10–4 in sterile saline (4.5 g NaCl per litre). Biolog GN plates (Biolog, Inc., Hayward, Calif.) were inoculated with 150 µL of the 10–4 diluted sample and incubated at 22°C for 3 days. Plates were read with a Thermomax plate reader (Molecular Devices Corporation, Sunnyvale, Calif.) at 595 nm. The remainder of the initial sonicated sample was frozen for fatty acid analysis. Fatty acid analysis was performed on all samples using a slight modification of a previously published procedure (Cavigelli et al. 1995), which was based on a protocol for isolated microorganisms (Sasser 1990). Each frozen sample was lyophilized, and 1 g of lyophilized soil was weighed into a 25-mL glass centrifuge tube equipped with a Teflon-lined screw cap. Briefly, the sample was saponified with alkaline methanol, methylated with acidic methanol, extracted, and centrifuged at 500–1000 × g for 5 min. The organic (top) layer was transferred to another tube, and the extraction and centrifugation processes were repeated. The organic layers from both extractions were combined and washed with dilute aqueous NaOH. The organic (top) layer was evaporated to dryness under nitrogen, redissolved in 0.5 mL of extraction reagent, and analyzed by gas chromatography. A Hewlett-Packard (Wilmington, Del.) 5890 gas chromatograph with flame ionization detector was used. Fatty acids were identified by retention time according to the MIDI eukaryotic method (Microbial ID, Inc., Newark, Del.).
Data analysis The substrate utilization assay data were analyzed after dividing the substrates into six categories: polymers, carboxylic acids, carbohydrates, amino acids, amines and amides, and miscellaneous (Zak et al. 1994). The average absorbance for all wells within each category was calculated. The absorbance of the blank well was not subtracted but was used as a covariate in the statistical analysis (see below). Fatty acids were divided into nine chemical categories: straightchain saturated, branched-chain saturated, monounsaturated, polyunsaturated, α-hydroxy fatty acids, β-hydroxy fatty acids, hydrocarbons, alcohols, and oxyfunctional fatty acids (including dicarboxylic acids, dimethylacetals, and aldehydes). Peaks that could not be identified, or peaks that consisted of two fatty acids from two different categories, were categorized as unknowns and © 1999 NRC Canada
140
Can. J. Microbiol. Vol. 45, 1999
Table 2. Substrate utilization assay results by treatment for each substrate group. Substrate groupb Totala
Treatment Galestown 0-h Control 96-h Control Corn Cucumber Radish Soybean Sunflower Hatborough 0-h Control 96-h Control Corn Cucumber Radish Soybean Sunflower
Polymer
Carbohydrate
Carboxylic acid
Amine/amide
Amino acid
Misc.
33.98f 39.80f 87.02cd 77.99de 61.83e 73.46de 99.99bc
0.28d 0.33d 1.00b 0.83bc 0.64c 0.70c 1.10b
0.26h 0.35gh 0.74de 0.70de 0.48fg 0.65ef 0.94cd
0.47e 0.49e 0.89cd 0.82cd 0.70d 0.84cd 1.00c
0.26h 0.35gh 0.74de 0.70de 0.48fg 0.65ef 0.94cd
0.38f 0.51ef 0.98cd 0.92cd 0.70de 0.90cd 1.19bc
0.31e 0.39e 0.81bcd 0.76cd 0.62d 0.70d 0.91bc
84.68cd 110.34b 148.77a 137.14a 142.33a 150.01a 156.85a
0.84bc 1.09b 1.79a 1.63a 1.66a 1.79a 1.84a
0.74de 0.91cd 1.31ab 1.08bc 1.24ab 1.28ab 1.43a
0.95c 1.23b 1.33ab 1.25b 1.33ab 1.38ab 1.47a
0.74de 0.91cd 1.31ab 1.08bc 1.24ab 1.28ab 1.43a
1.13bc 1.38b 1.78a 1.68a 1.71a 1.80a 1.84a
0.62d 0.99b 1.30a 1.21a 1.24a 1.29a 1.40a
Note: Different letters indicate statistically significant differences within each column. a Total absorbance summed across the entire plate excluding the blank well. b Summed absorbance for each category of substrates.
not analyzed further. The area of each fatty acid peak was exported to a text file using CAMBIO (Data Junction Corporation, Austin, Tex.). The data were summed within each category and then divided by the total peak area to determine the proportion of fatty acids within each category. Biomarker fatty acids were also employed (Table 1). The fatty acids within a group were summed and divided by total saturated fatty acids where multiple biomarkers for a specific taxonomic group occurred. All statistical analyses were performed with SAS software (SAS Institute, Cary, N.C.). Analysis of variance (ANOVA) and multivariate analysis of variance (MANOVA) were conducted using the general linear model. Means were compared using the Student Newman–Keuls multiple-range test. A one-way model was employed in which the main effect consisted of each combination of soil and seed type. For the substrate utilization assay, the blank was used as a covariate to account for differences in the background absorbance. A canonical variates analysis, generated by the MANOVA, was used to identify the linear combination of variables that best separated the soil–seed combinations (see Appendix). This analysis was used to generate plots that summarize group differences (Seber 1984). The plots generated are comparable with those generated via canonical discriminant analysis, except that we chose to display the mean of each treatment and its corresponding confidence interval rather than the raw data. The 90% confidence intervals were calculated as shown in eq. 1,
[1]
r=
χ 22 (010 . )/n
where r is the radius of the resulting circle and n is the number of replicate samples (Seber 1984). Exudate analysis Seeds were surface sterilized with sodium hypochlorite (10% commercial bleach) for 20 min, followed by two 20-min rinses in sterile deionized water. Surface-sterilized seeds (2.5 g) were added to 10 mL sterile distilled water and incubated in the dark. After 96 h the water was decanted and checked for microbial contamination by spotting 10 µL onto nutrient agar. All noncontaminated samples for each seed type were pooled, frozen, and lyophilized to dryness. The samples were analyzed for carbohydrates with the
anthrone assay (Morris 1948) and amino acids using the ninhydrin assay (Spies 1957).
Results Substrate utilization assay The substrate utilization data is summarized in Table 2. Substrate utilization was higher in the Hatborough soil than in the Galestown soil, except for the Hatborough time 0 control, which had less activity than some of the Galestown soil spermosphere samples. This was true whether or not the absorbance of the blank well was subtracted prior to analysis. The Hatborough soil controls at 0 and 96 h had greater total absorbance, as well as greater absorbance for each substrate category, than the Galestown soil controls, indicating a higher level of substrate utilization by the soil community. A comparison by seed type showed the same pattern, with activity being greater in the Hatborough soil for total absorbance and for each substrate group. The Hatborough soil controls increased in substrate utilization activity from 0 to 96 h for total absorbance, carboxylic acids, and miscellaneous substrates, indicating some change in the population or community of the control soil during incubation. This did not occur in the Galestown soil. Substrate utilization activity was greatest in the sunflower spermosphere in both soils in every category. Corn and soybean spermospheres showed the next greatest amount of activity, with radish and cucumber spermospheres showing the least amount of activity. There was a soil–seed interaction, as seen in the change in rank for corn and soybean and for radish and cucumber when the two soils were compared (Table 2), but this was generally not statistically significant. In the control samples, the greatest activity was observed for carboxylic acids and amino acids. In the Hatborough soil, polymer utilization became much greater in the samples with seeds, surpassing carboxylic acid utilization. The pattern was more complex in the Galestown soil, with polymer © 1999 NRC Canada
Buyer et al.
141 Table 3. Fatty acid biomarker results by treatment for each taxonomic group. Taxonomic groupinga Treatment Galestown 0-h control 96-h control Corn Cucumber Radish Soybean Sunflower Hatborough 0-h control 96-h control Corn Cucumber Radish Soybean Sunflower
Gram+
Bacteria
Eukaryotes
Fungi
Protozoa
0.44cd 0.44cd 0.43cd 0.46bcd 0.46bcd 0.52bcd 0.41d
0.16a 0.12ab 0.10abc 0.13ab 0.12ab 0.12ab 0.13ab
0.27c 0.21c 0.31c 0.27c 0.31c 0.28c 0.31c
0.19c 0.13c 0.23bc 0.18c 0.24bc 0.19c 0.24bc
0.019a 0.015ab 0.014ab 0.011ab 0.009ab 0.007ab 0.012ab
0.57bcd 0.75a 0.62b 0.48bcd 0.50bcd 0.53bcd 0.60bc
0.00d 0.06bcd 0.05bcd 0.03cd 0.05bcd 0.07abcd 0.07abcd
0.66a 0.38bc 0.34c 0.30c 0.41bc 0.55ab 0.43bc
0.53a 0.24bc 0.22bc 0.20c 0.31bc 0.43ab 0.32bc
0.000b 0.000b 0.003b 0.000b 0.000b 0.000b 0.002b
Note: Different letters within a column indicate significant differences at P < 0.05. a Specific fatty acids, summed as biomarkers to taxonomic groups, were normalized by dividing them by the sum of the saturated fatty acids present in each sample.
utilization greater than carboxylic acid utilization for corn, cucumber, and sunflower, but not for radish and soybean (Table 2). Fatty acid analysis A total of 205 fatty acids and related compounds, including unknowns, were found. The unknowns were eliminated, leaving 173 compounds. The fatty acids ranged from 8 to 30 carbons in length and included a wide variety of functional groups. In order to make sure that any changes in fatty acid composition were not due to fatty acids in the seed exudates, a set of axenic controls, consisting of surface-sterilized seeds in autoclaved soil, were run. Fatty acids were much lower in these samples than in the experimental samples, indicating that seed exudates contained minimal amounts of fatty acids (data not shown). The chromatographic peak area of the saturated fatty acids 14:0, 16:0, and 18:0 were summed to yield a biomarker for biomass (Cavigelli et al. 1995). This measure of biomass was much higher for the Hatborough controls and spermosphere samples than for the corresponding Galestown samples at both 0 and 96 h, indicating greater microbial biomass in the Hatborough soil and spermosphere samples (data not shown). Other biomarkers were calculated as proportions of the total saturated fatty acids. We found this to give less variance than proportions of total fatty acids or proportion of the biomass fatty acids. Results are presented in Table 3 for the biomarkers that showed statistically significant treatment effects. Gram-positive bacteria were generally higher in the Hatborough soil when compared with the Galestown soil, although this was significant only for the 96-h control, and corn and sunflower treatments. In Hatborough soil, the proportion of Gram-positive bacteria increased significantly from 0 to 96 h in the control sample but did not increase in the spermosphere samples relative to the 0-h control. Eu-
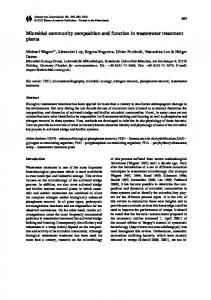
bacterial fatty acids were lower in Hatborough than Galestown soil, and were not even detectable in the Hatborough 0-h control. The proportion of eukaryotes was higher in Hatborough samples than Galestown samples, and in Hatborough soil dropped from 0 to 96 h. A similar pattern was observed for fungi, perhaps because fungi are the dominant eukaryotes. Protozoa, however, were higher in Galestown soil than Hatborough soil. However, these differences were generally not statistically significant. There was no impact by any seed type on any taxonomic group in the Galestown soil, as determined by fatty acid biomarker analysis (Table 3). In the Hatborough soil, the Gram-positive taxonomic group was significantly different from the 96-h control for each seed type. All other taxonomic groups were similar to the 96-h control with each seed type (Table 3). Multivariate statistics A canonical analysis, generated by SAS GLM, was used to identify the linear combination of variables that best separated soil and seed combinations. The first two canonical variates accounted for 89% of the variability for the fatty acid analysis and 85% of the variability for the substrate utilization assay, and therefore could be used to effectively graph the data, allowing us to visualize how the soil–seed combinations compared. The mean canonical variates and corresponding 90% confidence intervals for each seed and soil combination are plotted in Fig. 1. The strong contribution of soil type relative to seed type is evident from both the substrate utilization and fatty acid data. The substrate utilization assay (Fig. 1a) shows a shift from 0 to 96 h in the Hatborough control samples, and also shows the seed samples to be quite different from the controls. The Galestown soil showed much less response to time and seed germination. With fatty acids, the Galestown soil community did not appear to be sensitive to seed type, whereas the Hatborough © 1999 NRC Canada
142 Fig. 1. Canonical variates for soil and seed effects. Means for each soil × seed type are plotted. Ellipses represent 90% confidence intervals. (a) Substrate utilization assay. (b) Fatty acid analysis. Controls: r, Galestown 0 h; +, Galestown 96 h; q, Hatborough 0 h; ×, Hatborough 96 h. Treatments: 䊏, corn; 䊉, cucumber; 䉱, radish; 䉲, soybean; 䉬, sunflower; solid symbols Galestown, open symbols Hatborough.
Can. J. Microbiol. Vol. 45, 1999 Table 4. Seed exudates released over 96 h. Seed
Carbohydratea
Amino acidb
Corn Cucumber Radish Soybean Sunflower
5076.8 3.3 8.6 1147.8 117.2
892.4 1.0 4.2 220.1 56.6
a Carbohydrates are quantified as micrograms of glucose equivalents per seed. b Amino acids are quantified as micrograms of leucine equivalents per seed.
soil community appeared to be. This can be seen by the close proximity of the plotted means for Galestown soil in Fig. 1b, but no such proximity for the Hatborough means. Seed exudates Analyses of the seed exudates are summarized in Table 4. Corn had the highest levels of both carbohydrate and amino acid exudation, followed by soybean and then sunflower. Cucumber and radish released far less carbohydrates and amino acids than the other seeds.
Discussion The spermosphere microbial community was affected far more by soil type than by seed type. The Hatborough soil,
with higher organic matter, had a greater microbial biomass as measured by fatty acid analysis, which may explain the higher levels of substrate utilization associated with the Hatborough soil. The microbial community in the Hatborough soil was more responsive to seeds, with much larger shifts in substrate utilization compared with the Hatborough soil controls than in the Galestown soil. With the Galestown soil, the soil community was not sensitive to seed type (Fig. 1) and there was no difference in taxonomic biomarkers between the controls and the spermosphere of any seed tested (Table 3). The microbial community changed more in function (substrate utilization) than in structure as the seeds germinated for all seed types. One explanation is that the fast-growing aerobic heterotrophs were the only part of the microbial community to grow significantly during the 96-h experiment. Since these organisms represent a small portion of the total microbial biomass, there should be little change in the fatty acid profile of the microbial community. However, these organisms are anticipated to dominate the substrate utilization assay, so community function should change, as observed. It follows that the substrate utilization assay should be more sensitive to shifts in the community structure than FAME analysis, as suggested by Bååth et al. (1998) for rhizosphere communities. A second explanation is that the functional changes observed with the substrate utilization assay were due to induced physiological or metabolic changes in the microbial community in response to exudates released from seeds. It is not clear why the different spermospheres have similar microbial communities at 96 h. Seed exudates are expected to provide nutrients for microbial growth in the spermosphere. Corn and soybean seeds released substantially more carbohydrate and amino acid than cucumber and radish seeds, yet there was very little difference in the microbial communities. Furthermore, sunflower spermosphere communities consistently had the highest (although not generally statistically significant) substrate utilization, yet sunflower seeds released substantially less carbohydrate and amino acid than corn and soybean seeds. It may be that 96 h is insufficient for major differences in microbial community structure and function to develop. The results from this paper are useful in interpreting data from previous studies on colonization of seeds by E. cloacae. One mutant of E. cloacae, strain A-11, contains a mutation in a region of the genome important to glycolysis and is reduced or deficient in growth on most carbohydrates found in seed exudates that support growth of the parental strain © 1999 NRC Canada
Buyer et al.
(Roberts et al. 1997). In studies carried out in the Galestown soil, strain A-11 was substantially reduced in growth on cucumber seed but not significantly (P < 0.05) reduced in growth on pea seed relative to the parental strain (Roberts et al. 1992). Strain A-11 was also significantly reduced in growth on radish seed but had similar growth to the parental strain on corn and sunflower seed in other colonization experiments conducted in the Galestown soil (D.P. Roberts and P.D. Dery, unpublished data). Cucumber and radish seed exude significantly less carbohydrate and amino acid than pea, corn, and sunflower seed (Roberts et al. 1992, 1996a, 1997; D.P. Roberts, unpublished data). Since the spermosphere microbial community in the Galestown soil did not vary significantly with seed type over the time period of the colonization assays (this paper), the colonization behavior of strain A-11 relative to the parental strain in the spermospheres of these different seeds directly correlates with the quantity of carbohydrates and amino acids released. However, the colonization behavior of other mutants of E. cloacae affected in amino acid utilization relative to the parental strain did not correlate with the quantity of carbohydrate and amino acid released by the different seeds (Roberts et al. 1996b). It is possible that there are substantial qualitative differences in the exudates of these seeds with regard to nitrogen sources. The first few days of seed germination are a critical time period for certain plant pathogens. Many Fusarium species germinate within a few hours of planting in response to spermosphere exudate (Nelson 1991). Pythium ultimum will colonize and rot seeds within 6–12 h of planting in pathogen-infested soil (Nelson 1991). It is assumed that many biocontrol agents must colonize the spermosphere and rhizosphere to protect the plant. If the pathogen is germinating and colonizing the seed within a few hours of planting the biocontrol agent must be metabolically active during that time period. The biocontrol agent will be competing with the native microflora for seed exudates, and we have shown that over the first 96 h the native microbial community changes in function, and somewhat less in structure, in a soildependent manner. The adaptability of the biocontrol agent to soil characteristics, and secondarily to seed type, may be critical to colonization and suppression of plant pathogens.
References Bååth, E., Díaz-Raviña, M., Frostegård, A., and Campbell, C.D. 1998. Effect of metal-rich sludge amendments on the soil microbial community. Appl. Environ. Microbiol. 64: 238–245. Bahme, J.B., and Schroth, M.N. 1987. Spatial–temporal colonization patterns of a rhizobacterium on underground organs of potato. Phytopathology, 77: 1093–1100. Bassio, D.A., and Scow, K.M. 1995. Impact of carbon and flooding on the metabolic diversity of microbial communities in soils. Appl. Environ. Microbiol. 61: 4043–4050. Bowen, G.D., and Rovira, A.D. 1976. Microbial colonization of plant roots. Annu. Rev. Phytopathol. 14: 121–144. Bowen, G.D., and Rovira, A.D. 1991. The rhizosphere: the hidden half of the hidden half. In Plant roots: the hidden half. Edited by Y. Waisel, A. Eshel, and U. Kafkafi. Marcel Dekker, Inc., New York. pp. 641–699.
143 Buyer, J.S., and Drinkwater, L.E. 1997. Comparison of substrate utilization assay and fatty acid analysis of soil microbial communities. J. Microbiol. Methods, 30: 3–11. Cavigelli, M.A., Robertson, G.P., and Klug, M.J. 1995. Fatty acid methyl ester (FAME) profiles as measures of soil microbial community structure. Plant Soil, 170: 99–113. Chao, W.L., Nelson, E.B., Harman, G.E., and Hoch, H.C. 1986. Colonization of the rhizosphere by biological control agents applied to seeds. Phytopathology, 76: 60–65. Cook, R.J. 1992. A customized approach to biological control of wheat root diseases. In Biological control of plant diseases. Progress and challenges for the future. Edited by E.C. Tjamo, G.C. Papavizas, and R.J. Cook. NATO ASI Series, Series A: Life Sciences. Vol. 230. Plenum Press, New York. pp. 211– 222. Curl, E.A., and Truelove, B. 1986. The rhizosphere. SpringerVerlag, New York. Frostegård, Å., Bååth, E., and Tunlid, A. 1993. Shifts in the structure of soil microbial communities in limed forests as revealed by phospholipid fatty acid analysis. Soil Biol. Biochem. 25: 723–730. Garland, J.L., and Mills, A.L. 1991. Classification and characterization of heterotrophic microbial communities on the basis of patterns of community-level sole-carbon-source utilization. Appl. Environ. Microbiol. 57: 2351–2359. Haack, S.K., Garchow, H., Odelson, D.A., Forney, L.J., and Klug, M.J. 1994. Accuracy, reproducibility, and interpretation of fatty acid methyl ester profiles of model bacterial communities. Appl. Environ. Microbiol. 60: 2483–2493. Hadar, Y., Harman, G.E., Taylor, A.G., and Horton, J.M. 1983. Effects of pregermination of pea and cucumber seeds and of seed treatment with Enterobacter cloacae on rots caused by Phythium spp. Phytopathology, 73: 1322–1325. Leben, S.D., Wadi, J.A., and Easton, G.D. 1987. Effects of Pseudomonas fluorescens on potato plant growth and control of Verticillium dahliae. Phytopathology, 77: 1592–1595. Loper, J.E., Suslow, T.V., and Schroth, M.N. 1984. Lognormal distribution of bacterial populations in the rhizosphere. Phytopathology, 74: 1454–1460. Martin, J.K. 1978. The variation with plant age of root carbon available to soil microflora. In Microbial ecology. Edited by M.W. Loutit and J.A.R. Miles. Springer-Verlag, Berlin. pp. 299– 302. Martinez, V., Nunez, J.M., Ortiz, A., and Cerda, A. 1994. Changes in amino acid and organic acid composition in tomato and cucumber plants in relation to salinity and nitrogen nutrition. J. Plant Nutr. 17: 1359–1368. Morris, D.L. 1948. Quantitative determination of carbohydrates with Dreywood’s anthrone reagent. Science (Washington, D.C.), 107: 254–255. Nelson, E.B. 1988. Biological control of Pythium seed rot and preemergence damping-off of cotton with Enterobacter cloacae and Erwinia herbicola applied as seed treatments. Plant Dis. 72: 140–142. Nelson, E.B. 1991. Exudate molecules initiating fungal responses to seeds and roots. In Beltsville Symposia in Agricultural Research. 14. The rhizosphere and plant growth. Edited by D.L. Keister and P.B. Cregan. Kluwer Academic Publishers, Dordrecht, The Netherlands. pp. 197–209. Richardson, P.T., Baker, D.A., and Ho, L.C. 1982. The chemical composition of cucurbit vascular exudates. J. Experimental Botany, 33: 1239–1247. Roberts, D.P., Sheets, C.J., and Hartung, J.S. 1992. Evidence for proliferation of Enterobacter cloacae on carbohydrates in © 1999 NRC Canada
144 cucumber and pea spermosphere. Can. J. Microbiol. 38: 1128– 1134. Roberts, D.P., Dery, P.D., and Hartung, J.S. 1996a. Peptide utilization and colonization of corn, radish and wheat spermospheres by Enterobacter cloacae. Soil Biol. Biochem. 28: 1109–1111. Roberts, D.P., Marty, A.M., Dery, P.D., Yucel, I., and Hartung, J.S. 1996b. Amino acids as reduced carbon sources for Enterobacter cloacae during colonization of the spermospheres of crop plants. Soil Biol. Biochem. 28: 1015–1020. Roberts, D.P., Dery, P.D., Yucel, I., Buyer, J.S., Holtman, M.A., and Kobayashi, D.Y. 1997. Genetic analysis of the seed colonization mutant Enterobacter cloacae A-11. In Plant growthpromoting rhizobacteria. Edited by A. Ogoshi, K. Kobayuashi, Y. Homma, F. Kodama, N. Kondo, and S. Akino. OECD, Paris. pp. 330–332. Sasser, M.J. 1990. Identification of bacteria by gas chromatography of cellular fatty acids. Technical Note 101. Microbial ID Inc., Newark, Del. Seber, G.A.F. 1984. Multivariate observations. John Wiley & Sons Inc., New York. Spies, J.R. 1957. Colorimetric procedures for amino acids. In Methods in enzymology. Vol. III. Edited by S.P. Colowick and N.O. Kaplan. Academic Press, New York. pp. 467–471. Turner, S.M., and Newman, E.I. 1984. Growth of bacteria on roots of grasses: influence of mineral nutrient supply and interactions between species. J. Gen. Microbiol. 130: 505–512. Turner, S.M., Newman, E.I., and Campbell, R. 1985. Microbial population of ryegrass root surfaces: influence of nitrogen and phosphorus supply. Soil Biol. Biochem. 17: 711–715. Vancura, V. 1964. Root exudates of plants. I. Analysis of root exudates of barley and wheat in their initial phases of growth. Plant Soil, 21: 231–249. Vancura, V., and Hanzlikova, A. 1972. Root exudates of plants. IV. Differences in chemical composition of seed and seedling exudates. Plant Soil, 36: 271–282. Weller, D.M. 1984. Distribution of a take-all suppressive strain of Pseudomonas fluorescens on seminal roots of winter wheat. Appl. Environ. Microbiol. 48: 897–899. Weller, D.M. 1987. Biological control of soilborne plant pathogens in the rhizosphere with bacteria. Annu. Rev. Phytopathol. 26: 379–407. Weller, D.M., and Cook, R.J. 1983. Suppression of take-all of wheat by seed treatments with fluorescent pseudomonads. Phytopathology, 73: 463–469.
Can. J. Microbiol. Vol. 45, 1999 Xu, G.-W., and Gross, D.C. 1986. Selection of fluorescent pseudomonads antagonistic to Erwinia carotovora and suppressive of potato seed piece decay. Phytopathology, 76: 414–422. Zak, J.C., Willig, M.R., Moorhead, D.L., and Wildman, H.G. 1994. Functional diversity of microbial communities: a quantitative approach. Soil Biol. Biochem. 26: 1101–1108. Zelles, L., Bai, Q.Y., Ma, R.X., Rackwitz, R., Winter, K., and Beese, F. 1994. Microbial biomass, metabolic activity and nutritional status determined from fatty acid patterns and polyhydroxybutyrate in agriculturally-managed soils. Soil Biol. Biochem. 26: 439–446. Zelles, L., Rackwitz, R., Bai, Q.Y., Beck, T., and Beese, F. 1995. Discrimination of microbial diversity by fatty acid profiles of phospholipids and lipopolysaccharides in differently cultivated soils. Plant Soil, 170: 115–122.
Appendix The SAS code used to generate the canonical variates analysis for the fatty acid data follows: proc glm data = famesort outstat = chemstat; class sst; model psatd—poxo = sst /ss3; manova H = sst /canonical; quit; proc score data = famesort score = chemstat out = chemscor; var psatd—poxo; quit; proc glm data = chemscor; class sst; model can1 can2 = sst /ss3; means sst /snk lines; quit; The first glm procedure is used to carry out the MANOVA and generate the canonical variates. The variable sst has a different value for each combination of seed and soil type. The variables psatd—poxo represent the proportional fatty acid categories. The score procedure scales the canonical variates and the final glm procedure is used to calculate the means. A similar program was used to calculate the canonical variates for the substrate utilization assay, using the absorbance of the blank well as a covariate in the model statement of the first glm procedure.
© 1999 NRC Canada