Microbial Ecology Testing for Differentiation of Microbial Communities Using Phylogenetic Methods: Accounting for Uncertainty of Phylogenetic Inference and Character State Mapping Ryan T. Jones and Andrew P. Martin Department of Ecology and Evolution, University of Colorado, Boulder, CO 80309, USA Received: 22 December 2005 / Accepted: 23 December 2005
Abstract
Comparative analyses of microbial communities increasingly involve the assay of 16S rRNA (or other gene) sequences from environmental DNA. Determining whether the composition of two or more communities differ in their phylogenetic composition involves testing for covariation between phylogeny and community type. This approach requires estimating the phylogenetic relationships among all sampled sequences and assessing whether the distribution of sequences among communities differs from the null expectation that sequences are randomly distributed. One method developed for implementing the phylogeny-based test of differentiation, referred to as the Phylogenetic test, relies on a single estimate of the phylogeny. However, for most data sets, many alternative phylogenetic trees provide statistically equivalent descriptions of the data. Because the actual phylogeny is unknown, phylogenetic tests of differentiation among microbial communities must account for phylogenetic uncertainty. In this article, we evaluate bootstrapping and Bayesian phylogenetic methods when implementing the Phylogenetic test using parsimony to map character states, and we investigate the effects of character mapping uncertainty by using a Bayesian approach to stochastically map character states on trees. Our approaches incorporate uncertainty into the tests of two closely related null hypotheses: (1) populations are panmictic, and (2) identical communites existed in both environments over the course of evolutionary history. We use two data sets previously implemented in tests for community differentiation: nitrite reductase genes sampled from marsh and upland soils and 16S rDNA Correspondence to: Ryan T. Jones; E-mail:
[email protected] DOI: 10.1007/s00248-006-9002-7
&*
sequences sampled from the human mouth and gut. We show that accounting for phylogenetic and mapping uncertainties can drastically affect results when implementing the Phylogenetic test. Accounting for phylogenetic and character mapping uncertainty provides a more conservative and robust test of covariation between phylogeny and environment when comparing microbial communities using DNA sequences.
Introduction
The significance of diversity is often inferred by comparing communities characterized from different environments. Microbial ecologists increasing rely on using 16S rRNA or some other phylogenetic anchor gene for identifying species in particular environments [9, 27, 38]. In addition, there is increasing emphasis on characterizing protein-coding genes that may perform key biogeochemical functions and asking whether distinct environments harbor different genes (e.g., [29]). Many comparative studies based on DNA data rely on standard measures of overlap, including the percentage of species shared by two communities or similarity indices. These indices are an unfortunate necessity when using approaches such as denaturing gradient gel electrophoresis (DGGE), terminal restriction fragment length polymorphism (T-RFLP), or automated ribosomal intergenic spacer analysis (ARISA) because of the lack of information regarding evolutionary history. However, using these indices in studies with DNA sequence data converted into operational taxonomic units (OTUs) (e.g., [5, 11, 19, 25]) should be avoided because doing so completely disregards the wealth of evolutionary information contained in the sequence data. Because
Springer Science+Business Media, Inc. 2006
R.T. JONES, A.P. MARTIN: PHYLOGENETIC TEST
closely related organisms are more similar to one another than distantly related organisms, community comparisons should not use species (or OTUs) as the unit under investigation [10]; this is the crux of the comparative method. Two main problems confound interpretations derived using similarity indices. First, similarity measures are based on the fraction of identical species only; all sequences that are different are considered equally distinct even though the two communities may harbor very different samples of phylogenetic diversity. For instance, imagine two communities that do not share any exact sequences in common, but that for every sequence present in one community, there is a closely related but genetically distinct phylotype in the other community. In this case, the percent overlap based on operational taxonomic units defined by the sequences is zero, yet both communities harbor nearly identical phylogenetic diversity (see Fig. 2 in [24]). Second, the significance of a particular similarity index value is unclear. Most reports fail to test for significance, and settle for simply reporting an index value. To overcome these problems when comparing microbial communities, Martin [24] recommended adopting phylogenetic methods for comparing communities. Using a method developed by Maddison and Slatkin [23], Martin showed how to evaluate whether the observed distribution of sequences across environments and phylogeny covary. Covariation was measured by optimizing the presence or absence of particular sequences sampled from multiple communities on the inferred phylogeny using parsimony. The significance of the observed covariation was established by determining the expected number of changes under the null hypothesis that the communities from which sequences were sampled does not covary with phylogeny. Maddison and Slatkin [23] showed that the null expectation of panmixia could be estimated by assuming that the community identity of individual sequences remains fixed and that the relationships among sequences are randomized. If the observed number of transitions from one community to another is less than 95% of the values generated from randomized data, then microbial composition differs significantly between the two (or more) communities [24]. The Phylogenetic test depends on accurate estimation of the phylogeny of sampled sequences. Few studies attempt to evaluate the accuracy of inferred trees for sequences isolated from microbial communities. Typically, most studies of microbial communities generate a neighbor-joining tree from a pairwise distance matrix that summarizes the extent of sequence difference among all sampled sequences. Neighbor joining is an algorithmic tree building method that produces a single estimate of relationships [36]. In most cases, little attention is paid to
OF
MICROBIAL COMMUNITY DIFFERENTIATION
the model of evolution adopted to correct the observed genetic distances for multiple substitutions even though model choice can have significant influence on the accuracy of phylogenetic inference [36]. In addition, a number of other problems with distance-based methods have been described. One obvious drawback is that the method ignores the uncertainty of phylogenetic inference because only a single tree is generated. For most data sets, many alternative phylogenetic trees provide equally good (in a statistical sense) explanations of the sequence data, unless, of course, the data exhibit strong hierarchical structure for all groups. Because of this fact, any test depending on an inferred phylogeny should account for uncertainty of the estimated relationships [13]. In the context of comparative analysis of microbial communities, a more conservative and robust test of whether two microbial communities harbor overlapping sets of bacterial lineages requires comparing the distribution of the number of changes required to explain the covariation of community type and phylogeny for a set of statistically similar, but rival, phylogenetic trees. Several approaches have been developed for quantifying the uncertainty around estimates of phylogeny. Perhaps the most widely used approach is nonparametric bootstrapping. Bootstrapping involves random subsampling of base pair positions from the sequence data (i.e., columns of the sequence matrix) with replacement and estimating a new tree from the subsampled data. Repetitive subsampling provides the basis to assess support for all nodes of the inferred phylogenetic tree [7]. Measures of covariation between environment and phylogeny can be obtained from each pseudoreplicate, providing a heuristic estimate of the variance around the estimated covariation. A second approach is to use Bayesian phylogenetic analysis [12]. Bayesian analysis uses Markov chain Monte Carlo (MCMC) methods to generate a set of parameter estimates; in this case, the parameters are the phylogenetic tree and a set of substitution model parameters. The approach involves alteration of a tree and evaluation of whether the new tree is acceptable or rejected with a specified probability. If a new tree is accepted, then it is subject to new changes and the process repeated for a large number of generations. When the probabilities become stationary, the trees estimate the true phylogeny. According to architects of the method as applied to phylogeny, the proportion of generations that any particular tree is visited is the posterior probability of that tree [13, 14]. This approach provides a means of estimating phylogenetic uncertainty, and the true tree is estimated by the posterior probability distribution with explicit statistical confidence. In addition to phylogenetic uncertainty, there is uncertainty in mapping character states (i.e., environ-
R.T. JONES, A.P. MARTIN: PHYLOGENETIC TEST
OF
MICROBIAL COMMUNITY DIFFERENTIATION
ment or community type) along phylogenies. Traditionally, a parsimony approach is used and the minimum number of character state changes needed to reconcile the phylogeny with the observed character states is compared to many random phylogenies. Because a parsimony approach minimizes the number of character changes, it inherently cannot account for uncertainty surrounding the process of character change. Under a parsimony framework, character states are allowed to change only once between nodes—the evolutionary distance between nodes is irrelevant (i.e., a very long branch between nodes is not more likely to have a character state change than a very short branch). To address the uncertainty surrounding character change along phylogenies, a Bayesian approach can be used that generates a posterior probability distribution of the rate and number of changes [15, 26, 33]. For this approach, instead of using random phylogenies with fixed character states, we randomize character states to fixed phylogenies. In this case, the null distribution of the number of character state changes does not represent panmixia; instead, the null distribution represents the probability that across evolutionary time, both lineages could have existed in either environment. Here, the observed distribution is a probability estimate of something occurring in one place or the other, and a departure from the null is a measure of niche specialization over the course of evolution. The difference between the two null hypotheses results from using random phylogenies with fixed character states or randomized character states with fixed phylogenies. In this article, we employ nonparametric bootstrapping and Bayesian methods to accommodate for phylogenetic and character mapping uncertainty when testing for differentiation between microbial communities using phylogenetic approaches. We show that failure to account for these uncertainties can be misleading, and that incorporating uncertainty into the analyses provides a more credible means of establishing whether two communities harbor phylogenetically distinct sets of microbes. Methods
Two sets of sequences comprise the case studies for this article. The first data set is based on samples of 16S rDNA sequences isolated from the human mouth and gut [18, 34]. The second data set was described in a recently published report on nitrite reductase (nirK) gene sequence diversity from two soil types [29]. The first data set was analyzed in the work of Hughes et al. [16] and Martin [24]. DNA sequences were aligned using CLUSTAL X and manually adjusted to preserve the reading frame (for the nirK genes) or to conserve known secondary structure features (in the case of the ribosomal gene sequences).
Only regions for which all sequences overlapped were included. Regions of ambiguous alignment were omitted. Alignments were imported into PAUP* 4.0 [37] to generate neighbor-joining trees. For each data set, we used ModelTest [28] to estimate the best substitution model for the data and used the parameters estimated from ModelTest for neighbor joining clustering. For each data set, we generated pseudoreplicate trees by nonparametric bootstrap analysis using the neighbor joining treebuilding algorithm. The alignments also were imported in MrBayes v3.0 [12] for Bayesian phylogenetic analysis. The analyses employed one cold chain and three incrementally heated chains as described by Huelsenbeck and Ronquist [12]. Model parameters included the six substitution rates of the general time reversible model, the nucleotide frequencies, a gamma distribution rate variation across sites, and the possibility of invariant sites for both the nirK and ribosomal data. A random starting tree and uniform prior distributions were employed using the default parameters of MrBayes. For both data sets, the length of the chain (number of MCMC generations) was set at 700,000. Trees were sampled every 100 generations. BBurnin^ values were 500,000 and 600,000 for the nirK and 16S data sets yielding 2000 and 1000 trees, respectively. (BBurnin^ is the number of generations of results that are omitted because the probabilities are not stationary). In both cases, Bburnin^ values greatly exceeded the point at which probabilities were stationary. For details on Bayesian phylogenetic analysis and access to the software, go to http://morphbank.ebc.uu.se/ mrbayes/info.php. For the data sets, each unique sequence was assigned a character state based on the environment from which it was sampled (e.g., a 0 for one community and a 1 for the other). These character states were optimized on each of the trees from bootstrapping and Bayesian analyses using parsimony with the aid of MacClade [22] for each data set. To generate the null distribution, a similar analysis was performed for random trees generated using the random splitting algorithm in MacClade. In addition to mapping character states along phylogenies using parsimony, we also used a Bayesian approach to stochastically map character states along a collection of Bayesian trees. We generated new trees in MrBayes using the same parameters as before, but we saved branch lengths and sampled every 100th tree for the nirK and every 50th tree for the 16S data sets using a 600,000 generation Bburnin^ (2001 16S trees and 1000 nirK trees). We imported these trees and the character states based on environment into SIMMAP v1.0b (http:// www.simmap.com). SIMMAP uses the simulation procedure of Nielsen [26] to map character states based on prior probability distributions of the rate of change while holding the character states of the terminal taxa constant.
R.T. JONES, A.P. MARTIN: PHYLOGENETIC TEST
100
100
100 86 100
55
100
100
99
90
100
100
63
50 50
100
93
86
100
100
100
99 99
100
94 100 96 52
100
89
84
82 100
100
97
81
63
100
100
96
77
99
100
100
99 79
97
100
72 100
99
99
100
100 76 100 100 100 100
71
100
100
89
100
99
61 93
100
60
100
99 96 86
100 93 100
99
MICROBIAL COMMUNITY DIFFERENTIATION
79 100
100
89
72
OF
99
57
93
72
100
99
100
100
99 100 100
100
100
100
96 100 100 100
54
99
100
100
100
100 69
91 63
84
95
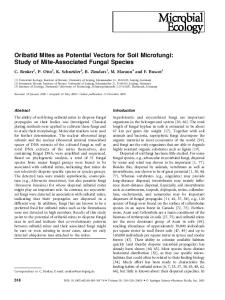
Figure 1. Inferred phylogeny of gut ( filled ovals) and mouth (open ovals) 16S rDNA sequences determined by Bayesian analysis. Numbers
along branches represent posterior probabilities.
R.T. JONES, A.P. MARTIN: PHYLOGENETIC TEST
OF
MICROBIAL COMMUNITY DIFFERENTIATION
Essentially, SIMMAP considers the branch lengths in between two nodes of the phylogeny, and the probability of multiple character state changes along a branch increases with longer branch lengths. The SIMMAP output file gives a posterior probability distribution of the rate of change and the number of changes needed to reconcile phylogeny with the distribution of character states (in this case, the community that the DNA sequence was isolated from). In SIMMAP, rate priors must be set beforehand. The rate prior has a gamma distribution with two parameters: a and b. These parameters govern the mean (a / b) and variance (a / b) of the gamma distribution. If the rate priors are set low, the posterior distribution of the rate is left-skewed, and if they are set high, the posterior distribution of the rate is right-skewed. We explored a range of rate priors by adjusting the a parameter and holding b constant (b = 2.0). We chose a low b value to incorporate a wide range of uncertainty in our prior belief; Schultz and Churchill [33] advocate this approach. We used the rate prior that gave a symmetrical posterior probability distribution of rates to generate our observed and null distributions. Observed distributions were generated using 50 stochastic character mappings per tree for the nirK data set (50,000 observations) and 25 stochastic character mappings per tree for the 16S data set (50,025 observations). We generated null distributions by randomizing the character states among the terminal taxa 50 times and stochastically mapping character states once per randomization per tree (50,000 null observations for nirK and 100,050 null observations for 16S). For Martin’s [24] Phylogenetic test, statistical significance was assessed by randomly rearranging the association between phylogeny and community type a large number of times and comparing the single observed value to the distribution for the randomized
trials. Assuming a critical value of 0.05, significance was assigned if the observed value was less than 95% of the randomized values. When incorporating phylogenetic and character-mapping uncertainty, we no longer have a single observed value; instead, we have a distribution representing the relative probability of each observed value. In this case, assigning significance is not so straightforward. The statistical question is not whether the two distributions are the same (which could simply be analyzed with a chi-square test), but whether the observed values fall within the distribution of the randomized values. This can be obtained by calculating the area of the randomized distribution that overlaps with the observed distribution. However, because both distributions represent posterior probabilities, it is appropriate to scale the amount of overlap for each observed covariation value to the probability of the null value (i.e., Ni ! Oi). For example, if 10% of the null distribution falls on a particular covariation value and 5% of the observed falls on that value, then Ni ! Oi = 0.005 for that covariation value. The overlap is calculated as the sum of the scaled overlap between the observed and randomized distributions divided !P " by2 #the sum of P squared null values: ðNi ! Oi Þ Ni . The summation is from the minimum ith value for the observed distribution to the maximum ith value for the null distribution. The summation is a measure of proportional overlap and can be interpreted as the probability that the real parameter (estimated by the observed distribution) falls within the randomized distribution. Results Human Mouth and Gut. The rooted majority rule consensus tree from Bayesian analysis of the 16S sequences from human gut and mouth is shown in Fig. 1.
Figure 2. Comparison of the inferred number of changes between one community type to another (i.e., covariation) to explain the distribution of 16S sequences between the human gut and mouth for the Bayesian trees with parsimony mapping (white bars), bootstrapped trees with parsimony mapping (black bars), and Bayesian trees with Bayesian mapping (hatched bars). Analyses with the distribution of covariation under the null hypothesis are on the right (black bars: parsimony mapped; white bars: Bayesian mapping). The arrow labeled NJ shows the number of changes required assuming the NJ tree accurately estimates the phylogeny of sequences. Note the jump in values along the abscissa. Left ordinate values apply to the observed data and the right ordinate values apply to the randomized data.
R.T. JONES, A.P. MARTIN: PHYLOGENETIC TEST
80 67
52
60
80 62 26
28 45
84
26 64 63 22
83
93 62
97
67 45
89 35
34
64
83
59
48
84
84 44
93
25
25 81
77
99 53
23 27 68 83
68
84
84 71
35
77
51
81
100 100
U65 U3 M35 U1 M19 U25 M24 M81 M37 U14 M56 M16 U2 U11 U12 M88 M7 M75 M78 U8 M4 M15 U16 M10 M20 U64 U59 U10 U54 U44 U7 M28 M62 M43 M9 M63 M3 M33 M21 M61 U6 M23 M80 M42 M26 U18 M38 M71 U13 M87 M12 M17 M57 M5 M27
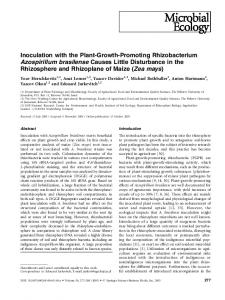
Figure 3. Inferred phylogeny of nirK genes from upland (U) and marsh (M) microbial communities determined by Bayesian analysis. Numbers along branches represent posterior probabilities.
Most of the nodes of this tree have high posterior probabilities, suggesting proportionally few alternative trees provide statistically equivalent explanations of the sequence covariation among taxa. Similar results were obtained from bootstrap analysis. Also notable was the
OF
MICROBIAL COMMUNITY DIFFERENTIATION
tendency of sequences from the same community (gut or mouth) to group together in the inferred phylogeny. There is clear separation between the inferred covariation between phylogeny and environment and the distribution of covariation expected under the null hypothesis (Fig. 2). The posterior probability distribution is much less variable than the neighbor joining bootstrap distribution. In fact, over 90% of the trees present in the posterior probability distribution required only eight character state transitions to explain the covariation between environment (gut or mouth) and phylogeny. Using a Bayesian approach to account for character mapping uncertainty did not considerably change the distribution of covariance. The covariation values ranged from 8 to 18 (95% of the values fell between 8 and 11) with a mode of 8. A large portion of the covariation distribution generated from parsimony mapping fell within the posterior probability distribution: the modal value of 8 from the Bayesian phylogeny with parsimony mapping accounted for 50.64% of the posterior probability distribution and the modal value of 9 from the bootstrapped replicates with parsimony mapping accounted for 29.37% of the posterior probability distribution (Fig. 2). Neither of the parsimony generated distributions approximated binomial expectations using a chi-square test. Notably, the single neighbor-joining tree generated from the original data fell near the right tail of the bootstrap distribution. In this case, regardless of whether we used a single estimate of phylogeny, accounted for phylogenetic uncertainty, or accounted for both phylogenetic and mapping uncertainty, the results were the same: the human mouth and gut harbor significantly different microbial communities. NirK. The rooted majority rule consensus tree from Bayesian analysis of the nirK sequences is shown in
Figure 4. Comparison of the inferred number of changes between one community type to another (i.e., covariation) to explain the distribution of nirK sequences between the upland and marsh sites. Top: Bayesian trees with parsimony mapping (white bars), bootstrapped trees with parsimony mapping (black bars), and the null distribution with parsimony mapping (hatched bars). The arrow labeled NJ shows the number of changes required assuming the NJ tree accurately estimates the phylogeny of sequences. Bottom: Observed (white) and null (black) covariation distributions based on Bayesian character mapping on Bayesian trees.
R.T. JONES, A.P. MARTIN: PHYLOGENETIC TEST
OF
MICROBIAL COMMUNITY DIFFERENTIATION
Fig. 3. Unlike the 16S tree, a notable feature of the consensus tree is the large number of nodes with relatively low posterior probability values, indicating that many alternative trees provide statistically similar explanations of the sequence covariation among taxa. Similar results were obtained from bootstrap analysis. The distributions of covariation based on parsimony mapping differed for the bootstrapped replicates and the Bayesian trees (Fig. 4). Using parsimony to map the character states, covariation values based on Bayesian trees ranged from 11 to 15 with a mode of 13, whereas the values from bootstrapping ranged from 9 to 18 with a mode of 14. Neither distribution approximated binomial expectations using a chi-square test. Notably, the single neighbor-joining tree generated from the original data fell at the left tail of the distributions. After using a Bayesian approach to account for character mapping uncertainty, the distribution of covariance differed considerably. The covariation values ranged from 12 to 54 (95% of the values fell between 20 and 40) with a mode of 28 (Fig. 4). The modal value of 13 from the Bayesian phylogeny with parsimony mapping accounted for only 0.006% of the posterior probability distribution and the modal value of 14 from the bootstrapped replicates with parsimony mapping accounted for 0.042% of the posterior probability distribution. The test for differentiation between the upland and marsh communities revealed that, on average, the phylogeny exhibited greater covariation with environment than expected under the hypothesis of no covariation; however, the two distributions overlapped considerably (Fig. 4). In fact, the observed covariation distributions are almost entirely contained within the distribution for random trees (range = 9–19). Using Bayesian character mapping shifted the observed and null covariation distributions considerably. Whether we used parsimony character mapping on bootstrapped or Bayesian trees or used Bayesian mapping on Bayesian trees, the communities showed no significant differentiation (Table 1). If, however, we based the test of differentiation between communities on the single neighbor-joining tree obtained from the data, we would reject the null hypothesis that the samples of sequences from the two communities were drawn from the same underlying distribution (p G 0.005)(Fig. 4). Table 1. nirK community differentiation p values for various tree building and character mapping techniques
Tree building method
Character mapping method
p Value
Neighbor joining (1 tree) Bootstrap Bayesian Bayesian
Parsimony Parsimony Parsimony Bayesian
G0.005 0.662 0.429 0.950
Discussion
Previously, Martin [24] advocated using phylogenetic methods for comparing the composition of microbial communities; this study assumed that a single estimate of the phylogenetic relationships among sampled sequences for two or more communities was sufficient for robust comparison of communities. However, phylogenetic relationships among sampled sequences are unknown and unknowable. Similarly, we only have data connecting a contemporary sequence to a community/environment type and thus cannot know the historical associations between an evolutionary lineage and community/environment. For these reasons, it is important to estimate phylogenetic uncertainty and character mapping uncertainty when comparing communities and testing for significance. Other approaches, such as X-LIBSHUFF, test phylogenetic differentiation of microbial communities [32]. However, because X-LIBSHUFF uses a distance matrix as its input file, the uncertainty surrounding phylogenetic relationships is ignored in its analysis. Here, we incorporate the uncertainty surrounding phylogeny reconstruction and character state mapping to test two hypotheses: (1) populations are panmictic and (2) identical communites existed in both environments over the course of evolutionary history. The difference between these hypotheses is subtle and results from either (1) randomly creating phylogenetic relationships between sequences and keeping character states fixed or (2) randomly mapping character states on fixed phylogenies. In this article, we randomized phylogenies for the parsimony-mapped characters and randomized character states for the Bayesian-mapped characters. Bootstrapping versus Bayesian Phylogenetic Nonparametric bootstrapping and Bayesian Methods.
methods provide assessments of phylogenetic uncertainty. In this study, estimates of the number of character state changes from one environment to another derived from Bayesian analysis were less variable than values derived from bootstrap analysis. This result mirrors other studies that have shown Bayesian posterior probabilities tend to be higher than bootstrap values [20], suggesting that bootstrapping is a more conservative measure of reliability [35]. In addition, Bayesian posterior probabilities provide greater support with fewer characters than nonparametric bootstrap [2]. It is possible, for instance, that the number of characters supporting a particular phylogenetic group falls below a critical value necessary to achieve a moderate or high bootstrap value [7] but is sufficient for assigning high probability under a specific evolutionary model. In some cases, however, Bayesian posterior probabilities are inflated beyond expectations [4], implying that caution is warranted when interpreting the estimated support for particular phylogenetic relationships.
R.T. JONES, A.P. MARTIN: PHYLOGENETIC TEST
Debate rages over the relative utility of bootstrapping and Bayesian methods for estimating phylogenetic uncertainty. It is important to recognize that bootstrap proportions and posterior probabilities provide different information about the data and uncertainty of phylogenetic inference. Alfaro et al. [2] noted that posterior probabilities provide an assessment of accuracy conditional on the data and the estimated model of evolution, whereas bootstrap values provide an assessment of the sensitivity of the inferred phylogeny to sampling error associated with sampling characters from a particular distribution. Given the enormous number of possible variables influencing estimation of phylogeny [36], the more conservative method seems most practical. However, Bayesian methods are computationally more efficient than bootstrapping under parsimony or maximum likelihood criteria. In addition, if sequence evolution can be reliably modeled probabilistically, posterior probabilities are the appropriate measure of confidence, especially because Bayesian methods have a greater sensitivity to phylogenetic signal than bootstrapping [2]. Incorporating
Character
Mapping
UncertaintyR
Tracking the number of changes to explain covariation between phylogeny and environment or community type is a means to test for phylogenetic differentiation between communities. Incorporating mapping uncertainty concordantly with phylogenetic uncertainty adds muchneeded credibility to the historical reconstructions of character states [30]. It may be inappropriate to make biological inferences based on parsimony-mapped characters, especially when the parsimony reconstruction accounts for a small amount of the actual probability. Although incorporating mapping uncertainty (in addition to phylogenetic uncertainty) into our analyses did not change our inferences, the effects on the history of character change were dramatically different in the two comparisons. For the gut and mouth 16S communities, the most likely parsimony mapping covariation value fell within a large portion of our posterior probability distribution (929% for Bayesian phylogenies), but the parsimony values from the two soil nirK communities represented a very small portion of the posterior probability (G0.05%). In either case, our inferences are more credible after including the effects of mapping uncertainty into our analyses. In addition to lending credibility to covariation analyses, using a Bayesian approach to character mapping provides further information about the communities in question through the posterior distributions of the rate parameter and number of changes from one community type to another. In this paper we used the rate prior that gave a symmetrical posterior distribution to generate observed and null distributions. These values were quite different for the two data sets (16S: 2.8; nirK: 20.0). It is
OF
MICROBIAL COMMUNITY DIFFERENTIATION
clear that a higher rate value is associated with less covariation between phylogeny and character state. It is unclear how branch lengths along the phylogeny or unequal numbers of sequences from each community type may affect the rate, and this would be a worthwhile topic for future research. As microbial ecologists continue the expansion of community sequence data acquisition, the applications of phylogenetic/character mapping techniques to microbial community analyses will grow. Value of Comparative Analysis of Microbial Communities. Microbial communities harbor tre-
mendous phylogenetic diversity. Robust comparison of communities following the approaches outlined in this article provides an important handle on the role of differences in environmental features on the composition and ultimately the function of microbial communities. Failure to detect a significant difference in composition implies some level of functional equivalence, and that any observed differences in the physical properties of the environments may not be biologically significant. Failure to reject the hypothesis that nitrite reductase genes sampled from upland and marsh soils are part of a single population implies that both environments harbor the same phylogenetic diversity, and that if there is some functional differentiation between the communities inhabiting the two sites, it is not evident from the nirK genes. Alternatively, the strong differentiation between the microbial communities of the human gut and mouth implies that aspects of the two environments strongly differentiate among bacteria that can thrive in the different habitats. In this case, sets of related sequences that are restricted to one environment or the other provide subjects for studying adaptation. Similarly, the identification of closely related species that inhabit distinctly different environments (such as the human gut and mouth) provide an opportunity for designing comparative studies that may elucidate the genetic basis of microbial specialization. Finally, finding strong differentiation between communities from the Bsame^ environment can either indicate biogeographical processes or that the environments do actually have differences that went undetected. For example, a recent study found significant differences between microbial communities inhabiting three healthy human guts [6]. However, they indicated that host genetics, immunosuppression, and diet should be investigated as possible causes. Indeed, two subjects could have diets ranging from exclusively fast food to strict vegan and still be considered Bhealthy,^ yet their guts would behave quite differently at a biochemical level. Similarly, another recent study found that significant differences in gut communities of mice was correlated with an Bobesity gene,^ suggesting intergenomic interactions between host and gut community [21].
R.T. JONES, A.P. MARTIN: PHYLOGENETIC TEST
OF
MICROBIAL COMMUNITY DIFFERENTIATION
In any case—failure to reject the null hypothesis or detection of significant differentiation between communities—the value of a statistical tool for comparing microbial communities aids the difficult task of understanding the physical and biological underpinnings of microbial diversity. In this sense, sound statistical tests of microbial community differences represents a first step toward elucidating the rules governing the assembly, composition, and function of microbial communities. Indeed, application of the statistical test to microbial communities sampled during different seasons helped identify conditions associated with dramatic shifts in community composition, providing an important tool for defining how and when to sample microbes and what environmental features are most relevant when trying to understand biotic controls over biogeochemical cycling in soils [31]. Limitations of the Approach. Both of the examples included to illustrate the influence of uncertainty when testing for differentiation between microbial communities utilized relatively small data sets. With advances in the ease and availability of sequencing, assessments of microbial diversity using molecular sequence analysis have become correspondingly more exhaustive. Recently published environmental 16S data sets include over 1000 sequences (e.g., [1]), a development that may increase the accuracy of biological inference but greatly exacerbates the problem of inferring phylogeny and of testing for differences between communities using a phylogenetic approach because of the increased computational cost. However, developments in data processing are keeping pace with the advances in data generation, to some degree. In phylogenetics, recent developments in parallel processing technology have greatly accelerated the task of inferring trees with large numbers of taxa [3, 8, 17]. These advances allow estimation of phylogenetic uncertainty even when the number of taxa sampled is large.
Conclusion
When comparing two microbial communities derived from DNA sequences, allowing for uncertainty in the inferred relationships among sequences decreases the probability of rejecting a true null hypothesis. Because character states mapped using parsimony may represent only a small portion of the posterior distribution of covariation values, it is also beneficial to incorporate mapping uncertainty into community analyses. A conservative test of community composition difference is important because the comparative method is often the first step in identifying key factors regulating the diversity and composition of microbial communities. Although bootstrapping provides a more conservative test, the computational efficiency and power of MCMC methods
make Bayesian analysis particularly attractive when testing whether two environments harbor significantly different microbial communities. Acknowledgments
This work was supported by an NSF Microbial Observatory grant to S. Schmidt and A. Martin. Thanks are due to Steve Schmidt, Sasha Reed, and Elizabeth Costello for editorial comments. We thank J. Bollback for help with SIMMAP. We would also like to thank an anonymous reviewer who helped us immensely with the direction of this article. References 1. Acinas, SG, Klepac-Ceraj, V, Hunt, DE, Pharino, C, Ceraj, I, Distel, MF, Polz, MF (2004) Fine-scale phylogenetic arachitecture of a complex bacterial community. Nature 430(6999): 551–554 2. Alfaro, ME, Zoller, S, Lutzoni, F (2003) Bayes or bootstrap? A simulation study comparing the performance of Bayesian Markov chain Monte Carlo sampling and bootstrapping in assessing phylogenetic confidence. Mol Biol Evol 20: 255–266 3. Brauer, MJ, Holder, MT, Dries, LA, Zwickl, DJ, Lewis, PO, Hillis, DM (2002) Genetic algorithms and parallel processing in maximum-likelihood phylogeny inference. Mol Biol Evol 19(10): 1717– 1726 4. Cummings, MP, Handley, SA, Myers, DS, Reed, DL, Rokas, A, Winka, K (2003) Comparing bootstrap and posterior probability values in the four-taxon case. Syst Biol 52: 477– 487 5. Donachie, SP, Hou, S, Lee, KS, Riley, CW, Pikina, A, Belisle, C, Kempe, S, Gregory, TS, Bossuyt, A, Boerema, J, Liu, J, Frietas, TA, Malahoff, A, Alam, M (2004) The Hawaiian Archipelago: a microbial diversity hotspot. Microb Ecol 48: 509–520 6. Eckburg, PB, Bik, EM, Bernstein, CN, Purdom, E, Dethlefsen, L, Sargent, M, Gill, SR, Nelson, KE, Relman, DA (2005) Diversity of the human intestinal microbial flora. Science 308: 1635 –1638 7. Felsenstein, J (1985) Confidence limits on phylogenies: an approach using the bootstrap. Evolution 39: 783–791 8. Giribet, G, Edgecombe, GD, Wheeler, WC (2001) Arthropod phylogeny based on eight molecular loci and morphology. Nature 413(6852): 157–161 9. Hackl, E, Zechmeister-Boltenstern, S, Bodrossy, L, Sessitsch, A (2004) Comparison of diversities and compositions of bacterial populations inhabiting natural forest soils. Appl Environ Microbiol 70: 5057–5065 10. Harvey, PH, Pagel, MD (1991) The Comparative Method in Evolutionary Biology. Oxford University Press. Oxford, UK 11. Heijs, SK, Damste, JSS, Forney, LJ (2005) Characterization of a deep-sea microbial mat from an active cold seep at the Milano mud volcano in the Eastern Mediterranean Sea. FEMS Microb Ecol 54: 47–56 12. Huelsenbeck, JP, Ronquist, FR (2001) MRBAYES: Bayesian inference of phylogeny. Biometrics 17: 754 –756 13. Huelsenbeck, JP, Rannala, B, Masly, JP (2000) Accommodating phylogenetic uncertainty in evolutionary studies. Science 288: 2349–2350 14. Huelsenbeck, JP, Ronquist, F, Nielsen, R, Bollback, JP (2001) Bayesian inference of phylogeny and its impact on evolutionary biology. Science 2944: 2310–2314 15. Huelsenbeck, JP, Nielsen, R, Bollback, JP (2003) Stochastic mapping of morphological characters. Syst Biol 52(2): 131–158
R.T. JONES, A.P. MARTIN: PHYLOGENETIC TEST
16. Hughes, JB, Hellmann, JJ, Ricketts, TH, Bohannan, BJ (2001) Counting the uncountable: statistical approaches to estimating microbial diversity. Appl Environ Microbiol 67: 4399– 4406 17. Keane, TM, Naughton, TJ, Travers, SA, McInerney, JO, McCormack, GP (2004) DPRml: distributed phylogeny reconstruction by maximum likelihood. Bioinformatics. 2004 Oct. 28 18. Kroes, R, Lepp, PW, Relman, D (1999) Bacterial diversity within the human subgingival crevice. Proc Natl Acad Sci USA 96: 14547–14552 19. Kumar, PS, Griffen, AL, Moeschberger, ML, Leys, EJ (2005) Identification of candidate periodontal pathogens and beneficial species by quantitative 16S clonal analysis. J Clin Microb 43: 3944–3955 20. Leache, AD, Reeder, TW (2002) Molecular systematics of the eastern fence lizard (Sceloporus undulatus): a comparison of parsimony, likelihood and Bayesian approaches. Syst Biol 51: 44–68 21. Ley, RE, Backhed, F, Turnbaugh, P, Lozupone, CA, Knight, RD, Gordon, JI (2005) Obesity alters gut microbial community. Proc Natl Acad Sci USA 102: 11070 –11075 22. Maddison, WP, Maddison, DR (1993) MacClade, v. 3. Sinauer Press. Sunderland, MA 23. Maddison, WP, Slatkin, M (1991) Null models for the number of evolutionary steps in a character on a phylogenetic tree. Evolution 45: 1184–1197 24. Martin, AP (2002) Phylogenetic approaches for describing and comparing the diversity of microbial communities. Appl Environ Microbiol 68: 3673–3682 25. McGarvey, JA, Miller, WG, Sanchez, S, Stanker, L (2004) Identification of bacterial populations in dairy wastewaters by use of 16S rRNA gene sequences and other genetic markers. Appl Environ Microbiol 70: 4267–4275 26. Nielsen, R (2002) Mapping mutations on phylogenies. Syst Biol 51(5): 729–739 27. Pace, N (1997) A molecular view of microbial diversity and the biosphere. Science 276: 734–740
OF
MICROBIAL COMMUNITY DIFFERENTIATION
28. Posada, D, Crandall, KA (1998) Modeltest: testing the model of DNA substitution. Bioinformatics 14: 817– 818 29. Prieme, A, Braker, G, Tiedje, JM (2002) Diversity of nitrite reductase (nirK and nirS) gene fragments in forested upland and wetland soils. Appl Environ Microbiol 68: 1893–1900 30. Ronquist, F (2004) Bayesian inference of character evolution. Trends Ecol Evol 19(9): 475–481 31. Schadt, CW, Martin, AP, Lipson, DA, Schmidt, SK (2003) Seasonal dynamics of previously unknown fungal lineages in tundra soils. Science 301: 1359–1361 32. Schloss, PD, Larget, BR, Handelsman, J (2004) Integration of microbial ecology and statistics: a test to compare gene libraries. Appl Environ Microbiol 70: 5485–5492 33. Schultz, TR, Churchill, GA (1999) The role of subjectivity in reconstructing ancestral character states: a Bayesian approach to unknown rates, states, and transformation asymmetries. Syst Biol 48(3): 651–664 34. Suau, A, Bonnet, R, Sutren, M, Godon, JJ, Gibson, G, Collins, MD, Dore, J (1999) Direct analysis of genes encoding 16S rRNA from complex communities reveals many novel molecular species within the human gut. Appl Environ Microbiol 65: 4799– 4807 35. Suzuki, Y, Glazko, GV, Nei, M (2002) Overcredibility of molecular phylogenies obtained by Bayesian phylogenetics. Proc Natl Acad Sci USA 99: 16138–16143 36. Swofford, DL, Olsen, GJ, Waddell, PJ, Hillis, DM (1996) Phylogenetic inference. In: Hillis DM, Moritz C, Mable BK (Eds.) Molecular Systematics2Sinauer Press. Sunderland, MA, pp 407–514 37. Swofford, DS (2002) PAUP$ 4.0. Sinauer Press. Sunderland, MA, USA 38. Theron, J, Cloete, TE (2000) Molecular techniques for determining microbial diversity and community structure in natural environments. Crit Rev Microbiol 26: 37–57