Nov 6, 2008 - Luminy Case 907, 13288 Marseille Cedex 9, France. 3Complex ..... More precisely, each airport i has a threshold value ss(i) which sets a.
Microdynamics in stationary complex networks Aurelien Gautreau,1 Alain Barrat,1, 2, 3 and Marc Barth´elemy4, 5
arXiv:0811.1051v1 [physics.data-an] 6 Nov 2008
1
Laboratoire de Physique Th´eorique (CNRS UMR 8627), Universit´e de Paris-Sud, 91405 Orsay, France 2 Centre de Physique Th´eorique (CNRS UMR 6207), Luminy Case 907, 13288 Marseille Cedex 9, France 3 Complex Networks Lagrange Laboratory, ISI Foundation, Torino, Italy 4 CEA-D´epartement de Physique Th´eorique et Appliqu´ee, 91680 Bruyeres-Le-Chatel, France 5 Centre d’Analyse et de Math´ematique Sociales (CAMS, UMR 8557 CNRS-EHESS), Ecole des Hautes Etudes en Sciences Sociales, 54 bd. Raspail, F-75270 Paris Cedex 06, France (Dated: November 6, 2008) Many complex systems, including networks, are not static but can display strong fluctuations at various time scales. Characterizing the dynamics in complex networks is thus of the utmost importance in the understanding of these networks and of the dynamical processes taking place on them. In this article, we study the example of the US airport network in the time period 1990−2000. We show that even if the statistical distributions of most indicators are stationary, an intense activity takes place at the local (‘microscopic’) level, with many disappearing/appearing connections (links) between airports. We find that connections have a very broad distribution of lifetimes, and we introduce a set of metrics to characterize the links’ dynamics. We observe in particular that the links which disappear have essentially the same properties as the ones which appear, and that links which connect airports with very different traffic are very volatile. Motivated by this empirical study, we propose a model of dynamical networks, inspired from previous studies on firm growth, which reproduces most of the empirical observations both for the stationary statistical distributions and for the dynamical properties. PACS numbers:
INTRODUCTION
Despite the presence of stable statistical regularities at the global level, many systems exhibit an intense activity at the level of individual components, i.e. at the ‘microscopic’ level. An important illustration of this fact was recently put forward by Batty [1] in the case of city populations. Indeed, even if the population Zipf plots display negligible changes in time, the same city can have very different ranks in the course of history. Similarly, many other systems, in particular occurring in human dynamics studies, present simultaneously stationary statistical distributions and strong time fluctuations at the microscopic level, with activity bursts separated by very heterogeneous time intervals [2, 3, 4, 5]. These systems thus challenge us with the fundamental puzzle which consists in reconciling an important dynamical activity occurring at the local level on many timescales and the emergence of stable distributions at a macroscopic level which can be maintained even when the external conditions are highly non-stationary [6]. For instance, the dynamics of the rank is not consistent with processes such as preferential attachment [7] where the rank is essentially constant in time. These issues naturally apply to the case where complex systems are structured under the form of large networks. In most recent studies, these networks have been considered as static objects with a fixed topology. However, their structure may in principle evolve, links may ap-
pear and disappear. Such topological fluctuations have important consequences: many dynamical processes take place on complex networks [8, 9, 10, 11], and a non trivial interplay can occur between the evolutions of the topology and of these dynamical processes. The structure of the network strongly influences the characteristics of the dynamical processes [11], and the topology of the network can simultaneously be modified as a consequence of the process itself. In this framework, recent studies have been devoted to simple models of coevolution and adaptive networks [12, 13, 14, 15, 16]. Another illustration of the importance of taking into account the dynamics of the network is given by concurrency effects in epidemiology [17]. Indeed, while a contact network is usually measured at a certain instant or aggregated over a certain period, the actual spread of epidemics depends on the instantaneous contacts. In such contexts, it is thus crucial to gain insights into the dynamics of the network, possibly by putting forward convenient new measures and to propose possible models for it. These considerations emphasize the need for empirical observations and models for the dynamics of complex networks, which are up to now quite scarce. In this paper, we study the case of the US airport network (USAN) where nodes are airports and links represent direct connections between them. It is indeed possible to gather data on the time evolution of this network [18] (see also [19] for a study of the yearly evolution of the Brazilian airport network) which represents an important indicator of human activity and economy. Moreover, air trans-
2
0
0
10
A
-1
B
-1
10
10
-2
10
10
-3
10
-3
-4
0
10
10
10
1
2
k
10
10
0
10
2
10
4
w 10
0
8
10
C
D
6
10
P>(s)
-1
10
4
10
-2
10
EMPIRICAL OBSERVATIONS: STABLE STATISTICAL DISTRIBUTIONS IN A FLUCTUATING SYSTEM
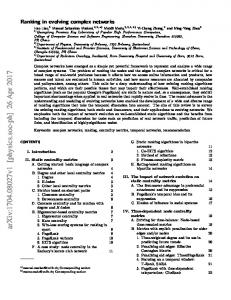
We analyze data available from the Bureau of Transportation Statistics [18]. These data give the number of passengers per month on every direct connection between the US airports in the period 1990 − 2007. We limit ourselves to the period 1990 − 2000 during which the data collection technique is consistent. We obtain 12 × 11 = 132 weighted, undirected [22] networks where the nodes are airports, the links are direct connections, and the weights represent the number of passengers on a given link during a given month. We denote by w the weight of a link, by k the degree (number of neighbors) of a node, and by s its strength, equal to the sum of the weights of the issuing links [23] (in the air-transportation case, the strength gives thus the total traffic handled by each airport). Figure 1 displays the cumulative distributions of degrees, weights and strengths at four different times. These distributions are broad, as already shown in previous studies [23, 24, 25], highlighting the strong heterogeneities present in the air transportation network, for both the topology and the traffic. Figure 1D moreover shows the dependence of the strength s of an airport on its number of connections k, with a clear non-linear behavior denoting a strong correlation between weights and topology [23, 25]. Interestingly, Figure 1 clearly shows that the distributions of degrees, weights, and strengths measured at different times are identical (we have obtained the same distributions at other dates). These distributions are therefore stationary even if, as we will show later, non trivial dynamics occur continuously. The first and simplest evidence for the presence of a dynamical evolution in the network is displayed in Fig. 2A, which shows the total traffic T (t) (equal to the sum of the weights of all links) as a function of time. When the seasonal effects are averaged out, the data can be fitted, as often assumed in economics, by an exponential growth T (t) = T (0) exp(t/δ) with δ ≈ 312 months (δ ≈ 25 years). Note that the data can also be fitted linearly, due to the large value of δ. We also observe similar growth (Figure 3) with seasonal fluctuations of
10
s
10
-2
01/1992 06/1996 12/1998 09/2000
P>(w)
10 P>(k)
portation has a crucial impact on the spread of infectious diseases [20, 21], and it would be interesting to include its dynamical variations in large-scale epidemiological modeling. We first present empirical measures on the dynamics of the USAN. In particular, we provide evidence for the large-scale statistical regularity of many indicators, and we also define convenient metrics that enable us to characterize the small-scale dynamical activity. We then propose a model, based on simple but realistic mechanisms, which reproduces most empirical observations.
2
10 -3
0
0
10
2
10
10 s
4
10
6
10
0
1
10
10
2
10
k
FIG. 1: Characteristics of the US airport network measured at four different dates: 01/1992, 06/1996, 12/1998, and 09/2000. (A) Cumulative distribution of degrees; (B) Cumulative distribution of weights; (C) Cumulative distribution of strengths; (D) Strengths versus degrees for the year 2000 (circles: raw data, squares: average strength for each degree value). The dashed line is a power law with exponent 1.6.
the total number N (t) of connected airports, the total number L(t) of links, the average weight and the node strength. The fits give the same growth rate for N (t) and L(t) (roughly half the growth rate of T (t)), and the average degree hki = 2L(t)/N (t) has small fluctuations (±3) around a constant value (≈ 15), as shown in Fig. 2B, over the 10 years period under study, while the average weight hwi grows exponentially with a typical time of order 2δ.
THE DYNAMICS AT THE MICROSCOPIC LEVEL
We now study in detail the dynamics at the microscopic level, i.e. the evolution of single links. We denote by wij (t) the weight of the link between nodes i and j at time t (in months) and by ηij (t) = [wij (t + 1) − wij (t)]/wij (t) the relative variation of wij from one month to the next. Figure 2C shows the distributions of ηij (t) for all links present in the network both at t and t + 1, for all months in the 10 years dataset under study (period January 1990-December 2000), as well as for a single month (t = May 1995). The fact that the distributions can be superimposed leads to the conclusion that the weights’ evolution can be modeled by the form wij (t + 1) = wij (t) (1 + η)
(1)
where the multiplicative noise η is a random variable whose distribution does not depend on the link (i, j) nor on the time t. The inset of Fig. 2C moreover shows that
5×10 4×10
7
The distribution of η is truncated at −1, since this corresponds to a weight going to 0, i.e. to the disappearance of a link. Links indeed can be created or suppressed between airports, and in fact the number of link creation events is 4 × 10⁴ for the 11 years period under study, for a total number of links in the 132 networks close to 3 × 10⁵ . This result immediately raises the question of the lifetime τ of links. As shown in Fig. 4A, the distribution of τ is very broad, with a power law behavior P (τ ) ∼ τ −α with α = 2.0 ± 0.1. Some comments are
A
7
Month
〈k〉
01/90
01/94
01/96
01/98
01/00
01/92
01/94
01/96
01/98
01/00
16 14
B
01/90 10
P(η)
01/92
0
0
10
-1
10
10
-2
0
C
10
10
-2
1
10
10
Slope -2
-3
0
η
10
5
P(τ)
T(t)
3
-2
10
A -4
10
〈w〉(t)
N(t)
400 360
C
A
2.0×10
4
320 01/90
01/98
01/90
01/94
01/98
D
B
1.0×10
3×10
2500
2×10 01/90
01/94
01/98
01/90
01/94
τ
10 years
0
0
fd fa
B
-4
10
-8
10 -1
P(smax /smin)
10
10
0
10
10
2
4
smax /smin
10
6
10
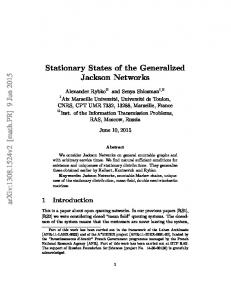
FIG. 4: (A) Lifetime distribution of links (in months). Links which were existing at the beginning of the measure (January 1990) and still present at the end (December 2000) are discarded. The full line is a power law fit with an exponent −2.0±0.1. (B) Fraction fd (open circles) of disappearing links and fa (pluses) of appearing links as a function of the ratio smax /smin of the strengths of their extremities. The scale is on the left-hand y-axis. We also show the logarithmically binned reference distribution P (smax /smin ) (line above the shaded area, scale on the right-hand y-axis).
4
5
〈s〉(t)
E(t)
3000
01/94
1/2 year 1 year 2 years
1 month
10
fd , fa
FIG. 2: (A) Total traffic on the US airport network versus time. The symbols represent the annual traffic and the dashed line is an exponential fit with time scale δ ≈ 312 months. (B) Average degree hki, approximately constant and of order 15 (dashed line). (C) Distribution of the relative weights increments η = (w(t + 1) − w(t))/w(t). The full line corresponds to the distribution obtained over the 11 years under study. Circles correspond to one single month (May 1995). In the inset, we show the tail of the distribution of η, with a power law fit P (η) ∼ η −ν , giving ν = 1.9 ± 0.1 (dashed line).
5
01/98
FIG. 3: Time evolution of (A) the number of nodes N (t), (B) the number of links L(t), (C) the average link weight hwi(t) and (D) the average node strength hsi(t) in the US airport network from January 1990 to December 2000. Dashed lines are exponential fits.
the distribution of η is broad, with a power law behavior P (η) ∝ η −ν (with ν ≈ 1.9 ± 0.1) for η > 0. The broadness of this distribution indicates that most relative increments are small but that sudden and large variations of the weights can be observed with a small but non negligible probability.
in order. First, we consider in this distribution only the links which appear and disappear during the period under study. This is necessary since we cannot know the real lifetime of a link which is already present at the start of the period or still present at the end. Second, while the most probable value for τ is small, which implies that new links are the most fragile, the distribution extends over all available timescales: links of an arbitrary age may disappear. This indicates a non trivial dynamics with appearance/disappearance of both ‘young’ and ‘old’ links. This strong heterogeneity of lifetimes is in line with other results about human activity [3], where it has been shown to have a strong impact on dynamical processes [26]. It is therefore important to characterize and incorporate it into models of dynamically evolving complex networks. These results show that, behind the stability of the statistical characteristics of the USAN, incessant microscopic rearrangements occur. We now propose a system-
4 atic way to characterize the corresponding fluctuating connections, whose importance stem from the fact that they induce changes in the topology of the network. Each link (i, j) can be characterized by a certain number of quantities such as its weight wij , the strengths of its extremities si and sj , etc. It is usual to consider the distributions of these quantities over the whole network, and we will consider these distributions as reference (see Fig. 1). In addition, we propose to focus at each time t on the links which appear (or disappear), to study the distributions of these links’ characteristics, and to compare them with the reference distributions. For instance, if Nt (w) is the number of links with weight w at time t, and Ntd (w) is the number of such links that disappear between t and t + 1, we measure the fraction of links of weight w that disappear at time t, fd (w) =
Ntd (w) . Nt (w)
(2)
We also define the number Nta (w) and fraction fa (w) of links of weight w that appear at t. Similarly, fd and fa can be measured for other links characteristics as we will investigate. A priori, all these quantities depend on the measurement time t. We have already seen that the reference distributions are stationary (Fig. 1). Strikingly, we observe that the fractions fd and fa display as well a stationary behaviour (Fig. 5), even if they clearly highlight a strong dynamical evolution. In the following, we will therefore drop any t index and measure fd and fa averaged over the whole period under study.
0
fa
10
1992 1995 1998 all years -1
10
0
10
2
10
10
4
6
10
smax /smin
FIG. 5: Fraction fa of appearing links in the USAN as a function of the ratio smax /smin of the strengths of their extremities. Circles, squares and diamonds correspond to the data of three distinct years, while the pluses represent the data averaged over the whole 10-years time period. This figure clearly illustrates the stationarity of fa .
The measure of fd (w) and fa (w) indicate that most links have a small weight just before they disappear or
just after their birth, which is not a surprise. However, fd and fa are broad, extending on several orders of magnitude of w values: appearing and disappearing connections occur with non negligible probabilities even at strong weights. We also note a strong similarity between fd and fa , due to the large number of links with lifetime of order a few months, during which no strong evolution of w occurs. A more detailed analysis shows the presence of two regimes in fd(a) : for links with w < 102 passengers per month, fd and fa present rather large values close to 0.8. For w > 102 , these fractions decrease slowly: also links with large weights can appear or disappear. We also observe that for w > 103 there are more links which appear than which disappear, an effect which is consistent with the increase of the total traffic. As previously mentioned, a similar analysis can be carried out for various links’ characteristics; particularly relevant quantities include the traffic of the airports located at both ends of the link. In the following we denote by smax (l) = maxl=(i,j) (si , sj ) and smin (l) = minl=(i,j) (si , sj ) the larger and smaller traffic of the extremities of a link l = (i, j). A measure of the importance of the link for i and j is given by w/smin and w/smax . For instance, if w/smin is small, the link carries only a small fraction of i’s and j’s traffic; on the contrary, a large w/smax indicates that the link is important for both its extremities. The study of fd(a) (w/smin ) and fd(a) (w/smax ) shows that most links which disappear/appear display small values of these ratios, of order w/smin < 10−3 and w/smax < 10−4 . This means that most of these links have a small importance for the airports to which they are attached. For larger values of w/smin(max) , the ratios fd and fa decrease, from ∼ 0.7 to ∼ 10−2 , and surprisingly increase again (from ∼ 10−2 to ∼ 10−1 ) for w/smin > 10−1 and w/smax > 10−2 . This phenomenon corresponds to links which are very important for some airports, the extreme case being airports with a single connection (these airports have thus usually a small strength). Finally, we also consider the ratio smax /smin of the traffic of the links extremities. This quantity indicates indeed how similar the airports connected by the link are, in terms of traffic. We plot in Fig. 4B the fractions fd(a) (smax /smin ) of links which disappear (appear) as a function of smax /smin . On this figure we also show the reference probability distribution P (smax /smin ) which displays a broad behavior: most links connect airports of similar importance, but the ratio smax /smin varies over 6 orders of magnitude, and a non negligible fraction of links connect very different airports. Interestingly, fd(a) (smax /smin ) displays two different regimes. For smax /smin < 103 , small values of fd are obtained: links which connect airports of similar, or not too dissimilar, sizes, are rather stable. In the opposite case when smax /smin > 103 , the fraction fd increases rapidly to reach another plateau, at values of order 0.7 − 0.8. This
5 last regime corresponds to links connecting airports with very different traffic, which turn out to be the most fragile and to have a short lifetime. We can now summarize the results of our empirical observations, obtained through the analysis of the tools introduced in Eq. 2: (i) The links which disappear have essentially the same properties as the ones which appear. (ii) The disappearing/appearing links have a weight which is low on average but broadly distributed: large weights links may appear or disappear with a non negligible probability. (iii) Most disappearing links have small weights with respect to the traffic of their extremities, but links appear or disappear in the whole range of w/s. (iv) Links which connect airports with very different traffic are very volatile. (v) The lifetime of links is broadly distributed and covers all available timescales. The set of measures we have presented, while not exhaustive, is able to give a clear characterization of the dynamics of the network under study [32]. They are also easily applicable to any network undergoing topological changes, and can be generalized to include other links characteristics. The results of the empirical analysis may moreover serve as guidelines in the elaboration of a model for dynamically fluctuating networks. In particular and in contrast with most models found in the literature, topological modifications of the network result here from the stochastic evolution of weights.
A MODEL FOR DYNAMICAL NETWORKS
Using the results of the empirical analysis of the airport network as guidelines, we now propose a model for dynamically fluctuating networks able to reproduce the main features observed for the USAN, and which highlights important features of dynamical networks modeling. We consider simple ingredients that can easily be extended with more detailed rules, and can therefore serve as a modeling basis in many other fields where the dynamics of weights and links is essential. In this model, topological modifications of the network result from the stochastic evolution of weights. We start from ideas developed in [27, 28, 29] to model firm growth through a process based on multiplicative growth of subunits together with fusion/creation rules. In our framework, we consider airports (nodes) and connections (links) instead of firms and subunits. The equivalent of a firm’s size is then given by the traffic of the airport as measured by its strength, and the subunits sizes correspond to the traffic on each link. An essential difference distinguishes our model from the firm growth model where the various firms undergo independent evolutions: here, each node is connected to many others by links whose weights evolve randomly, so that the evolution of
the airports sizes are correlated. Let us present the details of the modeling framework. We start (at time t = 0) from an initial network composed of N0 and L0 links with L0 ≈ N0 (we have checked that the initial conditions do not influence the results). At each time step t, we first compute for each link (i, j) with weight wij (t) a random increment δwij (t) = wij (t)η ,
(3)
where η is a random variable drawn from a distribution independent from time and from the pair (i, j), and which may a priori take values in ] − 1, +∞[. For hηi > 0, the total traffic will on average grow exponentially. For the sake of simplicity we will choose for η a Gaussian distribution (truncated at −1), with variance σ 2 [34]. The weights’ increments govern the evolution of the network’s topology: depending on the values of δwij , the nodes i and j can either update the weight of (i, j), delete it or create new links towards other nodes. More precisely, each airport i has a threshold value ss (i) which sets a criterium of viability for a connection: if a link’s weights drops below this threshold, the airport i does not consider the link anymore as interesting and removes it. For simplicity, we take thresholds independent from time and uniform: ss (i) = 1.0 for all i. The detailed evolution rules are as follows: • (1) If δwij (t) < 0, i and j test each the viability of the connection (i, j). If wij (t) + δwij (t) < max (ss (i), ss (j)), the link disappears and its weight is uniformly redistributed over the other connections of i and j. In the opposite case, wij (t)+δwij (t) > max (ss (i), ss (j)), the link’s weight is simply updated: wij (t + 1) = wij (t) + δwij (t). • (2) If the weight increment δwij (t) is positive, we assume that i and j have contributed equally to it and can decide each on how half of it should be used: If δwij (t) > ss (i), with probability pf node i will use its part δwij (t)/2 of the increment to create a new link (i, ℓ) with weight wiℓ = δwij (t)/2. With probability 1 − pd , ℓ is an existing airport chosen at random, and with probability pd it is a new node. pd therefore governs the rate of growth of the number of nodes. With probability 1 − pf , node i simply increases the weight wij of δwij (t)/2. Node j then chooses independently either to create a new link (j, k), or to increase the weight wij by an amount equal to δwij (t)/2. • (3) If 0 < δwij (t) < ss (i), node i increases the weight of (i, j) of δwij (t)/2. The same procedure is applied to node j. The rules (1)-(3) express the concept that the evolution of the traffic governs the topological modifications
6
0
0
B
-2
4
-2
A
-4
10
-1
0
10
10
N=10 4 N=5.10 5 N=10 5 N=1.5.10
10
10
1
2
10 k/〈k〉 10
-2
-4
10
0
10
2
P>(w/〈w〉)
10
4
10 w/〈w〉10
10
0
4
10
10
2
10
-2
10
0
C
-4
10
10
D
s/〈s〉
P>(k/〈k〉)
10
P>(s/〈s〉)
of the network. If a weight becomes too small, the corresponding connection will be stopped. On the other hand if it grows too fast, new connections can be created. The quantity pf determines the rate of new connections. If pf is close to one, as soon as an increment δw is large enough a new link will be created, which in turn will limit the growth of weights since they are used to create new connections. In the opposite case of small pf , the number of links will grow very slowly but the weights will reach more easily large values. At each time step, the total traffic T (t) is multiplied on average by 1 + hηi leading to an exponential growth T (t) ∝ exp(t/d) with d = 1/hln(1 + η)i. The number of nodes and links also grow in time, and their simultaneous growth, controlled by pf and pd , results in an average degree hki which fluctuates around a constant value, function of the parameters pf , σ, hηi, and pd . For instance, for larger pd , N (t) grows faster and hki is smaller. The model rules can easily be modified to incorporate other elements, such as preferential attachment mechanisms or random distributions of the threshold values ss (i). While we will focus here on the simplest version as described above, we have also considered variants (i) in which the link’s relevance is tested if δwij < max (ss (i), ss (j)) (instead of the condition δwij < 0), or (ii) where the weight of deleted links is re-distributed at random, or (iii) only one new link can be created, either from i or j. The conclusion is that the qualitative features are not modified, showing that the simulation results presented below are robust with respect to such changes. We have also simulated the case pd = 0 in which no new nodes are inserted, N (t) = N0 . In this case, the global increase of traffic leads at large time to a fully connected network, but during a long time, it remains sparse (hki ≪ N (t)) and the same results are again obtained in this regime. Figures 6 and 7 summarize some results of our numerical simulations of the dynamical network model. Although the network evolves with many links creations and deletions, the distributions of degrees, weights, and strengths display a remarkable stability, as shown in Figure 6 for N (t) growing from 104 to 105 . All these distributions are broad, consistently with empirical observations, and the non-linear behavior of the strength versus degree is reproduced as well. Interestingly, this behavior (a power law with an exponent of the order 1.4, see Fig. 6D) emerges here as a result of the stochastic dynamics without any reference to preferential attachment mechanisms combined with spatial constraints [25] or with link additions between nodes [30, 31]. While many network models are able to produce broad degree and strength distributions, the focus of this paper lies in the small-scale dynamical aspects. We show in Fig. 7A that the lifetime distribution of the links is broad, as in the USAN case, and we report in Fig. 7B the behavior of fd (smax /smin ). Strikingly, our model reproduces the
-2
10 -1
10
0
10
1
2
10 10 s/〈s〉
3
10
-1
10
0
10
1
10
10
2
k/〈k〉
FIG. 6: Model simulation obtained with the parameters pd = 0.01, pf = 0, 1, σ = 0.0225 and hηi = 10−3 . Cumulative distributions obtained at different times of the network growth (N = 104 , 5.104 , 105 and 1.5.105 ) of: (A) normalized degrees P (k/hki), the dashed line represents a power law with exponent −2.5; (B) normalized weights P (w/hwi), the dashed line represents a power law of exponent −1.5; (C) normalized strength P (s/hsi), the dashed line represents a power law with exponent −1.5. (D) Strength versus degree. Circles represent s(k) for each node; full squares represent the same data, averaged for each k, and binned logarithmically. This measure is done for N = 105 and the dashed line represents a power law with exponent 1.4.
empirical behavior shown in Fig. 4B, with two different plateaus at small and large smax /smin . Other properties of the appearing or disappearing links coincide in the model with the empirical results, such as the fact that most disappearing links have a small weight, or the nontrivial shape of fd(a) (w/smin(max) ), with a decreasing fd for w/s > 0.01, and an increase at w/s > 0.1. In summary, the simple assumptions on which our model is based yields stationary non-trivial emergent properties such as broad distributions and nonlinearities, together with an active local dynamics of links occuring on all time scales, and whose characteristics reproduce the empirical findings concerning the USAN’s microscopic dynamics.
DISCUSSION
The question of the dynamical evolution of networks is crucial in the study of many dynamical processes and complex systems. If the time scales governing the dynamics of the network and of the process taking place on it are comparable, one can indeed expect a highly non trivial behavior, which in principle could be very different from the static network case. In this article, we have used as a case study the US airline network, and we have
7
10
0
P(τ)
-2
10
A
-4
10
-6 0
fd
1
10
10
10
0
2
τ
3
10
10
10
0
fd
-1
B
10
10
-4
P(smax /smin)
10
-2
10
0
10
1
10
2
10
smax /smin
3
10
FIG. 7: Model simulation with the same parameters as in Fig. 6. (A) Lifetime distribution P (τ ) displaying a broad behavior. A power law fit gives an exponent of order −1.1 ± 0.1. (B) Fraction of disappearing links fd versus smax /smin (circles). We also represent the logarithmically binned reference distribution of smax /smin (line above shaded ares).
shown that it exhibits stationary distributions despite the incessant creation and deletion of connections on broadly distributed timescales. We have introduced a set of measures in a systematic way in order to characterize this dynamics. Finally, we have proposed a model based on simple assumptions which reproduces the main empirical features, both for stationary and local dynamical properties. The coexistence of stationary distributions and strong microscopic activity taking place at very different timescales occurs in many different systems and our model can provide a framework that can easily be extended and serve as a basis for further and more detailed modeling. For instance, we have observed that a bimodal distribution of the thresholds ss (i) for the deletion of a link results in the following picture: nodes with small ss have typically a large degree, but are connected to weak links, while nodes with large ss reach a smaller number of stronger connections. This behavior does not correspond to infrastructure networks such as the USAN but could describe social behavior where individuals with many connections do not have intense (i.e. with large weight) relations. In these perspectives, the present work should stimulate further studies on the coexistence of dynamics at different scales and on the impact of network dynamics on different processes. Acknowledgements: We thank V. Colizza and J.J. Ramasco for a careful reading of the manuscript and interesting suggestions.
[1] Batty, M. (2006) Nature 444, 592. [2] Eckmann, J., E. Moses, and D. Sergi (2004) Proc. Natl. Acad. Sci. USA 101, 14333-14337. [3] Barab` asi, A.-L. (2005) Nature 435, 207. [4] V´ azquez, A., Oliveira, J. G., Dezs¨ o, Z., Goh, K.-I., Kondor, I., Barab` asi, A.-L. (2006) Phys. Rev. E 73, 036127. [5] Gonz´ alez, M. C., Hidalgo, C. A., Barab` asi, A.-L. (2008) Nature 453, 479–482. [6] Malcai, O., Biham, O., Solomon, S. (1999) Phys. Rev. E 60, 1299-1303. [7] Barab´ asi, A.-L., Albert, R. (2002) Rev. Mod. Phys. 74, 47-97. [8] Dorogovtsev, S.N., Mendes, J.F.F. (2003) Evolution of Networks: from biological nets to the Internet and WWW (Oxford University Press, Oxford). [9] Newman, M.E.J. (2003) SIAM Review 45, 167-256. [10] Pastor-Satorras, R., Vespignani, A. (2004) Evolution and structure of the Internet: A statistical physics approach (Cambridge University Press, Cambridge). [11] Barrat, A., Barth´elemy, M., Vespignani, A. (2008) Dynamical processes on complex networks (Cambridge University Press, Cambridge). [12] Zimmermann, M. G. , Egu´ıluz, V. M. , San Miguel, M. (2004) Phys. Rev. E 69, 065102(R). [13] Gross, T., Dommar D’Lima, C., Blasius, B. (2006) Phys. Rev. Lett. 96, 208701. [14] Holme, P., Newman, M. E. J. (2006) Phys. Rev. E 74, 056108. [15] Nardini, C., Kozma, B., Barrat, A. (2008) Phys. Rev. Lett. 100 158701. [16] Shaw, L.B., Schwartz, I.B. (2008) in Adaptive Networks: Theory, Models and Applications, Springer/NECSI Studies on Complexity Series, Gross, T. and Sayama, H. (Eds). [17] Morris, M., Kretzschmar, M. (1997) AIDS 11, 641-648. [18] Bureau of Transportation Statistics http://www.bts.gov [19] Correa da Rocha, L.E. (2008) preprint arXiv:0804.3081. [20] Colizza, V., Barrat, A., Barth´elemy, M., Vespignani, A. (2006) Proc. Natl Acad. Sci. (USA) 103, 2015. [21] Crepey, P., Barth´elemy, M. (2007) Am J Epidemiol. 166 1244-51. [22] From a rigorous point of view, the weights are not fully symmetric, but the deviations are small so we will use the symmetric undirected graph and avoid the complication deriving from flow imbalances. [23] Barrat, A., Barth´elemy, M., Pastor-Satorras, R., Vespignani, A. (2004) Proc. Natl Acad. Sci. (USA) 101, 3747. [24] Guimera, R., Mossa, S., Turtschi, A., Amaral, L.A.N. (2005) Proc. Natl Acad. Sci. (USA) 102 7794. [25] Barrat, A., Barth´elemy, M., Vespignani, A. (2005) J. Stat. Mech. P05003. [26] V´ azquez, A., R´ acz, B., Luka´cs, A., Baraba´si, A.-L. (2007) Phys. Rev. Lett. 98, 158702. [27] Stanley, M.H.R., Amaral, L.A.N., Buldyrev, S., Havlin, S., Leschhorn, H., Maass, P., Salinger, M.A., Stanley, H.E. (1996) Nature 379, 804. [28] Amaral, L.A.N., Buldyrev, S., Havlin, S., Salinger, M.A., Stanley, H.E. (1996) Phys. Rev. Lett. 80, 1385-1388. [29] Lee, Y., Amaral, L.A.N., Canning, D., Meyer, N., Stanley, H.E.S. (1998) Phys. Rev. Lett. 81, 3275.
8 [30] Bianconi, G. (2005) Europhys. Lett. 71, 1029. [31] Wang, W.-X., Wang, B.-H., Hu, B., Yan, G., Ou, Q. (2005) Phys. Rev. Lett. 94, 188702. [32] Note that a straightforward other set of measures concerns the degrees of the links’ extremities, see also [33] for the definition of interesting measures combining weights and degrees. We have focused here on traffic properties,
which are particularly relevant in the airport network case. [33] Ramasco, J.J., Gon¸calves, B., Phys. Rev. E 76, 066106. [34] We have also run simulations with broad distributions of η for η > 0, with the same results.