Update
TRENDS in Genetics Vol.21 No.1 January 2005
21
Microeconomic principles explain an optimal genome size in bacteria Juan A.G. Ranea1, Alastair Grant1, Janet M. Thornton2 and Christine A. Orengo1 1 Biomolecular Structure and Modelling Group, Department of Biochemistry and Molecular Biology, University College London, London, UK, WC1E 6BT 2 EMBL-EBI, Wellcome Trust Genome Campus, Hinxton, Cambridge, UK, CB10 1SD
Bacteria can clearly enhance their survival by expanding their genetic repertoire. However, the tight packing of the bacterial genome and the fact that the most evolved species do not necessarily have the biggest genomes suggest there are other evolutionary factors limiting their genome expansion. To clarify these restrictions on size, we studied those protein families contributing most significantly to bacterial-genome complexity. We found that all bacteria apply the same basic and ancestral ‘molecular technology’ to optimize their reproductive efficiency. The same microeconomics principles that define the optimum size in a factory can also explain the existence of a statistical optimum in bacterial genome size. This optimum is reached when the bacterial genome obtains the maximum metabolic complexity (revenue) for minimal regulatory genes (logistic cost). Various hypotheses argue that bacterial genome size is an object of natural selection, and small genome sizes are adaptations that promote competitiveness by reproductive efficiency [1,2]. In prokaryotes we can estimate the size and complexity of different genomes by measuring the number of open reading frames (ORFs). Therefore, in this article we define complexity by the number of ORFs [1]. It is now clear that genome size is not necessarily related to phenotype or lineage in bacteria. Bacteria with a broad range of phenotypes and lifestyles can have similar genome sizes, and diversity in genome size has been observed for bacteria belonging to relatively narrow phylogenetic groups [2]. Gene duplication [3] and lineagespecific gene loss [4,5] seem to have a primary role in determining bacterial genome size, followed by horizontal gene transfer [6,7]. Furthermore, the smallest genomes are usually derived from bacteria with larger genomes through a process called evolution by reduction [4,5]. Therefore, it is reasonable to suppose that gene family evolution (gene duplication and loss) and genome size variation have been interdependent events in evolution [8,9]. Our approach enables us to detect a set of ancestral gene superfamilies that are universally distributed and whose occurrences are highly correlated with genome size and thus complexity in bacteria. The application of classical microeconomics concepts for productive systems to the distribution and functional analysis of these Corresponding author: Ranea, J.A.G. (
[email protected]). Available online 26 November 2004 www.sciencedirect.com
size-dependent superfamilies can help to explain the existence of an optimum genome size in bacteria, and to clarify the genetic and functional determinants involved in bacterial size distribution. Defining size-dependent and universal superfamilies and their distributions We have determined the domain superfamilies in the CATH database that are most likely to be contributing to bacterial genome complexity because their occurrences are significantly correlated with genome size. The CATH database is a hierarchical classification of protein-domain structures, and there are structure-derived hidden Markov models (HMMs) of sequences for each domain superfamily [10]. Using the HMMs, we first assigned genes to homologous superfamilies in CATH. By exploiting structural data, this approach ensures higher sensitivity in detecting remote homology [10] than purely sequencebased methods because the protein structure is much more highly conserved than the protein sequence during evolution. The occurrence of each superfamily domain was calculated for 100 bacterial species (Table 2 in supplementary material online), and used to build up superfamily occurrence profiles throughout the different species (Figure 1 in supplementary material online). The correlation between genome sizes, measured in number of ORFs, and superfamily occurrences was then calculated using Spearman’s rank correlation coefficient [11]. Superfamilies where domain occurrence is highly correlated with genome size (Spearman coefficient R0.7) were selected; these are referred to as sizedependent superfamilies (Table 1 in supplementary material online). A subset of universal superfamilies was selected from the size-dependent group. These correspond to superfamilies with widespread representation in bacteria (universal percentage R70% of the 100 bacterial species). Practically all size-dependent superfamilies are shown to be universally distributed under this criterion (Table 1 in supplementary material online). Standard residual plot analysis was applied to analyse the distributions of the size-dependent and universal superfamilies [12,13]. Domain occurrence was plotted versus increasing genome size for each superfamily, and the respective residual plot patterns used to determine the most appropriate model (Figure 2 in supplementary material online). Three major types of superfamilies
Update
22
TRENDS in Genetics Vol.21 No.1 January 2005
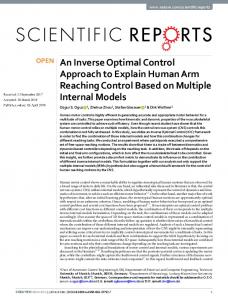
were identified from their distributions. These were linearly (Figure 1a), power-low (Figure 1b), and logarithmically (Figure 1c) distributed superfamilies. Functional characterization of each set of superfamily distributions All superfamilies from each subdivision were selected for detailed functional analysis. The 38 linearly distributed superfamilies are primarily associated with metabolism; 87% of domains and 82% of the superfamilies are involved in general cellular metabolism. For example, of the two most frequent superfamilies in bacteria, the nucleotide (a)
1600
Number of ORFs
1400 y = 0.1723 x + 19.607 R2 = 0.97
1200 1000 800 600 400 200 0 0
2000
4000
6000
8000
10 000
8000
10 000
Genome size (b)
1400
Number of ORFs
1200
y = 0.0004 x 1.656 R2 = 0.95
1000 800 600 400 200 0
0
2000
4000
6000
Genome size
Number of ORFs
(c)
200 180 160 140 120 100 80 60 40 20 0
y = 54.87 Ln(x) – 334 R2 = 0.89
0
2000
4000
6000
8000
10 000
Genome size TRENDS in Genetics
Figure 1. Three principal types of domain superfamily distributions. The total number of open reading frames (ORFs) for all the superfamilies classified in the three subdivisions (linear, power-low and logarithmic) was calculated in each species (y axis), and plotted against the bacteria genome in the 100 species (x axis). Regression line equations and R2 adjustments are also indicated. (a) Linearly distributed superfamilies; (b) power-low-distributed superfamilies; and (c) logarithmically distributed superfamily set. www.sciencedirect.com
triphosphate hydrolase domain provides motion and reaction energy in prokaryotic and eukaryotic organisms, whereas the NADP-binding domain performs oxidizing or reducing chemistry for a broad range of different reactions [14,15]. Functional versatility characterizes all the superfamily domains in this subdivision, which are present in genes participating in virtually all levels of bacterial metabolism (Table 3 in supplementary material online). For the 20 power-low distributed superfamilies, 80% of all domains and 60% of all superfamilies in this set are involved in basic, ancestral mechanisms of gene regulation that have been highly extended and diversified in bacteria. All the principal transcription factor domains in bacteria are represented in this subdivision (the winged-helix, the homeodomain-like or the l-repressor DNA-binding domains) [16], and the main functional domains of the bacterial two-component signal transduction system (the CheY response regulator domain, the high-affinity periplasmic solute-binding protein (SBP), or the histidine kinase domain) (Table 3 in supplementary material online) [17]. Regulatory domains show a high modularity and usually combine with enzymatic or small molecule-binding domains responsible for regulatory specificity [14,16]. This feature could explain the presence of some metabolic superfamilies in this subdivision. Eight superfamilies display logarithmic distribution. Domains in this set represent 10% of all the sizedependent and universal domains and 9% of the superfamilies. These superfamilies do not show any single functional tendency, but are involved in diverse cellular processes such as metabolism, RNA binding or DNA repair (Table 3 in supplementary material online). This makes it difficult to define a single functional term for this group, and because they represent a small proportion of the superfamilies they were not considered in the analysis presented below. Limits to bacterial genome expansion The regulatory and metabolic subdivisions represent 90% of all size-dependent and universal domains and 91% of the superfamilies and were therefore selected for more detailed analysis and comparison of their distributions. Interestingly, fitting the distributions of these two types of superfamilies to regression lines showed that the functions cross when the genome size reaches 10 500 ORFs (Figure 2a), suggesting that when bacterial size increases above this value regulation exceeds metabolic complexity. These results indicate that regulation could be a primary restriction to increasing complexity in bacterial genomes, an observation that concurs with Bird’s 1995 hypothesis [18], which proposes that increasing complexity is limited by the increasing logistical problems in distinguishing signal from noise. Other independent analyses of complete bacterial proteomes have given similar results although they used different approximations [19,20]. Increasing the genome complexity by adding a new gene implies combinatorial increases in nonfunctional or misfunctional interactions (noise) between the former proteins and the new protein. Therefore, it is reasonable to hypothesize that
Update
TRENDS in Genetics Vol.21 No.1 January 2005
(a)
23
3500
Number of ORFs
3000 2500 2000 1500 1000 500 10 500 0
0
2000
4000
6000
8000
10 000 12 000 14 000 16 000
Genome size
(b)
0.40
Marginal increment in ORFs
0.35 dR/dx = 1.656 * 4 10-4 X 0.656
0.30 0.25 0.20
dM/dx = 0.1723
0.15 0.01 0.05 4805 0
0
2000
4000
6000
8000
10 000 12 000 14 000 16 000
Genome size (c)
20 18 Percentage of species
16 14 12 10 8 6 4 2 0 9500–10 000
9000–9500
8500–9000
8000–8500
7500–8000
7000–7500
6500–7000
6000–6500
5500–6000
5000–5500
4500–5000
4000–4500
3500–4000
3000–3500
2500–3000
2000–2500
1500–2000
1000–1500
500–1000
0–500
Genome size classes TRENDS in Genetics
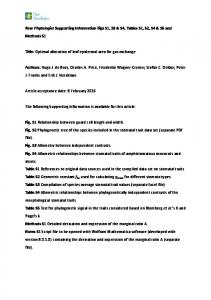
Figure 2. Optimum size determination and bacterial size distribution comparison. (a) The number of open reading frames (ORFs) (y axis) calculated from metabolic (black line) and regulatory (the line formed by the white circles) distribution models versus genome size (x axis). (b) The marginal increment of ORFs was (y axis) estimated from the derivatives of metabolic (black line) and regulatory (the line formed by the white circles) functions calculated as a function of the genome size (x axis). (c) The percentage of species (y axis) distributed in bacterial genome size classes (x axis). In this plot, the size distribution for the sample of 100 bacteria used in this article (white rectangles) is compared with the distribution of specialist species (broken line) [24], and compared with the distribution of the differences between the metabolic and regulatory functions for bacteria (blue rectangles; please note these differences correspond to the marked area in (a); they were normalized and given as percentages using the same y-axis of this figure) compared with generalist species (black line) [24].
www.sciencedirect.com
24
Update
TRENDS in Genetics Vol.21 No.1 January 2005
regulatory complexity might increase as a function of this combinatorial increase in gene expression noise. To offset this cost, a new metabolic enzyme only contributes revenue to the global cellular production by a linear increment. Bacterial factory model and optimum genome size It is interesting to draw an analogy between optimum bacterial complexity and the optimum production level, giving maximum profit, in a factory. In a factory the total profit is the difference between total revenue and total cost, and the marginal profit is the additional profit derived from the production of one additional unit. Consequently, the optimum size of a factory giving maximum total profit is reached at a production level where the marginal revenue from producing an additional unit is equal to its marginal cost. Above this point, the marginal cost to produce an additional unit is higher than its marginal revenue [21]. One major reason for the existence of an optimum size in these productive systems is the fact that any linear increment in production complexity is usually associated with a larger increment in the associated logistic cost [22,23]. This behaviour is clearly analogous to that associated with the universal size-dependent superfamilies in bacteria. An increase in metabolic complexity provides bacteria with new enzymes to exploit the environment, thus it is reasonable to equate metabolism with ‘bacteria factory revenue’, and the increasing regulatory system with the associated ‘logistical cost’. Although regulatory genes modulate enzyme expression, the ultimate benefit comes from what the enzymes produce, that is, their products. Moreover, the regulatory genes depend entirely on the products generated from the metabolic enzymes to replicate and express themselves. In this sense it is reasonable to consider the regulatory increment as a cost. When bacteria have stable substrate sources (e.g. endosymbionts), constant expression of the enzyme is the best strategy and the regulatory genes are lost, thereby reducing production costs. In changing environments (e.g. free-living bacteria) regulation of enzyme expression, by enabling efficient exploitation of a diverse environment, can sometimes give a reproductive advantage that offsets the costs of maintaining additional regulatory genes. We can compare the effect that an increase in genome complexity has on the marginal increases in metabolic and regulatory systems by calculating the derivatives of metabolism and regulation as a function of genome complexity (Figure 2b). The point at which these two marginal increments match (metabolism and regulation) identifies a statistical optimum for bacterial genome size (optimum size is 4800 ORFs; Figure 2b). In other words, this is a point at which ‘maximum profit’ is realized because bacteria get the maximum metabolic variability for minimal regulation cost. Interestingly, the size distributions given by the differences between metabolic and regulatory functions (the marked area in Figure 2a) show the same range and similar shape to that predicted for generalist species of bacteria [24] (Figure 2c). By contrast, the bacterial size distribution of the sample used in this work (Figure 2c) correlates better with specialist species [24]. Generalists www.sciencedirect.com
are defined as those species that can use multiple carbon and energy sources with few organic growth requirements in culture. The average number of genes in generalist bacteria has been estimated to be z4900 ORFs [24], a value close to the optimum size calculated in this work (Figure 2b). The similarity between the difference in distributions of metabolic and regulation superfamilies and the size distribution of generalist bacteria suggests that moving away from this optimum, in any direction, is unfavourable. Overall, these results clearly suggest that increasing complexity is not free of cost in bacteria; that is, the more complex a genome becomes the more difficult it is to manage. It is also clear that the incremental complexity in metabolism demands a comparatively lower increment in regulation complexity when the bacterial genome increases below the optimum point. When genome size exceeds this point any increase in metabolic genes demands a higher increase of regulatory genes. For example, the marginal regulatory increment to add one new gene is almost triple when the genome is 8000 ORFs compared with a genome of 2000 ORFs (0.25/0.1Z2.5; Figure 2b). This is true notwithstanding the fact that, in both cases, the absolute increasing complexity is the same (one gene), and that the same new genes could encode the same enzymes producing similar revenue per substrate molecule. The extra cost is due to the increased complexity in the larger genome. This power-law increase in complexity of the regulatory system presumably arises because of a combinatorial increase in the number of gene interactions that must be controlled as the number of metabolic genes increases [25]. In the larger, more complex genomes, these regulatory genes are essential for activating or inhibiting alternative pathways and processes in which these additional genes are operating. Because this regulatory cost increases more steeply than the linear increment in metabolic revenue it finally offsets any advantage gained by increasing the number of metabolic genes. Our analysis of the trends observed for the metabolic and regulatory functions suggests that bacteria achieve an optimum reproductive balance before the increasing regulatory complexity overburdens the cellular system. Conclusion As in a factory, production capacity depends, among other factors, on the technology applied. Eukaryotes apply additional technology to reduce gene expression noise, such as DNA methylation, nucleosomal chromatin or cellular compartmentalization [18]. However, in contrast to eukaryotic cells, bacteria have adopted an evolutionary strategy whereby speed in reproduction is a primary goal [1]. The size-dependent superfamilies analysed here clearly represent universal molecular technology shared by all prokaryotes to perform their metabolic and regulatory processes. Because the estimated optimum bacterial size calculated here corresponds well to the statistically most populated state in bacterial size distribution [24] (Figure 2b,c), this implies that all bacteria have used similar molecular technology to optimize their reproductive efficiency. They have achieved this efficiency by searching for a balance
Update
TRENDS in Genetics Vol.21 No.1 January 2005
between metabolic diversity and the associated regulatory cost that maximally exploits the environment while maintaining minimum cellular-doubling time. Acknowledgements We thank Florencio Pazos, Russell Marsden, Antonio Sillero, Chris Bennett and Alistair Coleman for discussion and helpful comments on the paper, and to Ami for her help in the inspiration of this work. The work was supported by grants from the MRC (A.G. and C.A.O.) and European Union (J.A.G.R.).
Supplementary data Supplementary data associated with this article can be found at doi:10.1016/j.tig.2004.11.014
References 1 Mira, A. et al. (2001) Deletional bias and the evolution of bacterial genomes. Trends Genet. 17, 589–596 2 Ochman, H. et al. (2000) Lateral gene transfer and the nature of bacterial innovation. Nature 405, 299–304 3 Koonin, E.V. et al. (2002) The structure of the protein universe and genome evolution. Nature 420, 218–223 4 Dobrindt, U. and Hacker, J. (2001) Whole genome plasticity in pathogenic bacteria. Curr. Opin. Microbiol. 4, 550–557 5 Moran, N.A. (2002) Microbial minimalism: genome reduction in bacterial pathogens. Cell 108, 583–586 6 Chothia, C. et al. (2003) Evolution of the protein repertoire. Science 300, 1701–1703 7 Kurland, C.G. et al. (2003) Horizontal gene transfer: a critical view. Proc. Natl. Acad. Sci. U. S. A. 100, 9658–9662 8 Jordan, I.K. et al. (2001) Lineage-specific gene expansions in bacterial and archaeal genomes. Genome Res. 11, 555–565 9 Ranea, J.A.G. et al. (2004) Evolution of protein superfamilies and bacterial genome size. J. Mol. Biol. 336, 871–887 10 Orengo, C.A. et al. (1997) CATH – a hierarchic classification of protein domain structures. Structure 5, 1093–1108
25
11 Kendall, M. and Gibbons, J.D. (1990) Rank Correlation Methods, 5th edn, Oxford University Press 12 Anscombe, J.F. (1973) Graphs in statistical analysis. Am. Stat. 27, 17–21 13 Atkinson, A.C. (1985) Plots, transformations, and regression: an introduction to graphical methods of diagnostic regression analysis, Oxford University Press 14 Apic, G. et al. (2001) Domain combinations in archaeal, eubacterial and eukaryotic proteomes. J. Mol. Biol. 310, 311–325 15 Hegyi, H. et al. (2002) Structural genomics analysis: characteristics of atypical, common, and horizontally transferred folds. Proteins 47, 126–141 16 Babu, M.M. and Teichmann, S.A. (2003) Evolution of transcription factors and the gene regulatory network in Escherichia coli. Nucleic Acids Res. 31, 1234–1244 17 Goudreau, P.N. and Stock, A.M. (1998) Signal transduction in bacteria: molecular mechanisms of stimulus-response coupling. Curr. Opin. Microbiol. 1, 160–169 18 Bird, A.P. (1995) Gene number, noise reduction and biological complexity. Trends Genet. 11, 94–100 19 Cases, I. et al. (2003) Transcription regulation and environmental adaptation in bacteria. Trends Microbiol. 11, 248–253 20 Nimwegen, E. (2003) Scaling laws in the functional content of genomes. Trends Genet. 19, 479–484 21 Mankiw, N.G. (1998) Principles of Microeconomics, 2nd edn, Dryden Press 22 Frizelle, G. (1998) The Management of Complexity in Manufacturing, Business Intelligence Press 23 Orr, H.A. (2000) Adaptation and the cost of complexity. Evolution Int. J. Org. Evolution 54, 13–20 24 de Bruijn, F.J. et al. (1998) Bacterial Genomes: Physical Structure and Analysis. Structure and Sizes of Genomes of the Archaea and Bacteria, Kluwer Academic Publishers 25 Park, J. et al. (2001) Mapping protein family interactions: intramolecular and intermolecular protein family interaction repertoires in the PDB and yeast. J. Mol. Biol. 307, 929–938
0168-9525/$ - see front matter Q 2004 Elsevier Ltd. All rights reserved. doi:10.1016/j.tig.2004.11.014
Relative rates of gene fusion and fission in multi-domain proteins Sarah K. Kummerfeld and Sarah A. Teichmann MRC Laboratory of Molecular Biology, Hills Road, Cambridge, UK, CB2 2QH
During evolution genes can produce more complex proteins by gene fusion or less complex proteins by gene fission. Considering proteins from 131 completely sequenced genomes from all three kingdoms of life, we identified 2869 groups of multi-domain proteins as a single protein in certain organisms and as two or more smaller proteins with equivalent domain architectures in other organisms. We found that fusion events are approximately four times more common than fission events, and we established that, in most cases, any
Corresponding author: Kummerfeld, S.K. (
[email protected]). Available online 24 November 2004 www.sciencedirect.com
particular fusion or fission event only occurred once during the course of evolution. The main mechanisms of gene evolution are duplication, recombination and sequence divergence. Recombination can result in proteins with new arrangements of domains, which are the evolutionary units of genes and proteins. Fusion and fission of genes are particular types of recombination, which result in one long composite protein in one organism or two or more smaller split proteins in another organism. An example is the multi-functional fatty acid synthase complex, which has two different polypeptide chains in yeast and mammals, but six chains in Escherichia coli.