Molecules 2014, 19, 7581-7609; doi:10.3390/molecules19067581 OPEN ACCESS
molecules ISSN 1420-3049 www.mdpi.com/journal/molecules Review
Microextraction Techniques Used in the Procedures for Determining Organomercury and Organotin Compounds in Environmental Samples Małgorzata Rutkowska, Kinga Dubalska, Piotr Konieczka and Jacek Namieśnik * Department of Analytical Chemistry, Faculty of Chemistry, Gdańsk University of Technology, G. Narutowicza 11/13 Street, 80-233 Gdańsk, Poland; E-Mails:
[email protected] (M.R.);
[email protected] (K.D.);
[email protected] (P.K.) * Author to whom correspondence should be addressed; E-Mail:
[email protected]; Tel.: +48-58-347-21-10. Received: 17 April 2014; in revised form: 20 May 2014 / Accepted: 30 May 2014 / Published: 6 June 2014
Abstract: Due to human activities, the concentrations of organometallic compounds in all parts of the environment have increased in recent decades. The toxicity and some biochemical properties of mercury and tin present in the environment depend on the concentration and chemical form of these two elements. The ever-increasing demand for determining compounds at very low concentration levels in samples with complex matrices requires the elimination of interfering substances, the reduction of the final extract volume, and analyte enrichment in order to employ a detection technique, which is characterised by high sensitivity at low limits of quantification. On the other hand, in accordance with current trends, the analytical procedures should aim at the miniaturisation and simplification of the sample preparation step. In the near future, more importance will be given to the fulfilment of the requirements of Green Chemistry and Green Analytical Chemistry in order to reduce the intensity of anthropogenic activities related to analytical laboratories. In this case, one can consider the use of solvent-free/solvent-less techniques for sample preparation and microextraction techniques, because the use of the latter leads to lowering the quantity of reagents used (including solvents) due to the reduction of the scale of analysis. This paper presents an overview of microextraction techniques (SPME and LPME) used in the procedures for determining different chemical forms of mercury and tin.
Molecules 2014, 19
7582
Keywords: green analytical chemistry; microextraction techniques; speciation; sample preparation; organometallic species; environmental samples; environmental analytics
List of abbreviations and acronyms Abbreviation Acronym LPME LLE HS-SDME SDME DLLME HF-LPME DI-SDME LLLME CFME ETV-ICP-MS CPE GC HPLC CE AS SPME SPE DI-SPME HS-SPME MS ICP HS-LPME LLLPME EME
Explanations Liquid-Phase Microextraction Liquid-Liquid Extraction Headspace Single-Drop Microextraction Single-Drop microextraction Dispersive Liquid-Liquid Microextraction Hollow-fibre liquid-phase microextraction Direct Immersion Single-Drop Microextraction Liquid-Liquid-Liquid Microextraction Continuous flow microextraction Electrothermal vaporisation Inductively Coupled Plasma Mass Spectrometry Cloud point extraction Gas Chromatography High-performance liquid chromatography Capillary Electrophoresis Atomic Spectroscopy Solid-Phase Microextraction Solid-Phase Extraction Direct Immersion Solid-Phase Microextraction Headspace Solid-Phase Microextraction Mass Spectrometry Inductively Coupled Plasma Headspace Liquid-Phase Microextraction Liquid–Liquid–Liquid-Phase Microextraction Electrokinetic membrane extraction
1. Introduction The strive for the accurate assessment of individual elements of the environment and processes occurring in them is the driving force for the development of appropriate analytical tools, which are necessary for obtaining reliable information. This concerns: • control and measuring devices, which ensure the possibility of analysing the prepared samples; • reference materials which accurately reflect the composition and character of the actual samples tested, which is necessary to ensure a proper system for the quality control and assurance of measurement results;
Molecules 2014, 19
7583
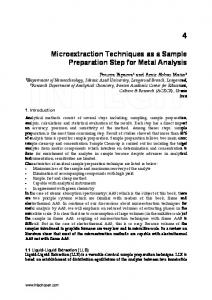
• analytical methodologies which can be used in testing environmental samples often characterised by a complex matrix composition and low, and sometimes very low, analyte content levels. In the latter case, the stage of preparing samples for analysis is a significant element of analytical procedures. Within this stage, three basic tasks are implemented: o increasing the level of analyte concentrations in the analysed samples to a higher level than the limit of detection of the analytical technique used; o removal of at least a part of interferents which can influence the result of the analysis; o replacement or at least simplification of the matrix composition of samples for analysis. At this stage, meeting the requirements of Green Chemistry and Green Analytical Chemistry will become more and more important to make it possible to decrease the intensity of the impact of anthropopresion connected with the operations of analytical laboratories. In this case, the following options can be considered: • the use of solvent-free/solvent-loss techniques for preparing samples for analysis; • the use of microextraction techniques which, due to a reduced scale of the analysis lead to a decrease in the quantity of reagents used, including solvents. This relatively broad introduction with a general description of the existing knowledge is appropriate also for organomercury and organotin compounds present in environmental samples. In this study, literature information on microextraction techniques (SPME, LPME) will be presented in procedures for the determination of various chemical forms of mercury and tin, their short description and possibility of using them in environmental research. 2. Analysis of Organomercury and Organotin Compounds Mercury and tin are considered to belong to the most toxic heavy metals due to their ability to accumulate, and their permanent character in individual elements of the environment [1]. In addition, these metals occur in the environment in many physical and chemical forms [2]. The sample preparation stage in the analytical procedure for determining organomercury and organotin compounds usually involves the extraction process, which leads to the isolation and enrichment of analytes from the samples. The enrichment process is necessary due to very low levels of the content of various forms of mercury and tin in environmental samples [3]. Figure 1 shows a diagram depicting the course of various procedures for determining organomercury and organotin compounds in which microextraction techniques are used at the stage of preparing samples for analysis. Extraction may differ in the selectivity level, the execution rate and convenience, and it does not only depend on the method and conditions, but also on the geometric configuration of the extraction phase [2]. 3. Analytical Procedures Using Microextraction Techniques for the Liquid Phase Classical liquid–liquid extraction (LLE) is one of the oldest techniques of enrichment and isolation in analytical chemistry and is still used in numerous analytical procedures [4]. However, while using the tedious and time-consuming LLE technique, large quantities of expensive and dangerous organic
Molecules 2014, 19
7584
solvents are used. As a result, the latest research trends include miniaturisation of the traditional liquid–liquid extraction system, which is mostly aimed at decreasing the volumetric ratio of the acceptor-to-donor phase. Table 1 presents information on the stages of development and improvement of the microextraction technique to the liquid phase. Figure 1. Diagram depicting the course of various procedures for determining organomercury and organotin compounds using microextraction techniques at the stage of preparing samples for analysis. Based on Oliveira, R. et al. [5].
At present, the LPME technique is used both for removing interferents, enriching analytes present in samples, and for the simplification of the composition of their matrix. The method of classification of various approaches in liquid-phase microextraction is presented in Figure 2.
Molecules 2014, 19
7585
Table 1. Stages of the development and improvement of the LPME technique [6]. Year 1995 1996 1997 1999 2001 2003 2005 2006 2007 2008 2009
Methodological Solution First single-drop-based extraction systems First drop-in-drop system Liquid stage microextraction in a dynamic system The use of microsyringe for supporting the drop Liquid-phase microextraction using fibre (LPME) Headspace Solid-Phase Microextraction (HS-SDME) Using ionic liquids as the extracting agent Using water as a solvent in liquid-phase microextraction Liquid-phase microextraction using ultrasound as a factor supporting the extraction process Liquid-phase microextraction using microwave radiation as a factor supporting the extraction process Automation of the single-drop microextraction process Combining microextraction to the liquid phase with flame atomic absorption spectroscopy Liquid-phase microextraction using an ionic liquid combined with dispensing a sample to the column using a thermal desorption device
Figure 2. Classification of various approaches in liquid-phase microextraction.
Liquid phase microextraction (LPME)
Headspace single drop microextraction (HS-SDME) Direct immersion single drop microextraction ( DI-SDME)
Single drop microextraction (SDME)
Three phases single drop microextraction (Three phases -SDME)
Dispersive liquid–liquid microextraction (DLLME)
Liquid liquid liquid microextraction (LLLME)
Hollow fiber liquid phase microextraction (HF-LPME)
Continuous flow microextraction (CFME)
Liquid-phase microextraction, in which the extraction solvent has the form of one drop, is called single-drop microextraction. In this technique, the use of an organic solvent is minimised to one drop (1–8 µL), which makes it exceptionally environmentally friendly [7–9]. The SDME method can be used for liquid and gaseous samples. This method is an appropriate strategy for enriching the matrix composition before detection and is regarded as the basic LLME technique, which is successfully used for the extraction of organomercury and organotin compounds, e.g., from water samples [10,11]. A single solvent or a mixture of solvents can be used for extraction to obtain higher selectivity. For metal ion extraction, chelating reagents dissolved in an organic solvent are used [12].
Molecules 2014, 19
7586
In the case of the SDME technique, it is the ability to keep a solvent drop at the end of the needle, which is immersed in the analysed sample (DI) or is placed on the headspace phase of the sample (HS). Figure 3 presents this solution in the form of a diagram. Xenobiotics are divided between the sample and the organic phase based on passive diffusion [13,14]. Figure 3. Diagram of a set for direct immersion single-drop microextraction (DI-SDME) and headspace single-drop microextraction (HSSDME). Based on Pena-Pereira, F. et al. [14].
In the case of the DI-SDME techniques, two liquid phases are in direct contact between each other, and the transfer of analytes from the water solution to the extraction drop lasts until thermodynamic balance is achieved or the extraction is stopped [11]. DI-SDME requires the use of a mixing organic solvent and analytes, which are characterised by higher solubility in the organic solvent than in the sample solution [11,13]. In the HS-SDME technique, gaseous analytes from the liquid phase, which are in the gaseous phase, dissolve in the solvent drop at the end of the microsyringe needle placed over the surface of the sample. After the extraction, lasting for a defined period of time, the microdrop is withdrawn back into the syringe needle and then it is injected to the detector or chromatograph for quantitative determination of analytes [11]. The methodological solutions described above should be treated as a static variant of this technique. Dynamic variants are also known and, in this case, a small liquid column which is in the syringe throughout the extraction is the drop [6]; the sample is then introduced into the syringe, where analytes are dissolved at the solvent phase.
Molecules 2014, 19
7587
Determining the different forms of mercury and tin in the water samples is troublesome due to the fact that the concentration of organometallic compounds in water is relatively low. Therefore, there is more and more information on the possibility of using the liquid–liquid–liquid microextraction technique (LLLE) to enrich analytes and purify extracts for the analysis of organomercury and compounds in water samples and other environmental samples. The LLLME technique uses three solutions—the donor solution, the organic solvent phase, which constitutes a specific organic membrane separating the two aqueous phases, and the acceptor solution [15–18]. In general, the principle of operation in this system can be presented in the following way: analytes are extracted from the starting solution to the organic solvent phase and then it is extracted again to drops of the acceptor aqueous solution suspended in an organic solvent, usually at the end of a syringe needle. A diagram of a set for performing tests using this technique is presented in Figure 4. (In this system, the analytes are extracted from the donor solution into the organic solvent phase and back-extracted simultaneously into the acceptor phase while stirring) [15,17–19]. Figure 4. A diagram of the set for liquid–liquid–liquid microextraction. Based on Pena-Pereira, F. et al. [14].
The liquid-liquid-liquid microextraction is becoming more and more popular as a technique for analyte enrichment and purification of samples containing organometallic compounds prior to analysis, in particular using capillary electrophoresis [15]. Literature contains information about numerous modifications which have been introduced into the LLLME system over the past several years. For example, the use of hollow-fibre liquid-liquid-liquid microextraction for the determination of organomercury compounds [16,20–22].
Molecules 2014, 19
7588
For instance various techniques of simple microextraction to the liquid phase were improved to eliminate some defects of the traditional installations. In 2000, the principles of the continuous-flow microextraction technique (CFME) were first described. In this technique, a drop of extractant solvent is introduced using a microsyringe into the extraction chamber so as to place it on the outlet tip of the PEEK tube. This tube is used as a kind of “holder” for a solvent drop and for filling the extraction chamber by pumping the sample through it in a continuous manner at a constant flow rate. As a result, the solvent drop placed at the end of the tube has continuous contact with the sample solution. At the end of the extraction process, the extract is collected using a microsyringe [23]. Figure 5 presents a diagram of the construction of the set for tests using the CFME technique. Figure 5. A diagram of a set for continuous flow microextraction [23].
The dispersive liquid–liquid microextraction (DLLME) is a relatively “young” extraction technique, developed in 2006 [3]. This technique was initially used for isolating and enriching organic compounds, such as polycyclic aromatic hydrocarbons (PAH), organophosphate pesticides and chlorobenzenes [24]. It was also used in procedures for determining organotin compounds and other inorganic compounds. The DLLME technique is based on the use of a triple solvent system, just like in homogeneous liquid-liquid extraction (LLE) and cloud point extraction (CPE). Dispersive liquid-liquid microextraction consists of two stages (Figure 6): (a) The introduction of an appropriate extraction and dispersing solvent mixture into an aqueous solution of an analyte-containing sample. The quantity of the extraction solvent used is usually approx. 1%–3% of the total mixture volume of various extraction solvents. At this stage, the extraction solvent is dispersed in the aqueous sample in the form of fine drops, in which analytes are enriched. At this stage, the solution becomes
Molecules 2014, 19
7589
cloudy [13]. The state of balance is achieved quickly due to the large surface area between the extraction solvent and the aqueous sample solvent so that the extraction hardly depends on time. (b) Centrifugation of the cloudy solution. After the completion of the microextraction process, centrifugation is a necessary step to separate the extracting agent phase. The enriched extracting agent phase is used to determine the required analytes using conventional analytical techniques [6,13]. Figure 6. A diagram presenting consecutive stages of dispersive liquid–liquid microextraction. Based on Pena-Pereira, F. et al. [6].
The organic solvent is used on the basis of its density, which should be higher than the density of water, the extraction ability towards the analytes and compatibility with the chromatographic system used. Usually, these are: chlorobenzene, chloroform, carbon tetrachloride or tetrachloroethylene. The dispersing solvent must mix with water and the polar solvent. Acetone, methanol and acetonitrile are usually used as dispersing solvents [11,13]. At present, this technique is mostly used for analysing simple water samples and for preliminary tests. An additional purification stage would be required for samples characterised by a complex matrix composition [11,13]. Single-drop microextraction, apart from numerous significant advantages, has a disadvantage connected with the risk of destroying the drop. As a result, by modifying microextraction techniques to the liquid phase, changes were introduced, which involved immobilisation of the extracting liquid in a porous fibre drain, which was used in Hollow-fibre liquid-phase microextraction (HF-LPME) [12].
Molecules 2014, 19
7590
This is extraction in the liquid–liquid system, where the extracting liquid is situated in the spaces of a porous fibre fixed at the tips of two needles (Figure 7, right-hand side) or at the end of one microsyringe needle (Figure 7, left hand side). Before the commencement of the extraction process, the capillary fibre is immersed in an organic solvent to “keep” the organic solvent in the pores of the capillary fibre. The capillary fibre is then immersed in the sample solution. To accelerate the extraction, the sample is intensively shaken or mixed. After the completed extraction, the extract is drawn into a syringe from the capillary tube. Figure 7. A diagram of the structure of a set for hollow-fibre liquid phase microextraction (HF-LPME). Based on Pena-Pereira, F. et al. [6].
This technique gives the possibility of ensuring high repeatability and high selectivity of the extraction process due to the possibility of using a broad spectrum of appropriate extracting liquid and the type of porous fibre. Apart from protecting the extracting liquid, the fine pores of the fibre prevent weight materials from getting into it, which is desirable especially in the analysis of biological liquids. The extraction process using the HF-LPME technique can be performed both in two-phase and three-phase systems [25]. In two-phase systems, the acceptor solution is the same organic solution which was immobilised in the pores, while analytes are collected in the organic phase, which is compatible with the GC [26]. In three-phase systems, however, the acceptor solution is another aqueous phase and analytes are extracted from the aqueous sample solution into a water acceptor solution through a thin layer of organic solvent. This is an excellent solution when combined with the HPLC, CE and AS technique, at the analyte separation and determination stage [11,13,26]. Examples of applying these techniques for the liquid phase microextraction in combination with various separation techniques in organometallic compounds determination procedures are summarised in Table 2.
Molecules 2014, 19
7591
Table 2. Examples of application of selected microextraction techniques for analyte sampling before the determination of various forms of tin and mercury. Fiber/Extraction Time/Extraction Mode Sample Type
Species
Method
Derivatization
Or Extractant Phase/Drop Volume
Detection
(µL)/Sample Volume (mL)/Extraction
Technique
E.F.
Precision
Detection
(RSD %)
Limit
Reference
Time (min)/Stirring Rate (Flow Rate) Gas condensate Water, fish tissue
Met2-Hg
SPME
None (direct sampling)
100 µm PDMS/30 s/HS
MIP-AES
-
-
20 µg/L
[27]
MetHg
SPME
NaBEt4/acetate buffer pH 4.5
100 µm PDMS/5 min/HS
AFS
-
-
3.0 ng/L
[28]
TeMT Water, seawater
TMT DMT
41 ng/L SPME
NaBEt4/acetic acid buffer pH 4
100 µm PDMS/20 min/HS
FPD
-
-
MMT Surface water,
Alkylmercury
sediment
Alkyltin DBT TBT
8.4 ng/L
SPME
NaBEt4/acetate buffer pH 5.0
100 µm PDMS/10 min/HS
ICP-MS
-
-
3.7 ng/L 0.38–1.2 ng/L
SPME
NaBEt4/acetate buffer pH 5.3
100 µm PDMS/10 min/HS
ICP-MS
-
-
2.1 ng/L 1.1 ng/L 4.3 ng/L
MBT
0.031 ng/L
DBT
0.007 ng/L
TBT
sewage sludge
MPhT
[30]
0.34 ng/L
MetHg
Sediment,
[29]
8.6 ng/L
MBT Sediment
15 ng/L
SPME
NaBEt4/ethanoic acid buffer pH 4.8
100 µm PDMS/60 min/LPh
FPD
-
-
0.006 ng/L 0.114 ng/L
DPhT
0.167 ng/L
TPhT
0.583 ng/L
[27,31]
[32]
MBT Slurry of
DBT
sediment
TBT TeBT
SPME
NaBEt4/acidified with HCl
100 µm PDMS/45 min/LPh
MIP-AES
-
-
µg/L range
[33]
Molecules 2014, 19
7592 Table 2. Cont. Fiber/Extraction Time/Extraction Mode
Sample Type
Species
Method
Derivatization
Or Extractant Phase/Drop Volume
Detection
(µL)/Sample Volume (mL)/Extraction
Technique
Precision
Detection
(RSD %)
Limit
-
-
Not reported
[27]
-
-
3.5 µg/L
[27]
E.F.
Reference
Time (min)/Stirring Rate (Flow Rate) MetHg Soil
EtHg
SPME
PhenHg Soil Environmental, sediment
Body fluids
Urine Biological samples, sediments
Et2-Hg Met2-Hg
SPME
Hydride generation
Fused-silica fiber (pretreated with conc.
(KBH4)/acetate buffer pH 4
HF acid for 3.5–4 h)/1.5–2 h/HS
None (direct sampling)
100 µm PDMS/20 min/HS
AAS (quartz tube) MIP-AES
10 µg/L
MBT DBT
SPME
NaBEt4/acetate buffer pH 4
100 µm PDMS/60 min/HS
FID
-
-
1.2 µg/L
TBT
0.9 µg/L
MBT
9 ng/L
DBT
13 ng/L
TBT
SPME
NaBEt4/acetate buffer pH 5.3
100 µm PDMS/10 min/HS
EI-MS-MS
-
-
9 ng/L
MetHg
22 ng/L
Hg2+
18 ng/L
MetHg Hg
2+
MetHg
SPME
SPME
NaBEt4/buffer pH 4
100 µm PDMS/15 min/HS
Hydride generation
Fused-silica fiber (pretreated with conc.
(KBH4)/acetate buffer pH 3
HF acid for 3.5–4 h)/1.5–2 h/HS
EI-MS
303 ng/L
[27]
[34]
-
-
-
-
Not reported
[27]
-
-
0.02
[36]
93 ng/L
[35]
AAS (quartz tube)
Seawater samples, Sediment sample, Biological samples (fish, crab, prawn)
MeHg
SPME
Na[B(C6H5)4]/acetate buffer pH = 4.5
100 µm PDMS/15 min
GC-MS
Molecules 2014, 19
7593 Table 2. Cont. Fiber/Extraction Time/Extraction Mode
Sample Type
Species
Method
Derivatization
Or Extractant Phase/Drop Volume
Detection
(µL)/Sample Volume (mL)/Extraction
Technique
E.F.
Precision
Detection
(RSD %)
Limit
Reference
Time (min)/Stirring Rate (Flow Rate) Aqueous samples
NaBEt4 (in situ)/ammonia/citrate
Organotin HS-SPME Organomercury
MetHg Hg
MBT, DBT,
sediments
TBT
Estuarine superficial sediment
HS-SPME
2+
Marine
MBT, DBT, TBT
NaBEt4 (in situ)/ammonia/citrate buffer pH 5
MBT, TBT, Natural water
buffer pH 8.5
HS-SPME
HS-SPME
2% NaBEt4/0.2 M acetic acid and 0.2 M sodium acetate/pH 5.5 NaBEt4 (in situ) NaBEt4/1.5 M sodium acetate Buffer/pH 4.3
100 mm PDMS
pg/L
GC-AED
-
-
PDMS/30 min
GC-EI-MS
-
-
PDMS
GC-MS
-
-
730–969 pg/g
[37,39,40]
100 mm PDMS/15 min
GC-FID
-
-
-
[37,39,41]
CW/PDMS
ng/L
below ng/L or sub ng/L
[37,38]
[38,39]
TMT, DMT, Biological
MMT, MBT,
materials and
DBT, TBT
road dust
MetHg Hg
PDMS/DVB HS-SPME
CAR/PDMS
2+
DMT, MMT, MetHg Hg2+
ICP-TOFMS
below pg/g -
1.3 pg/g 5
PDMS µm HS-SPME
NaBEt4/buffer pH 5.3
[37,42] 2 pg/g
CAR/PDMS
TMT, Natural water
MC-GC-
3 GC-MS
-
20
DVB/CAR/PDMS 50 µm/30 µm/
14
30 min/5 mL
20
level ng/L
[39]
Molecules 2014, 19
7594 Table 2. Cont. Fiber/Extraction Time/Extraction Mode
Sample Type
Species
Method
Derivatization
Or Extractant Phase/Drop Volume
Detection
(µL)/Sample Volume (mL)/Extraction
Technique
E.F.
Precision
Detection
(RSD %)
Limit
Reference
Time (min)/Stirring Rate (Flow Rate) Water samples
100 µm PDMS/or
MeHg DBT
HS-SPME
NaBEt4
MetHg
samples
Hg2+
GC-MS
DI-SPME
-
PDMS
MMT
GC-MS
-
ETAAS
28/18
DMT
28/20
TMT
90/161
MBT
12/14
DBT
Water Water
TPT
SDME
-
[C4MIM][PF6]/[C8MIM][PF6]/5/10/15 (30)/-
32/24 35/28
MetHg
5/4
EtHg
15/13
PhenHg
40/27
Met2-Hg
15/7
Et2-Hg
32/14
Sn Hg
3 ng/L 7 ng/L
20
16.8 ng/L
-
-
[43]
-
-
[44]
[39]
15/23
Dioctyltin
Hg
5 14
10/11 CV-AFS
TBT -
-
30 min for MeHg/60 min for DBT and TBT
TBT
Aqueous
50 µm/30 µm DVB/CAR/PDMS
SDME SDME
NaBH4 in the sample; Pd(II) in the drop H2Dz in the drop
Pd(II)/3/5/3.5/1000 rpm m-Xylene containing H2Dz/ 10/ 15/20/300 rpm
ETAAS
72
8.7
800
37
8.2
90
970
6.1
10 ng/L
[45] [46]
Molecules 2014, 19
7595 Table 2. Cont. Fiber/Extraction Time/Extraction Mode
Sample Type
Species
Method
Derivatization
Or Extractant Phase/Drop Volume
Detection
(µL)/Sample Volume (mL)/Extraction
Technique
E.F.
Precision
Detection
(RSD %)
Limit
5000
Reference
Time (min)/Stirring Rate (Flow Rate) Tuna fish and dogfish muscle -
MetHg
SDME
Organotin
HS-SDME
NaBH4 in the sample;
Pd(II)/3/5/3/300 rpm
ETAAS
40
7
-
Decane/11 min
GC-MS
-
3.6
HS-SDME
-
Decane/11 min
GC-MS
-
3.6
3 ng/L
[10,11]
HS-SDME
-
Decane/5 min
-
4.4–10.1
0.8–1.8 ng/L
[11]
-
-
[14] [14]
Pd(II) in the drop
TBT: 3 (Sn) ng/L
[47] [11,14]
MBT Sediment CRM
DBT
Biological,
MBT
environmental
DBT
samples
TBT
-
Organomercury
D-SDME
-
[C4MIM][PF6]/15 min
CVAAS
5–40
-
Organotin
D-SDME
-
[C4MIM][PF6]/15 min
ETAAS
10–90
-
-
140
11
0.36 ng/
2.9
10
l 2.9 ng/L
970
6.1
10 ng/L
107
5.3
11.0 ng/L
31
3.7
1.6 ng/L
11
9.4
7.1 ng/L
3
11.6
22.8 ng/L
825–1036
2.3–5.9
0.2–1 ng/L
17
1.7 ng/L
15
2.5 ng/L
9
5.9 ng/L
TBT
River water
TBT TPT Hg
GC-ICPMS
D-SDME
-
α,α,α,-Trifluorotoluene/60 min
GC-MS-MS
D-SDME
-
Xylene/20 min
ETAAS
MetHg Water samples
EtHg PhenHg
D-SDME
-
[C4MIM][PF6]/20 min
HPLC
Hg+ -
Organotin
DLLME
MBT Water samples
DBT TBT
DLLME
butyltin compounds aqueous solution pH = 4.5/NaBEt4
Tetrachloromethane, ethanol/