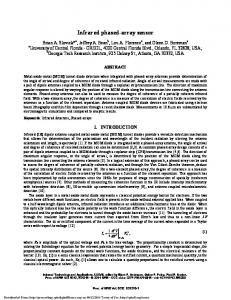
APPLIED PHYSICS LETTERS 90, 174102 共2007兲
Microfabricated tuning fork temperature and infrared sensor Francis Tsow and Nongjian Taoa兲 Department of Electrical Engineering, Arizona State University, Tempe, Arizona 85287 and Center for Solid State Electronics Research, Arizona State University, Tempe, Arizona 85287
共Received 20 February 2007; accepted 24 March 2007; published online 23 April 2007兲 The authors demonstrated a microfabricated tuning fork temperature/infrared sensor with noise equivalent temperature difference 共NETD兲 of 0.5 mK at 20 ° C and with a thermal limited noise level of 5 ° C. The sensor raw material can cost less than 10 cents each and has a time constant of approximately 50 ms. The sensitivity of infrared signal can potentially be further improved and optimized by selecting polymer materials with a proper thermal response. © 2007 American Institute of Physics. 关DOI: 10.1063/1.2731313兴 Temperature/infrared detectors can be categorized as quantum or thermal detectors. Among various thermal detectors, thermistor has been commonly used as a cost effective uncooled sensor. Other uncooled sensors include bolometer, pyroelectric meter, thermoelectric meter, thermopiles, Golay cells, superconductors, and microcantilevers.1–8 A 10 k⍀ thermistor together with a Wheatstone bridge can potentially give a sensitivity of ⬃10−4 K if a stable or corrected bias and ideal electronic components are available. A piezoresistive microcantilever infrared sensor has been reported with a temperature sensitivity of 10−5 K, but the reported theoretical temperature sensitivity has not been demonstrated experimentally.4 One way to measure infrared is to measure the heating effect of the infrared signals.1,3,4,6,7 As such, a temperature sensor can also be used as an infrared detector. Infrared detection has many applications including temperature measurement 共especially at high temperature and/or noncontact measurements兲,9 calorimeters, night vision,7 electrical equipment hot spot identification 共where the location of the vulnerable electronics can be identified兲,10 etc. Datskos and co-workers,6–8,11 and Perazzo et al.12 have demonstrated its application in imaging. Datskos and co-workers1,12 and Gimzewski and co-workers13–15 have demonstrated its chemical and biological applications. This letter proposes an uncooled low cost sensitive temperature sensor based on a mechanical resonator. The mechanical resonator used is a common commercially available quartz tuning fork modified with a polymer wire.16–18 The role of the polymer wire is to provide an infrared/ temperature sensitive element to the otherwise relatively temperature insensitive tuning fork 关Fig. 1共a兲兴.19 As the polymer wire is heated up, the stiffness of the wire changes, resulting in a change in the effective spring constant of the tuning fork sensor, giving rise to a change in resonant frequency.
f k . = 冑 T km T
共1兲
To turn commercially available canned tuning forks into temperature/infrared sensors, we modified them by opening the can, placing drops of dissolved polymer solution onto the two prongs of the tuning forks and pulling a polymer wire a兲
Electronic mail:
[email protected]
from one prong to an other with a needle as the polymer dries up.16–18 Modeling the tuning fork system as a RLC circuit gives R ⬃ 60 k⍀, L ⬃ 400 H, and C ⬃ 60 fF. Our measurement setup give us a current to voltage gain,20 Zgain =
Rg
冑1 + 共2 fRgCg兲2 = 0.6 M⍀,
共2兲
where Rg ⬃ 570 k⍀ and Cg ⬃ 0.59 pF. Thermal noise is given by 2 = 4kBTR Vrms
冉 冊冉 冊 Zgain R
2
Vrms ⬃ 2 V共typical兲,
fo , 2Q 共3兲
where T is temperature in kelvin. Often, in our experiments, other noise sources such as ambient temperature variations and polymer wire relaxation dominate. At this point, other than externally controlling the ambient temperature and filtering, we do not have a scheme to easily reduce noise due to ambient temperature fluctuations.2 Nevertheless, thermal noise figures show the lowest achievable limit of our device, given an ideal setup barring any other noise sources. Our setup is similar to the one used in Ref. 9 and is shown schematically in Fig. 1共b兲. We measured the frequency shift of the tuning fork sensor as a result of temperature change by fixing the driving frequency of the tuning fork and measuring the change in the output amplitude as the resonant frequency shifts.21 For a typical polymer wire modified tuning fork temperature sensor, with a typical slope of 0.02 n.a./ Hz 共n.a.—normalized amplitude, normalized by resonant peak amplitude兲, we obtained a temperature sensitivity of 10 Hz/ ° C. With typical normalized noise amplitude of 1 n.a., we get a typical theoretical temperature uncertainty due to thermal noise of 50 ° C. Not only is sensitivity important for a sensor; response time is also important. Assuming heat being dissipated only through the ends of the wire, thermal relaxation time is given by3
=
l 2 C ,
共4兲
where is the thermal relaxation time, l is the length, is the density, C is the specific heat, and is the heat transfer coefficient of the polymer wire used.
0003-6951/2007/90共17兲/174102/3/$23.00 90, 174102-1 © 2007 American Institute of Physics Downloaded 10 Jan 2008 to 129.219.244.213. Redistribution subject to AIP license or copyright; see http://apl.aip.org/apl/copyright.jsp
174102-2
F. Tsow and N. Tao
FIG. 1. 共Color online兲 共a兲 Frequency spectrum for a bare tuning fork 共unmodified with the can removed兲 and a polystyrene/SC-F105 copolymer 共90% to 10% by mass兲 wire modified tuning fork. The black curve is before heating and the red curve is after heating. There were a 1.68 Hz shift in resonant frequency for the copolymer wire modified tuning fork and only a 0.06 Hz shift for the bare tuning fork. 共b兲 Cartoon showing temperature/ infrared sensor setup. 共c兲 N-IPAA wire modified tuning fork temperature calibration 共slope= 5.5 ° C/normalized amplitude兲. The sensor has a frequency to temperature sensitivity of 10 Hz/ ° C.
Since the distance between the two prongs is 250 m, the length of the polymer wire bridging the gap is also 250 m. In one of our temperature sensors, a 9:1 mixture by mass of polystyrene and SC-F105 共Seacoast Science, Inc.兲 was used. If we use the properties of polystrene, we get = 0.5 s, which is much longer than the measured 50 ms, suggesting that heat was not only dissipated through the length of the polymer wire but instead through an even more dominant mechanism. We believe that most of the heat was dissipated through air, which would only require heat within the wire to travel a shorter distance across its radial thickness. To demonstrate the temperature sensor that we are proposing, we first tested the electronic circuit to make sure the electronic circuit was not limiting the performance of the temperature sensor. With a commercial tuning fork connected to the input of the transconductance amplifier and the output of the lock-in amplifier monitored with a spectrum analyzer, a signal right at the resonant frequency of the tuning fork was clearly observed; it was missing when the input of the transconductance amplifier was grounded. This shows that the electronics we used was good enough to allow us to measure beyond the noise level of the tuning fork. We placed the tuning fork temperature/infrared sensor together with a thermistor inside an enclosed container and monitored the output amplitude versus temperature 关Figs. 1共a兲 and 1共c兲兴 to calibrate the sensor. The sensor’s spectral response was also measured to obtain a slope to correlate sensor amplitude changes to resonant frequency changes 关Fig. 2共a兲兴. Among the three polymers that we tried—polystyrene 共PS兲 and hyperbranched fluoroalcohol polycarbosilanes 共SC-F105兲 mixture 共90% to 10% by mass兲, poly共N-isopropylacrylamide兲 共N-IPAA兲, 共Ref. 22兲 and polyvinylchloride—N-IPAA has the highest temperature sensitivity at 10 Hz/ ° C. We have also demonstrated the proposed sensor as a temperature/infrared sensor using a 635 nm laser, a pulsed resistive heater, and a soldering iron. A 635 nm red laser was located 4 cm away from the sensor with the laser beam aiming at the PS+ SC-F105 polymer wire through a slit. It is obvious from the data that
Appl. Phys. Lett. 90, 174102 共2007兲
FIG. 2. 共Color online兲 共a兲 N-IPAA wire modified tuning fork spectral response 共black curve兲. The red curve 共sensitivity: 0.02 normalized amplitude/ Hz兲 is the first derivative of the response. 共b兲 PS+ SC-F105 wire modified sensor response to 635 nm 共black curve兲. The red curve is the laser control voltage pulse. The laser was 4 cm away from the sensor. 共c兲 The heater control pulse width to temperature shift calibration. The heater was 3 mm away from the heater with a control pulse of 2 V. The red line is a linear fitting curve. 共d兲 Pulse width at 20 ms 共green curve, obvious response兲, 5 ms 共red curve, close to the detection limit of the experimental setup兲, and 0.5 ms 共black curve, control兲. The blue curve is the heater control voltage pulse.
关Fig. 2共b兲兴 the laser had led to a sensor response. The polymer wire on the sensor was estimated to be approximately 1 m in diameter and 250 m long. Assuming polystyrene properties for the polymer used in this experiment, we estimated the absorbed laser power to be approximately 1.1 nW. We then moved the laser 6 cm away from the sensor, resulting in a bigger spot size, to reduce the power reaching the polymer. We estimated the laser power absorbed by the polymer wire to be approximately 0.8 nW. Given the thermal noise as the only noise source, a theoretical limit of 1.3 pW is possible. For the next experiment, a resistive heater was pulsed with voltage pulses controlled by a power transistor, which is, in turn, controlled by a function generator. A PS+ SC-F105 wire modified tuning fork sensor was used. Various pulse widths and temperature shifts were calibrated to prepare for this experiment 关Fig. 2共c兲兴. The heater was then placed 3 cm away from the sensor, and the voltage pulse used was set at 2 V for the experiment 关Fig. 2共d兲兴. A sensor response can be clearly seen with a heater pulse width of 20 ms, even with a 5 ms pulse width 关Fig. 2共d兲兴. With 0.5 ms pulse width, it is not so obvious and can be used as a control 关Fig. 2共d兲兴. Tuning fork responses for different pulse widths plotted in Fig. 2共d兲 are quite different, suggesting that our sensor can detect a pulse width of at least 5 ms. Using the calibration plot 关Fig. 2共c兲兴, 5 ms corresponds to 0.5 m ° C. If we again assume properties of polystyrene for the polymer wire, this would mean our temperature/infrared sensor has demonstrated detection of an absorbed power as low as 130 pW and with a noise equivalent temperature difference 共NETD兲 of 0.5 mK at 20 ° C. A small piece of glass was also placed on top of the heater, blocking/slowing down temperature responses, but would have allowed electromagnetic waves to pass through, to confirm that the tuning fork sensor was detecting temperature change but not merely the transient response of the electronics used 关Fig. 3共a兲兴.
Downloaded 10 Jan 2008 to 129.219.244.213. Redistribution subject to AIP license or copyright; see http://apl.aip.org/apl/copyright.jsp
174102-3
Appl. Phys. Lett. 90, 174102 共2007兲
F. Tsow and N. Tao
modified manually and the thickness of the wire can vary, requiring individual calibration. Due to high sensitivity of the tuning fork, ambient noise sources such as pressure and temperature fluctuations have to be well controlled in order to achieve the aforementioned sensitivity. In contrast to the microcantilever approach, commercially available tuning forks are in the millimeter scale, limiting the packing ability into an array without the use of optics or microfabrication techniques.
FIG. 3. 共Color online兲 共a兲 Responses with 共black curve兲 and without 共red curve兲 glass pieces. The blue curve is the heater control voltage pulse at 2 ms pulse width. 共b兲 Sensor response to 98 ° C soldering iron at 25 cm away. 共c兲 Sensor response to 110 ° C soldering iron 25 cm away.
Lastly, a soldering iron at 98 and 110 ° C was placed at various distances from a N-IPAA modified tuning fork sensor. The sensor was placed inside a water jug to allow infrared signal to get through, but reducing visible light and shielding the sensor from air current and fast thermal fluctuations. A sheet of paper was used to block infrared radiation from the soldering iron from reaching the sensor in approximately 5 s intervals. Responses of the sensor 25 cm away from the soldering iron are plotted in Figs. 3共b兲 and 3共c兲. Responses due to the 110 ° C soldering iron are clearly larger than those due to the 98 ° C. In fact, it is quite a few times larger than what we would expect for a mere 12 ° C temperature difference. Wavelength, which depends on temperature, dependent absorptions due to air/water jug material along with other noise sources such as soldering iron temperature fluctuations are some of the possible reasons for this discrepancy. Plots of temperature shifts versus distance indicate that temperature shifts as measured by the sensor were inversely proportional to distance squared, as one would expect. We have demonstrated a sensitive low cost temperature/ infrared sensor with NETD of 0.5 mK at 20 ° C, a thermal limited noise level of 5 ° C, and a time constant of approximately 50 ms. Commercially available tuning forks have found applications in trace level chemical applications due to its stability, high sensitivity, and low cost.16,18,23,24 Temperature/infrared sensors have been employed in applications such as chemical and biological detection/ spectrometry, as different species give different response signatures over different infrared wavelengths.1,11,13–15 The proposed temperature/infrared tuning fork sensor appears to have the sensitivity, stability, and promising thermal response to be applied in various infrared detection applications. Nevertheless, currently, each tuning fork sensor is
The authors would like to thank Erica Forzani for her help in various ways, Su Lin for her help in making various laser measurements along with plenty helpful discussions, Peiming Zhang for letting us use the FTIR machine in addition to useful discussions, and DOE 共DE-FG03-01ER 45943兲 for financial support. 1
E. T. Arakawa, N. V. Lavrik, S. Rajic, and P. G. Datskos, Ultramicroscopy 97, 459 共2003兲. 2 J. L. Corbeil, N. V. Lavrik, S. Rajic, and P. G. Datskos, Appl. Phys. Lett. 81, 1306 共2002兲. 3 P. G. Datskos, N. V. Lavrik, and S. Rajic, Rev. Sci. Instrum. 75, 1134 共2004兲. 4 P. G. Datskos, P. I. Oden, T. Thundat, E. A. Wachter, R. J. Warmack, and S. R. Hunter, Appl. Phys. Lett. 69, 2986 共1996兲. 5 P. G. Datskos, S. Rajic, and I. Datskou, Appl. Phys. Lett. 73, 2319 共1998兲. 6 D. Grbovic, N. V. Lavrik, P. G. Datskos, D. Forrai, E. Nelson, J. Devitt, and B. McIntyre, Appl. Phys. Lett. 89, 073118 共2006兲. 7 P. I. Oden, P. G. Datskos, T. Thundat, and R. J. Warmack, Appl. Phys. Lett. 69, 3277 共1996兲. 8 L. R. Senesac, J. L. Corbeil, S. Rajic, N. V. Lavrik, and P. G. Datskos, Ultramicroscopy 97, 451 共2003兲. 9 C. W. Mahnke, J. A. Soucheck, and N. F. Insalata, Appl. Microbiol. 26, 646 共1973兲. 10 C. W. Brice, Electr. Power Syst. Res. 1, 127 共1978兲. 11 P. G. Datskos, M. J. Sepaniak, C. A. Tipple, and N. Lavrik, Sens. Actuators B 76, 393 共2001兲. 12 T. Perazzo, M. Mao, O. Kwon, A. Majumdar, J. B. Varesi, and P. Norton, Appl. Phys. Lett. 74, 3567 共1999兲. 13 J. R. Barnes, R. J. Stephenson, M. E. Welland, C. Gerber, and J. K. Gimzewski, Nature 共London兲 372, 79 共1994兲. 14 P. G. Datskos, S. Rajic, M. J. Sepaniak, N. Lavrik, C. A. Tipple, L. R. Senesac, and I. Datskou, J. Vac. Sci. Technol. B 19, 1173 共2001兲. 15 J. K. Gimzewski, C. Gerber, E. Meyer, and R. R. Schlittler, Chem. Phys. Lett. 217, 589 共1994兲. 16 S. Boussaad and N. J. Tao, Nano Lett. 3, 1173 共2003兲. 17 S. A. Harfenist, S. D. Cambron, E. W. Nelson, S. M. Berry, A. W. Isham, M. M. Crain, K. M. Walsh, R. S. Keynton, and R. W. Cohn, Nano Lett. 4, 1931 共2004兲. 18 M. H. Ren, E. S. Forzani, and N. J. Tao, Anal. Chem. 77, 2700 共2005兲. 19 F. J. Giessibl, Rev. Mod. Phys. 75, 949 共2003兲. 20 R. D. Grober, J. Acimovic, J. Schuck, D. Hessman, P. J. Kindlemann, J. Hespanha, A. S. Morse, K. Karrai, I. Tiemann, and S. Manus, Rev. Sci. Instrum. 71, 2776 共2000兲. 21 T. R. Albrecht, P. Grutter, D. Horne, and D. Rugar, Appl. Phys. Lett. 69, 668 共1991兲. 22 G. H. Chen and A. S. Hoffman, Nature 共London兲 373, 49 共1995兲. 23 A. A. Kosterev, Y. A. Bakhirkin, R. F. Curl, and F. K. Tittel, Opt. Lett. 27, 1902 共2002兲. 24 A. A. Kosterev, F. K. Tittel, D. V. Serebryakov, A. L. Malinovsky, and I. V. Morozov, Rev. Sci. Instrum. 76, 043105 共2005兲.
Downloaded 10 Jan 2008 to 129.219.244.213. Redistribution subject to AIP license or copyright; see http://apl.aip.org/apl/copyright.jsp