TSina in detail, we reveal that different from ordinary social networks, the degree ... platform and provides a new means of communication, with which users can ..... the links of the original network are iteratively added to produce the largest.
Microgroup Mining on TSina via Network Structure and User Attribute Xiaobing Xiong1,2 , Xiang Niu2 , Gang Zhou1 , Ke Xu2 , and Yongzhong Huang1 1
2
National Digital Switching System Engineering and Technological Research Center, China State Key Lab of Software Development Environment, Beihang University, China {bingxiaoxiong,niuxiang,gzhougzhou,kexu999,yzhongyzhongh}@gmail.com
Abstract. In this paper, we focus on the problem of community detection on TSina: the most popular microblogging network in China. By characterizing the structure and content of microgroup (community) on TSina in detail, we reveal that different from ordinary social networks, the degree assortativity coefficients are negative on most microgroups. In addition, we find that users from the same microgroup likely exhibit some similar attributes (e.g., sharing many followers, tags and topics). Inspired by these new findings, we propose a united method for microgroup detection without losing the information of link structure and user attribute. First, the link direction is converted to the weight by giving higher value to the more surprising link, while attribute similarity between two users is measured by the Jaccard coefficient of common features like followers, tags, and topics. Then, above two factors are uniformly converted to the edge weight of a newly generated network. Finally, many frequently used community detection algorithms that support weighted network would be employed. Extensive experiments on real social networks show that the factors of link structure and user attribute play almost equally important roles in microgroup detection on TSina. Our newly proposed method significantly outperforms the traditional methods with average accuracy being improved by 25%, and the number of unrecognized users decreasing by about 75%. Keywords: Microblogging, Microgroup Mining, Community Detection, United Method.
1
Introduction
In recent years, the microblogging system has emerged as a novel social media platform and provides a new means of communication, with which users can broadcast brief updates about any things happening in their daily life or work activities, such as what they are doing, watching, or thinking about. As we all know, the most famous microblogging system in the world is Twitter, while Sina microblogging (TSina) is the most famous one in China, which began in Aug. 2009 and has gained more than 100 million users until Apr. 2011. J. Tang et al. (Eds.): ADMA 2011, Part II, LNAI 7121, pp. 138–151, 2011. c Springer-Verlag Berlin Heidelberg 2011 �
Microgroup Mining on TSina via Network Structure and User Attribute
139
TSina introduced a new application named Microgroup in Nov. 2010. A microgroup is usually a group of users who have close connections or share similar interests. The number of microgroups is growing rapidly, and there are more than 350 thousand microgroups which contain more than 20 million users by Apr. 2011. The emergence of microgroup provides us a good opportunity to do research on user classification, which is often called as community detection in network science. Community detection within real-world networks, such as OSNs, Internet, and biological networks, is a problem of considerable practical interest and has received a great deal of attention [1][2][3][4][5][6][7]. Thus, we believe that community detection on microblogging systems (e.g., Twitter, TSina) is also very worthy of investigation in depth, however, little work has been done so far. In this paper, TSina is chosen as our experiment platform for community detection on microblogging systems. As a community (i.e., microgroup) is a group of users not only with close connections, but also with similar interest on TSina, we focus on determining community memberships by using link relationship and user attribute simultaneously, and present a new united community detection method considering both factors to group TSina users with higher accuracy. The rest of this paper is organized as follows. In Section 2 we give an overview of the related work. Section 3 describes the details of our data set. In Section 4 we characterize our sample microgroups in detail mainly from aspects of network structure and user attribute, then extract some useful findings for microgroup detection. A united method for microgroup detection on TSina is proposed in Section 5. In Section 6 we apply the newly proposed method on several realworld networks and compare their outcomes against some traditional algorithms. Finally, in Section 7, we conclude this paper briefly.
2
Related Work
Most previous community detection approaches are based on structural features (e.g., links), and a community is usually defined as a group of vertices such that there is a higher density of edges between nodes of the same group and a comparatively lower density between different groups [8][9]. Then, an objective function named modularity degree is often used to capture the above intuition of a community [4]. As the objective is typically NP-hard to optimize, many algorithms, including spectral partitioning [10], hierarchical clustering, heuristics and approximation solutions [11], have been extensively studied. In recent years, many researches have yet been done on community detection. Gregory et al. proposed an algorithm for finding overlapping community structure in very large networks [12]. Stanoev et al. presented a novel algorithm for community detection that combines network structure with processes that support creation and/or evolution of communities [13]. Yang et al. presented a probabilistic model for community detection that aims to model both incoming links and outgoing links simultaneously and differentially on directed networks [14]. However, several previous works have found that neither link structure nor user content is sufficient to determine the community memberships, while combing
140
X. Xiong et al.
link with content usually achieves better performance [15][16]. For example, Erosheva et al. combined LDA with LDA-Link for network analysis [17]. Yang et al. proposed a discriminative model for combining the link and content analysis for community detection from networked data, such as paper citation networks [18]. Other approaches that exploit topic models for community detection include [19] and [20]. However, these previous researches are very similar to the problem of text classification, and only act on the networks with nodes denoting text pages (e.g., blog pages, wikipedia pages, and published papers), but not on the social networks with nodes denoting users. Hence, it is a challenging but rewarding task for us to cluster homogeneous users with close connections and similar interests into communities simultaneously on microblogging systems.
3
Data Set
On TSina, microgroup was introduced in Nov. 2010 and attracted more than 20 million users until Apr. 2011. As most microgroups are formed by users with similar interests, therefore, in order to analyze the explicit and internal characteristics of microgroups, we chose 34 microgroups, covering almost all kinds of microgroups on TSina, for analysis. We crawled the link structure and content information of these microgroups in a short time interval from March 6th to March 21st, 2011. Here, user ID, name, location, gender, verified flag, published tweets, followers list, followings list, tags list, and topics list were crawled. The final total number of users we gathered is about 200,000 from 34 microgroups. Each microgroup is a sample of community from TSina network, and can be seen as a directed graph, in which vertex means microgroup member, and edge indicates the “follow” relationship That is, a directed edge from A to B means that user A follows B, then we say that A is a follower of B, and B is a following of A. When characterizing our sample microgroups, we consider only the edges among members from the same microgroup but ignore the links between microgroups, which yields 34 separate graphs.
4
Characterizing Microgroup
Before delving into the challenging problem of microgroup detection on TSina, we run a batch of analysis on characterizing sample microgroups and expect to extract some findings that are conducive to exploit a more efficient method on microgroup detection. We begin our analysis of microgroup with the following questions: Whether the two linked users are similar to each other on some attributes? What factors are more significant in driving users to join the same microgroup, and whether there are some similarity among the members from the same microgroup? Therefore, we first summarize the basic information of sample microgroups, then characterize them in detail from both aspects of network structure and user attribute in this section.
Microgroup Mining on TSina via Network Structure and User Attribute
4.1
141
Basic Analysis
We summarize the basic network properties of our sample microgroups, and the average results are shown in Table 1, from which we can know that those networks are very sparse with low densities (average is 0.0077). Furthermore, about one in five members are isolated and have no link relationship with others, and they join microgroups just for sharing information, but not making friends. Hence, isolated users can not be classified only from the view of link structure, however, their attributes may help to explain why isolated users choose to join the microgroup, and they may be similar to other members on some attributes. Table 1. Basic statistical characterizations of sample microgroup networks
Avg
Node# 1797
dEdge# 12587
BiE(%) 44.82
MD 5.9
IsoN(%) 19.85
Density 0.0077
Node#: number of nodes; dEdge#: number of directed edges; BiE(%): ratio of biway edges; MD: mean degree; IsoN(%): ratio of isolated nodes; Density: network density.
The ratio of bi-edges is often used to measure the reciprocity of a social network, and many previous studies have reported high level of reciprocity on some social networks: 68% of user pairs with any link between them are connected biway on Flickr [21] and 84% on Yahoo!360 [22]. But there is also research showing a low level of reciprocity on Twitter: 77.9% of user pairs are one-way, and only 22.1% have reciprocal relationships between them [23]. Low reciprocity on global Twitter network may be caused by the fact that top users with large number of followers in Twitter are mostly celebrities and mass media, but most of them do not follow their followers back. On sample microgroups, the level of reciprocity is moderate: 44.8% of user pairs are bi-way, which is larger than Twitter but lower than Flickr. As similar with Twitter, most celebrities and mass media are followed by a large number of users but do not follow them back, what’s more, few celebrities and media would like to join a microgroup on TSina. 4.2
Assortativity Coefficient
Similarity breeding connection is a principle that structures many kinds of network ties, including friendship, reference, support, coauthor and so on. We call the principle as homophily, an important criterion to quantify the tendency for users to be friends with others who have similar characteristics, which can be measured by assortativity coefficient. Here, in order to analyze the similarity degree among users from the same microgroup, we study the assortativity coefficients by different user attributes, including degree, gender, location, VFlag, tweets count, retweets count, and comments count. Newman proposed a method to compute the degree assortativity coefficient on directed networks [24], i.e., Eq. 26, which will be employed in this paper.
142
X. Xiong et al.
When calculating the assortativity coefficients by other continuous attributes like tweets count, retweets count, and comments count, we measure with the standard Pearson correlation coefficient described in Eq. 21 of [24]. However, when computing assortativity coefficient by discrete or enumerative attributes like location, a general measure of scalar assortativity relative to a categorical variable is given by � � tr(e) − �e2 � (1) r= 1 − �e2 � where e = E/ �E� is the normalized mixing matrix, the elements Eij of E give the number of edges in the network that connect from a node of type i (e.g., users from “Beijing”) to type j (e.g., users from “Shanghai”).
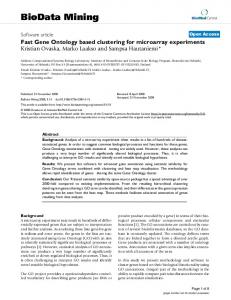
Fig. 1. Assortativity coefficients by user attributes (Degree, Gender, Tweets#, Retweets#, Comments#) on each sample microgroup
The results of assortativity coefficients based on some user attributes are described in Fig. 1, from which we can know that although many ordinary social networks tend to be positively assortative with respect to degree, for most of our sample microgroups, the degree assortativities (denoted by � in Fig. 1) are negative, or weakly positive with low values, which implies that most users with few followers tend to follow others with many followers, like celebrities. Besides, the two users with “follow” relationship are not so similar on the attribute of degree in most cases. To some extent, the number of tweets can be used to measure a user’s activity on TSina. From our observations, we find that many assortativity coefficients by tweets# (denoted by � in Fig. 1) are positive, which is distinct from degree assortativity and indicates that many users tend to follow others with similar number of published tweets. In addition, the number of retweets and comments are important measurements for user’s popularity on TSina, and assortativity coefficients by retweets# (denoted by � in Fig. 1) imply a similar conclusion with degree assortativity. That is, most ordinary users tend to follow others with high popularity. Assortativity coefficients by comments# (denoted by � in Fig. 1) show consistent result with retweets#.
Microgroup Mining on TSina via Network Structure and User Attribute
143
Assortativity coefficients by gender (denoted by • in Fig. 1) are very close to 0 on most sample microgroups, which reveals that there is no obvious tendency for user to follow others with the opposite or same gender. As most members on microgroups are non-verified, and some microgroups like collegiate groups are localized in the same city, assortativity coefficients based on VFlag and location will be ignored in this paper. By analyzing the assortativity coefficients based on different user attributes, we find that the two ends with link relationship are different from each other on many attributes like degree and popularity, which differs significantly from other ordinary social networks. For this reason, when classifying users to different microgroups, link structure is not satisfactory in determining accurately the community memberships. 4.3
Density Difference
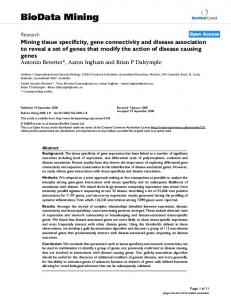
From common definition, a community is a subset of users within which the network connections are dense, but between which they are sparser. So the density of our sample microgroups should be higher than the random sampling groups. In m this paper, the density of a directed network G(n, m) is defined as d = n×(n−1) , and m, n are respectively the total number of directed edges and nodes in the network. In Fig. 2, we show the densities of our sample microgroups, which are presented by the ratios compared to the random case. From Fig. 2 we know that the densities of our sample microgroups vary a lot, and many have much more compact structures than random sampling groups, like microgroup 12, 13, 25, 28, and 32. However, there are also some microgroups with density close to the random case, such as microgroup 3, 1, 21, 20, 18, and 9, besides, the density of microgroup 3 is less than the random case. The existence of these microgroups with low densities breaks the traditional definition of community, which focuses only on the compactness of the link structure. Thus, we further enhance our conclusion that it is not sufficient to identify microgroups by only considering link structure on TSina.
Fig. 2. Density of sample microgroups compared to random case
144
4.4
X. Xiong et al.
Attribute Similarity
In many social networks, attribute similarity is a basic principle for users to gather together in the same community. In order to dig out the distinctive characteristics of members from the same microgroup, we analyze the average similarity among users based on their common followers, followings, tags, and topics, respectively, on each sample microgroup, then compare the observation results with a series of random sampling groups. By comparison, we try to reveal what characteristics are remarkable for us to label users from the same microgroup, which can help to identify communities on TSina. In this paper, Jaccard coefficient, a commonly used similarity metric in information retrieval [25], is used to measure the attribute similarity among users, that is, measure the probability that both x and y have common feature f . If the “feature” here is taken as followers, followings, tags, or topics, the similarity between user x and y on each feature can be calculated as follows: sf (x, y) =
|Γf (x) ∩ Γf (y)| |Γf (x) ∪ Γf (y)|
(2)
where Γf (x) is the set of feature f for user x, such as the set of followers of user x, and |Γ | is the number of elements in Γ . Then, on each microgroup, the average similarity among users by different features is: avg sf (G) =
1 N × (N − 1)
�
sf (x, y)
(3)
x,y∈Γ (G)
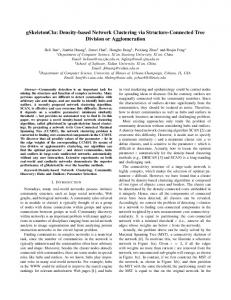
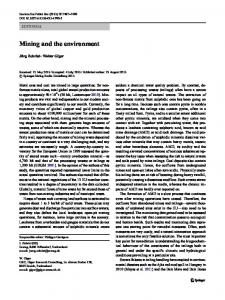
where Γ (G) is the set of users on microgroup G, and N is the size of Γ (G). We have mentioned that a microgroup should be a group of users with similar interest measured by users’ features. In order to estimate what features are more prominent, we construct a series of random sampling groups with different number of users from all crawled users. The average similarity between random sampling groups are shown in Fig. 3, from which we see that, with the size increase of random sampling groups, the average similarity measured by Jaccard coefficients are very stable on all considered features. Thus, our approach of random sampling is nearly unbiased, and the results of random cases can be seen as baseline. The results of average similarity by different features on each sample microgroup are shown in Fig. 4, which are expressed by the ratios compared to the random sampling groups described in Fig. 3. We call the ratio as significance degree in this paper. From Fig. 4, we find that the feature of followers is the most significant and the average ratio is much higher (average: 22.6) than the other three features, in which followings is the least prominent and most ratios are close to one (average: 1.4), i.e., the average similarity by followings on our sample microgroups is very close to random sampling groups. Then, we conclude that users with more common followers are more likely to be similar and in the same microgroup, but this is not suitable for followings. The non-significance of the feature of followings may be induced by the truth that many users choose to
Microgroup Mining on TSina via Network Structure and User Attribute
145
Fig. 3. Average attribute similarity measured by Jaccard coefficient on random sampling groups. The considered attributes are Followers, Followings, Tags and Topics.
follow some common celebrities simultaneously, however, the action of celebrities following expresses little about user’s interest. Intuitively, tags and topics are very important indicators of a user’s interest, but our results from Fig. 4 show that the two features are not so significant as expected, with the average ratios of Jaccard coefficients about 3.8 and 3.6, respectively. Thus, we know that the feature of followers is the most significant for microgroup detection, then followed by tags and topics, but the feature of followings is nearly indistinctive, and we will ignore it when identifying microgroups.
Fig. 4. Attribute similarity of sample microgroups compared to random case
5
United Microgroup Detection Method
Microblogging users construct an unweighted and directed network, and the problem of community detection on directed networks has been well studied. However, as aforementioned, neither link structure nor user attribute is satisfactory in identifying the community memberships on TSina: the link relationship is usually sparse on microblogging networks, and the two ends with link relationship are dissimilarity on many attributes. In addition, the irrelevant user
146
X. Xiong et al.
attributes may mislead the result of microgroup detection. Hence, in order to solve the problem of community detection on TSina with a higher performance, we propose a united method without losing the information of link structure and user content. Here, user content mainly includes discussed topics and attributes like followers list and tags list. Then, there are two “links” between users, one is the explicit “follow” relationship, and the other is the implicit attribute similarity between the two ends. With our new method, we uniformly convert the link structure and attribute similarity to the edge weight of a newly generated network, then many well known community detection algorithms that support undirected weighted networks would be employed. Consider two nodes i and j on TSina network. The edge weight between the two nodes can be calculated as follows: �
�
Wij = αLij + βSij
(4)
where α, β (α + β = 1) are respectively the weight values of link structure and � attribute similarity in microgroup detection. Lij is the normalized edge weight � converted from the information of direction, while Sij is the normalized attribute similarity between the two users. In our united approach, instead of simply ignoring directional information, we use the method proposed by Youngdo Kim et al. to convert the information of link direction to the weight of a new undirected link [26]. The key idea is to give higher weight to the more surprising link, and the surprising degree is measured by the probability of the link. Let’s consider a link directing from node i to j, and the probability of this link, when the links are assigned randomly while keeping the degree of each node, is kiout kjin /2m out in ki kj /2m + kjout kiin /2m
(5)
Lij = Aij (1 − pij ) + Aji (1 − pji )
(6)
pij =
� � where kiout = j Aij and kjin = i Aij are respectively the outgoing and incoming degree of node i and j, where Aij = 1 if there is a link from � �i to j, and 0 otherwise, and m is the total number of links defined as m = i j Aij . As smaller pij indicates stronger relatedness for the direction from node i to j, then the weight of the link between node i and j is defined as
{Lij } is an undirected weighted network transferred from the original directed weighted network {Aij }. Attribute similarity between two users is measured by the Jaccard coefficient of user features stated above, from which we know that the average similarity on the feature of followers is the most prominent, followed by tags and topics. However, similarity on the feature of followings is nearly the same with random case, and will be ignored when measuring the similarity between two users. Thus, we define the attribute similarity between node i and j as top Sij = η1 sfijol + η2 stag ij + η3 sij
(7)
Microgroup Mining on TSina via Network Structure and User Attribute
147
top where sfijol , stag ij , and sij are respectively the normalized similarity by the feature of followers, tags, and topics between node i and j. ηi (i = 1, 2, 3) are their weight values which indicate the significance in measuring similarity. Here, ηi will be determined by the significance degrees of the features mentioned in above subsection, then we empirically assign η1 : η2 : η3 = 22.6 : 3.8 : 3.6. By applying our new approach introduced above, the information of link structure {Lij } and attribute similarity {Sij } can be unitedly converted to the edge weight of a new network {Wij } which is undirected and weighted. Then, many well developed community detection methods for undirected weighted networks can be applied to microgroup detection on TSina, without losing considerations of link structure and user attribute. In this paper, three well known algorithms of CNM [8], Informap [27], and OSLOM [28] are employed to identify communities on re-modeled networks. CNM is a fast greedy modularity optimization algorithm proposed by Clauset, Newman, and Moore, and its key idea is: starting from a set of isolated nodes, the links of the original network are iteratively added to produce the largest possible increase of the modularity degree at each step. Infomap is a new information theoretic approach proposed by Rosvall and Bergstrom that reveals community structure in weighted networks, and the key is to decompose a network into modules by optimally compressing a description of information flows on the network. Order Statistics Local Optimization Method (OSLOM) is the first method capable of detecting communities in networks accounting for edge directions, edge weights, overlapping communities. The method is based on the local optimization of a fitness function expressing the statistical significance of communities with respect to random fluctuations, which is estimated with tools of Extreme and Order Statistics.
6
Experiments and Results
In this section, we validate the effectiveness and efficiency of our newly proposed microgroup detection method by applying it to several real-world networks from TSina. Since almost all of the frequently-used test networks (e.g. Zachary [29], Football [3], Dolphins [30]) in community detection have no information about user attribute, we collect four collegiate social networks from TSina as our test cases, and each of them is composed by some microgroups. The detecting results by our method will be compared with the real community structures of these test networks. Table 2 shows the basic information of our four test networks. For example, TU is a social network of TSina users from TSinghua University, one of the most famous universities in China, which is composed by eight microgroups, namely, Fine Arts Institute, Architecture Institute, EMBA Club, Chinese Institute, Law Institute, TSinahua Library, Electronic Engineering Institute, and Industrial Engineering Institute. By applying our method, we convert the link relationship and attribute similarity between two users to the edge weight of a newly generated network with Eq. 4. As the weight values of α and β respectively indicate the importance of
148
X. Xiong et al. Table 2. Basic information of test networks
Network College TU TSinghua University HUST Huazhong University of Science and Technology BNU Beijing Normal University RUC Renmin University of China
Nodes 2102 792 670 569
Edges Microgroups 10792 8 4355 9 7923 10 3727 5
the link and attribute in microgroup detection, we will gradually vary the two values (α, β) to seek a better assignment in our experiments. Then, the community detection algorithms support for undirected weighted network can be employed on the newly generated network. In order to estimate the performance of community detection methods, the best way is to compare their outcomes with real community partition on artificial or real-world networks, and this can be done using similarity measures as mentioned in [31]. Newman used fraction of correctly identified nodes to measure the performance of community detection algorithm in [3]. However, it does not work well in some cases, then some other measurements have been proposed. The measurement of Normalized Mutual Information(NMI ) borrowed from information theory has been proved to be reliable [2], and will be adopted to estimate the performance of our untied method. NMI takes the maximum value of 1 if the detected partition is completely consistent with the real case, whereas it has an expected value of 0 if the two partitions are totally independent. In Fig. 5, we show the experimental results of our method on four test networks. In order to reveal the performance of our method under different parameters, the weight value of link structure (α in Eq. 4, β = 1 − α) is tuned from 0 to 1 with 0.1 as the step size, and α = 0 is the case of conventional clustering method considering only user attribute, α = 1 means the case of traditional community detection method based only on link structure. On each test social network, the tendencies of tree curves respectively for CNM, OSLOM, and Infomap are very consistent. The performance of three methods are sensitive to α, and increase with the growth of α, then achieve the highest level when α is about 0.5. After that, the performances decrease with the growth of α. In addition, by comparing the three curves, we can know that the methods of CNM and Infomap always achieve better results than OSLOM. Thus, we can conclude that, no matter what algorithms you choose, link structure and user attribute play almost equally important roles for microgroup detection, and our united method considering both aspects allows us to get a better performance than the traditional algorithms based on either link relationship or attribute similarity. Finally, Fig. 6 shows the accuracy improvement of our united method compared with the method based only on link structure, taking CNM algorithm as an example. On four test social networks, the average accuracy improvements indicated by left pillars in Fig. 6 is about 25%, and the biggest is 37% on TU network. Furthermore, as most microgroups on TSina are very sparse and many isolated users cannot be clustered to any community using the methods based only on link structure. Fortunately, using our method, more users can be
Microgroup Mining on TSina via Network Structure and User Attribute
(a) TU
(b) HUST
(c) BNU
(d) RUC
149
Fig. 5. Results of our method on four real-world networks
Fig. 6. Performance improvements of our method on four real-world networks
processed. The right pillars in Fig. 6 show the decrement rates of unrecognized users on test networks, and the mean value is about 72%.
7
Conclusion
In this paper, we have characterized the structure and content of many crawled sample microgroups in detail, and proposed a united method to combine link structure and user attribute for microgroup detection on TSina. Using the new method, link structure and attribute similarity between two users are converted to the edge weight of a newly generated network. Through extensive experiments on four real-world social networks, we have observed that our method achieves significant improvement over the traditional algorithms considering only link structure or user attribute.
150
X. Xiong et al.
For future work, inspired by the fact that user’s interest can be extracted from published tweets with some topic models like PLSA and LDA, we plan to consider more factors to measure interest similarity between users, and try to improve the performance of our microgroup detection method. Moreover, we will validate the performance of our method on more data sets.
References 1. Fortunato, S.: Community detection in graphs. Physics Reports 486(3-5), 75–174 (2010) 2. Danon, L., Duch, J., Arenas, A., Daz-guilera, A.: Comparing community structure identification. Journal of Statistical Mechanics: Theory and Experiment 9008, 09008 (2005) 3. Girvan, M., Newman, M.E.J.: Community structure in social and biological networks. PNAS 99(12), 7821–7826 (2002) 4. Newman, M.E.J., Girvan, M.: Finding and evaluating community structure in networks. Phys. Rev. E 69(2), 26113 (2004) 5. Radicchi, F., Castellano, C., Cecconi, F., Loreto, V., Parisi, D.: Defining and identifying communities in networks. Proceedings of the National Academy of Sciences 101(9), 2658 (2004) 6. Palla, G., Derenyi, I., Farkas, I., Vicsek, T.: Uncovering the overlapping community structure of complex networks in nature and society. Nature 435, 814 (2005) 7. Arenas, A., D´ıaz-Guilera, A., P´erez-Vicente, C.J.: Synchronization reveals topological scales in complex networks. Phys. Rev. Lett. 96(11), 114102 (2006) 8. Clauset, A., Newman, M.E.J., Moore, C.: Finding community structure in very large networks. Phys. Rev. E 70(6), 66111 (2004) 9. Flake, G., Lawrence, S., Giles, C., Coetzee, F.: Self-organization and identification of Web communities. Computer 35(3), 66–70 (2002) 10. Pothen, A., Simon, H.D., Liou, K.P.: Partitioning sparse matrices with eigenvectors of graphs. SIAM J. Matrix Anal. Appl. 11(3), 430–452 (1990) 11. Kernighan, B.W., Lin, S.: An Efficient Heuristic Procedure for Partitioning Graphs. The Bell system technical journal 49(1), 291–307 (1970) 12. Gregory, S.: Finding overlapping communities in networks by label propagation. New Journal of Physics 12(10), 103018+ (2010) 13. Stanoev, A., Smilkov, D., Kocarev, L.: Identifying communities by influence dynamics in social networks (April 2011) 14. Yang, T., Chi, Y., Zhu, S., Gong, Y., Jin, R.: Directed network community detection: A popularity and productivity link model. In: SIAM International Conference on Data Mining, pp. 742–753 (2010) 15. Cohn, D., Hofmann, T.: The missing link - a probabilistic model of document content and hypertext connectivity. In: Neural Information Processing Systems, vol. 13 (2001) 16. Getoor, L., Friedman, N., Koller, D., Taskar, B.: Learning probabilistic models of link structure. Journal of Machine Learning Research 3, 679–707 (2002) 17. Stephen, E.E., Fienberg, S., Lafferty, J.: Mixed membership models of scientific publications. Proceedings of the National Academy of Sciences (2004) 18. Yang, T., Jin, R., Chi, Y., Zhu, S.: Combining link and content for community detection: a discriminative approach. In: Knowledge Discovery and Data Mining, pp. 927–936 (2009)
Microgroup Mining on TSina via Network Structure and User Attribute
151
19. Dietz, L., Bickel, S., Scheffer, T.: Unsupervised prediction of citation influences. In: Proceedings of the 24th International Conference on Machine Learning, pp. 233–240 (2007) 20. Amit Gruber, M.R.Z., Weiss, Y.: Latent topic models for hypertext. In: Uncertainty in Artificial Intelligence, pp. 230–239 (2008) 21. Cha, M., Mislove, A., Gummadi, P.K.: A measurement-driven analysis of information propagation in the flickr social network. World Wide Web Conference Series, pp. 721–730 (2009) 22. Kumar, R., Novak, J., Tomkins, A.: Structure and evolution of online social networks. In: Knowledge Discovery and Data Mining, pp. 611–617 (2006) 23. Kwak, H., Lee, C., Park, H., Moon, S.B.: What is twitter, a social network or a news media? World Wide Web Conference Series, pp. 591–600 (2010) 24. Newman, M.E.J.: Mixing patterns in networks. Phys. Rev. E 67(2), 26126 (2003) 25. Liben-Nowell, D., Kleinberg, J.: The link-prediction problem for social networks. J. Am. Soc. Inf. Sci. Technol. 58, 1019–1031 (2007) 26. Kim, Y., Son, S.-W., Jeong, H.: Community Identification in Directed Networks. In: Zhou, J. (ed.) Complex 2009. LNICST, vol. 5, pp. 2050–2053. Springer, Heidelberg (2009) 27. Rosvall, M., Bergstrom, C.T.: Maps of random walks on complex networks reveal community structure. PNAS 105, 1118 (2008) 28. Lancichinetti, A., Radicchi, F., Ramasco, J.J.: Statistical significance of communities in networks. Phys. Rev. E 81(4), 46110 (2010) 29. Zachary, W.: An information flow model for conflict and fission in small groups. Journal of Anthropological Research 33, 452–473 (1977) 30. Lusseau, D., Schneider, K., Boisseau, O.J., Haase, P., Slooten, E.: The bottlenose dolphin community of doubtful sound features a large proportion of long-lasting associations. Behavioral Ecology and Sociobiology 54(4), 396–405 (2003) 31. Traud, A.L., Kelsic, E.D., Mucha, P.J., Porter, M.A.: Comparing Community Structure to Characteristics in Online Collegiate Social Networks. In: Proceedings of the 2009 APS March Meeting (March 2009)