http://jtlu.org . 3 . 2 [Summer 2010] pp. 65–84 doi: 10.5198/jtlu.v3i2.124
Microsimulating parcel-level land use and activity-based travel Development of a prototype application in San Francisco Paul Waddell University of California, Berkeley a
Liming Wang University of California, Berkeley b
Billy Charlton Aksel Olsen c San Francisco County Transportation Authority San Francisco Planning Department d
is paper develops a prototype of an integrated microsimulation model system combining land use at a parcel level with activity-based travel in San Francisco, California. e paper describes the motivation for the model system, its design, data development, and preliminary application and testing. e land use model is implemented using UrbanSim and the Open Platform for Urban Simulation (OPUS), using parcels and buildings rather than zones or grid cells as spatial units of analysis. Measures of accessibility are derived from the San Francisco SF-CHAMP activity-based travel model, and the predicted locations of households and business establishments are used to update the micro-level inputs needed for the activity-based travel model. Data used in the model include business establishments linked to parcels over several years, and a panel of parcels that allow modeling of parcel development over time. is paper describes several advances that have not been previously integrated in an operational model system, including the use of parcels and buildings as units of location for consumers and developers of real estate, the use of business establishments to represent economic activity, and the interfacing of this microsimulation land use model with a microsimulation activity-based travel model. Computational performance and development effort were found to be modest, with land use model run times averaging one minute per year on a current desktop computer, and two to three minutes on a current laptop. By contrast, long run times of the travel model suggest that there may be a need to reconsider the level of complexity in the travel model for an integrated land use and transportation model system application to be broadly usable. e land use model is currently in re nement, being used to identify input data and model speci cation adjustments needed in order to bring it into operational use, which is planned over the next several months. Abstract:
microsimulation, land use model, activity-based travel, integrated modeling, residential location choice, business location choice, real estate development, real estate prices, built environment and travel behavior Keywords:
a
[email protected] [email protected] c
[email protected] d
[email protected] b
Copyright 2010 Paul Waddell, Liming Wang, Billy Charlton, and Aksel Olsen. Licensed under the Creative Commons Attribution – NonCommercial License 3.0.
()
1 Introduction
Over the past decade, two research streams have gained attention from both research and practitioner communities in transportation, based on their potential to address some of the key criticisms directed towards the state of the practice travel model systems. ese two areas are activity-based modeling of travel demand (Bowman and Ben-Akiva 1999; Kitamura 1997; Kitamura et al. 2000; McNally 2000) and integrated land use and transportation models based on a dynamic microsimulation formulation (Salvini and Miller 2005; Waddell 2000, 2002). Although there has been some crossover in these research areas, little has made its way into practical application in the eld. We propose that there is considerable theoretical and practical bene t to be gained from the closer integration of these two research areas in the form of microsimulation land use and activity-based travel modeling, and this paper reports the design and implementation of a prototype of such a model for the City and County of San Francisco. e behavioral rationale for activity-based modeling, using tours of activities rather than trips as a basis, has been widely accepted, though relatively few applications have been put into operation. Similarly, integrated land use and transportation model systems are generally accepted as a signi cant improvement in the behavioral realism of transportation planning, by representing the reciprocal relationships between these systems, but practice again lags expectations. We argue that the lack of progress in operational use is due to a variety of factors, including the limited evidence in current literature on the nature of improvements in theses models’ results (as compared to their presumably simpler and less costly predecessors that are more widely used in practice). A second major obstacle is the need for more usable, higher performance, and exible so ware systems for implementing these new models. We hope to contribute to the literature and to successful practice by attempting to address both of these concerns. In this paper, we describe the development and implementation of an adaptation of the UrbanSim land use model in San Francisco, using individual land ownership parcels as the basic geographic unit for real estate development and individual buildings on parcels as the locational unit for households and businesses. We link this model system to the San Francisco activity-based travel model system (SF-CHAMP) using a loose coupling approach. is work represents several signi cant innovations in operational land use and transportation modeling, including the use of parcels and buildings for location and development, the incorporation of business establishments, and the coupling with an activity-based travel model system. e paper is organized as follows: 1) project context and motivation for developing anintegrated model system, 2) the development of the parcel-based land use simulation model based on UrbanSim, focusing on aspects relevant to integration with an activity based travel model system, 3) the database development effort and issues that arise in the context of parcel-level modeling, 4) a summary of the SF-CHAMP activity-based travel model used by the SFCTA as their operational travel model, highlighting its design features most relevant to the integration with a microsimulation land use model system, 5) the design of the integrated model system and its implementation, and 6) a summary of model estimation results and preliminary work to assess the model, followed by conclusions and future work.
Microsimpulating parcel-level land use and activity-based travel
2 Project context and motivations e San Francisco County Transportation Authority is responsible for the development of multi-modal transportation plans within the City and County of San Francisco. For this purpose, the agency has developed one of the few operational activity-based travel models in use in the United States. San Francisco has a dense multi-modal transport network and represents the core of a metropolitan region that contains more than seven million people. us the complexity of travel patterns helped motivate the shi to an activity-based travel model, which would be more sensitive to complex mode combinations on tours than can be re ected with trip-based models. Complex transportation investments are under consideration within the city, as depicted in Figure 1, for which solid ex ante analysis is needed.
Figure 1: Transportation Corridors and Projects to be Analyzed by SFCTA
e land use inputs for SF-CHAMP are developed by the Planning Department of the City and County of San Francisco, which maintains a detailed parcel-level land use inventory and tracks business occupancy over time to assist in assigning land use codes to parcels. In the past, developing forecasts for the travel model using these land use data has required substantial effort, along with a combination of GIS, spreadsheets, and numerous assumptions. e process was somewhat slow and laborious, and did not lend itself to address the emerging needs of both the Planning Department and SFCTA to run multiple scenarios, combining different input assumptions regarding land use policies and transportation system con gurations, and policies such as tolling. e San Francisco Planning Department is charged with preparing and maintaining the General Plan for the city and county: analyzing growth patterns, assessing land use needs, and periodically updating the zoning code to re ect the land policies of the general plan (itself subject to updates as needs change). In recent years, economic restructuring has led to a decline in traditional manufacturing industries relying heavily on large swaths of inexpensive land, a com-
()
modity less available in compact San Francisco than elsewhere in the region or beyond. New industries have emerged to take their place and adapt the building stock to their needs. For example, many internet and multimedia companies have opened in the South of Market district, which has access to a specialized labor force appreciative of the urban lifestyle the area affords (Wolfe 1999). Perennially strong demand for housing at all price levels outstripping supply has led to policies of accommodation through the Planning Code in erstwhile industrial areas while at the same time reserving core areas for the strong residual light industrial businesses which will likely stay in the city due to agglomeration economies, proximity to clients and suppliers (see, e.g. San Francisco Planning Department 2002; Storper 1997). e nature and amount of growth in San Francisco has been contested for at least a generation, and disagreements are routinely waged at the ballot box (Olsen 2004). It is worth noting that although the California real estate market was one of the worst hit by the housing market crash that began in 2007, San Francisco has remained relatively strong and had one of the highest appreciation rates in early 2010. Given the scarcity of space in San Francisco, which comprises only 49 square miles of land, the Planning Department has an obvious interest in understanding and modeling how location choices and real estate processes work in order to better devise new plans and programs. For larger programs, projects and plans, in connection with the environmental review process and pursuant to the California Environmental Quality Act, the Department analyzes the land use impact of a given project over a twenty-year (or more) period. Even more recently, with the passage of California Senate Bill 375, regions across the state are charged with devising Sustainable Community Strategies in the coming years, making land use and commodity ows an integral part of the effort to stem the rise of greenhouse gases. e development of the Sustainable Community Strategy will require (and afford the opportunity for) a tight coupling of the land use and transportation modeling frameworks, allowing for several growth scenarios to be tested. As a result of these needs, SFCTA and the Planning Department embarked on a project to jointly develop an integrated model system, enabling land use forecasts to be prepared in a more automated way, exploiting the rich parcel-level database that the Planning Department had developed over several years. e project had a very modest budget (well under $100,000) and an optimistic schedule of one year—but it offered an excellent opportunity to move closer to the idealized model system using parcel-based land use and activity-based modeling (Hunt et al. 2005). As o en happens in an overly constrained situation, one of the constraints is relaxed—in this case, it was the schedule.
3 A parcel-level application of UrbanSim Most prior operational land use models have used a fairly high degree of spatial aggregation, designed for use with aggregated zone systems; for cross-sectional, equilibrium application included ITLUP (Putnam 1983), TRANUS (de la Barra 1989), and MEPLAN (Echenique et al. 1990). Recent work on integrated land use and transportation models have favored a dynamic temporal approach using annual time steps rather than a time-abstract equilibrium approach; these include UrbanSim (Waddell 2000, 2002), DELTA (Simmonds 1999), and ILUTE (Salvini and Miller 2005).
Microsimpulating parcel-level land use and activity-based travel
To our knowledge, the only operational land use simulation system that has attempted to use parcels as a unit of analysis was the initial prototype of UrbanSim (Waddell 1998, 2000). It used parcels to simulate land development, but zones as the units of location choice, though others have also advocated the use of parcels in land use modeling (Hunt et al. 2005) and some model components have been published using parcels. Parcels have a natural attraction for use as a foundation for land use modeling because they are consistent with behavior, but until recently, their potential bene ts have been overshadowed by complications related to using these data for modeling purposes. We will return to this issue in the discussion of the implementation of the model, which uses parcels as the core spatial unit of analysis. e original design of UrbanSim adopted several characteristics that have remained foundational in the development of the system over time. ese aspects included: •
e representation of individual agents: initially households and rms; later, jobs.
•
e representation of the supply and characteristics of land and of real estate development, at a ne spatial scale: initially a mixture of parcels and zones; later, grid cells of user-speci ed resolution.
•
e adoption of a dynamic perspective of time, with the simulation proceeding in annual steps, and the urban system evolving in a path dependent manner.
•
e use of real estate markets as a central organizing focus, with consumer choices and supplier choices explicitly represented, as well as the resulting effects on real estate prices. e relationship of agents to real estate tied to speci c locations provided a clean accounting of space and its use.
•
e use of standard discrete choice models to represent the choices made by households and rms and developers (principally location choices). To date, this has relied on the traditional Multinomial Logit (MNL) speci cation, though capacity to use any of the GEV family of models has recently been added.
• Integration of the urban simulation system with existing transportation model systems: to obtain information used to compute accessibilities and their in uence on location choices, and to provide the raw inputs to the travel models. •
e adoption of an Open Source licensing for the so ware, written originally in Java, and released continually on the Web since 1998 at http://www.urbansim.org. e system has been reimplemented in Python as part of the development of a more modular and exible Open Platform for Urban Simulation (OPUS) that was recently released as Open Source so ware on the Web at http://www.urbansim.org (Waddell et al. 2005).
4 Database development e setting for this model application is San Francisco City and County, which form the central core of the Bay Area in California. e study area is a subset of the metropolitan area used for transportation planning purposes, and therefore must interface with the data and models used by the Association of Bay Area Governments (ABAG) and the transportation planning of the Metropolitan Transportation Commission (MTC).
()
Since 1998, the San Francisco Planning Department has maintained a parcel-based land use data system, in which they monitor land use and development on an annual basis. Business establishment data from Dun & Bradstreet are geocoded to the parcel level and assist in the re nement of a land use classi cation system, used by the Planning Department and the SFCHAMP activity based travel model. is data system provided an unusual opportunity to use a panel of microscopic data from 1998 to the present in model development. As is to be expected, there are problems with the data when examined in detail, but were remarkably useful resources for the modeling application itself. Figure 2 depicts the spatial distribution of the business establishments used in this model development effort. Building records were generated from parcel attributes, and businesses were assigned to those buildings. Buildings were then linked to parcels, and parcels linked to zones, census blocks, and other higher-level geographies. is project served as a reminder that no matter how good the data looks from a distance, it is messy in the details, and this database was no exception. Due to the project’s budget and time constraints, however, relatively modest effort was made to attempt to systematically analyze and clean the data for use in the development of the prototype model. is may be a reasonable strategy in general, since the initial development of the model helped reveal inconsistencies and errors in the data. But there remain gaps in the data that will need to be addressed more robustly before the resulting model can be con dently considered suitable for use on operational applications. Recent work in developing data mining and machine learning tools may be of particular value here, owing to the internal relationships among attributes within and between observations and tables. e travel model system uses synthetic households and persons as a basic data input. ese data are generated by the PopSyn synthesizer (Bowman and Rousseau 2006) and typically must be generated for any future forecast years in addition to the base year for use in the travel model. e synthesizer for future years must generate the locations for synthesized households, but household synthesizers were not designed for the purpose of predicting residential location choices—something that land use models are explicitly designed to do. A key opportunity for tightly integrating microsimulation land use and travel model systems, then, is to use a common synthetic population for the base year, and use the land use model system to add households and manage their evolving location choices in response to changing housing market conditions and opportunities. Unfortunately, due to constraints within this project schedule, this has not been fully implemented. A loose coupling approach is used for this prototype application, which involves aggregating the data from the land use model in order to use existing procedures in the travel model system, avoiding more signi cant changes in that code. e travel model several measures of accessibility on a zone-to-zone basis. ese predictions were examined as inputs to the land use model for measuring the in uence of accessibility indicators on household and business location, in addition to effects on real estate development and prices. In this prototype application, the workplace choice remains an activity-destination choice in the travel model. A long-term workplace choice has since been developed as part of an application of UrbanSim in Seattle, and could be used in a re nement of this application to capture all long-term choices in the land use models, including residence, workplace, and vehicle ownership, and pass these as constraints into the travel models.
Microsimpulating parcel-level land use and activity-based travel
Figure 2: Geocoded Business Establishments Overlaid on Zones and Parcels, 2001
5 The SF-CHAMP activity based travel model Recent research has begun generating a much richer activity-based behavioral framework to replace the aggregate four-step transportation models with an individual and household level is simulation of activity patterns (Kitamura 1997; Kitamura et al. 2000; McNally 2000). research has produced several frameworks that have been implemented in so ware, including TRANSIMS (Rickert and Nagel 2001), ALBATROSS (Arentze et al. 2000), AMADEUS (Timmermans et al. 2002), PCATS (Pendyala et al. 2005), and CEMDAP (Bhat et al. 2004). One framework in particular has been successfully moved into operational use, based on the “full-day pattern” activity modeling approach (Bowman and Ben-Akiva 1999). is approach has been applied initially in Portland (Bradley et al. 1998) and later extended (Bradley et al. 1999). e most recent Portland models were used as the basis for the development of the San Francisco travel models, with some simpli cations to accelerate their development and implementation. Key features of the model system include: • Tours are the key unit of analysis for travel. • Tours made by a person within a day are jointly modeled.
() • Each tour is broken down into a chain of linked trips. •
e travel for each individual in the population is microsimulated.
e model system simulates the full-day pattern of travel using ve tour types: • Home-based work primary tours • Home-based education primary tours • Home-based other primary tours • Home-based secondary tours • Work-based sub-tours Figure 3 provides a schematic representation of the models and their data ow within this model system. Documentation of the model system is provided in (Outwater and Charlton 2008). For purposes of this paper, we point out that the model system uses synthetic households, simulates their workplace locations and vehicle availability conditionally on knowing their residence location, then models the daily activity patterns contingent on residence, workplace and vehicle availability. ese travel plans are then collapsed into trip tables and assigned to the network using a static equilibrium assignment approach in ve time periods. As inputs, the model system requires zonal predictions of population and employment by type that are generated by an external land use forecasting system. e SFCTA model is a more spatially focused model than the Metropolitan Transportation Commission (MTC) regional model, with additional detail in San Francisco.
6 Design and speci cation of the integrated model In mid-2006, SFCTA and the City Planning Department initiated a project to develop a land use model that could take advantage of the data system developed by the Planning Department at the parcel level, while requiring only modest time end effort to implement and use. e project was based on a desire to develop a ne-grained land use modeling capacity to provide inputs to the San Francisco travel model and address some of the planning challenges listed earlier. Although currently the travel model uses only zonal land use inputs, moving to a parcel level land use model afforded an opportunity to more readily change zonal boundaries in the travel model system, or to undertake analysis of more pedestrian-scale analysis of land use/transport interactions in a very mixed mode transportation environment. In addition, it offered the advantages of using existing data and more effectively testing the effects of changes in land use or transportation policy. e coupling of the land use and travel models was managed by a travel model interface in OPUS, which coordinated data passing and model sequencing. OPUS provides a very exible capacity to specify models, and is particularly well-developed for con guring discrete choice models, making the implementation of the adaptations needed for this application relatively straightforward. Speci c models are created by con guring a general implementation of location choice model. Currently OPUS supports speci cation, estimation, and simulation from models using a multinomial logit structure, but the range of model speci cations available has recently been extended through a preliminary interface to Biogeme,
Microsimpulating parcel-level land use and activity-based travel
Population Synthesizer
Zonal Data
All Models Person Records
Workplace Location Model
Vehicle Availability Model
Full-Day Tour Pattern Models
Time of Day Models
Logsum Variables
Trip Diary Records
Tour Mode Choice Models
Regional Trip Tables for Non-SF Trips
Transit Assignment by Time Period (5)
Figure 3:
Logsum Variables
Non-work Tour Destination Choice Models
Trip Tables
Accessibility Measures
Network Level of Service All Remaining Models
Intermediate Stop Choice Models
Visitor Trip and Destination Choice Model
Trip Mode Choice Models
Visitor Trip Mode Choice Model
Highway Assignment by Time Period (5)
e San Francisco Travel Model System
which supports a wide range of choice models in the generalized extreme value family, including nested, cross-nested, and network GEV (Bierlaire et al. 2004). Table 1 summarizes the speci cation of the core choice models in the system: the household location choice model, business location choice model, and development project choice model. ese speci cations de ne the following aspects of each model:
() •
e set of agents making the choice in the model
•
e type of the choice set (what kind of choice is being made)
•
e nature of any lter to be applied to the universe of alternatives that allows them to be considered as feasible alternatives
•
e sampling process for alternatives (since it is not workable to enumerate all alternatives when the set of alternatives is extremely large)
•
e strati cation of the model into submodels by characteristics of agents to allow separate speci cation and estimation for different market segments
•
e probability speci cation used in the model, de ning the choice model structure
•
e choice algorithm, re ecting (for example) the imposition of capacity constraints requiring choosers who are unable to select their preferred alternative to choose again
• Principal variables used in the utility speci cation e household location choice model predicts the location choices for households that are in the database of households but have no location assigned. ese households are without locations due to predictions of one of two models that run prior to the household location choice model. e rst of these is the demographic transition model, which runs at the start of each simulation year in order to reconcile the simulation population with externally imposed control totals. is adds households to the population but leaves their locations unassigned. e second source of households with no location is due to the household relocation choice model, which predicts the probability that households will move within the region during a simulation year, based principally on income and life cycle status. e business location choice model predicts location choices for businesses that lack a location in the database. As with the household location choice model, these businesses are without a location either because they have been added to the database by the economic transition model in order to accommodate new economic growth, or because they were predicted to relocate by the business relocation choice model. e latter is currently using only default relocation rates, until further analysis can be done on the panel of businesses maintained by the planning department. e development project location choice model re ects the choice of specialized developers choosing a location for their project. e development project transition model, which runs before this model, generates new projects to meet unsatis ed demand by monitoring vacancy rates during the simulation. Next, it samples projects from the development history until the pool of projects to locate is sufficient to restore the vacancy rate for a building type to its long-term structural rate. ese projects must then be located.
7 Model estimation results An initial version of the model has been estimated for further testing and re nement. Table 2 presents the log-likelihood results from each of the choice models discussed here, and the adjusted R-squared values from the hedonic regression models of real estate prices. Including
Microsimpulating parcel-level land use and activity-based travel
Table 1: Con
guration of Choice Models in San Francisco Model Application
Model
Household Location Choice
Business Location Choice
Development Project Location Choice Model
Model Type
Multinomial Logit
Multinomial Logit
Multinomial Logit
Agents
Households Locating in Year t , comprising new and relocating households
Businesses Locating in Year t , comprising new and relocating businesses
Development Projects Locating in Year t , comprising new development projects
Choice Set Type
Residential Buildings
Non-residential Buildings
Parcels
Filter (to be included in the universal choice set)
At Least 1 Vacant Unit Available. Vacancies are created by New Construction and Occupants Moving Out.
Sufficient Vacant Space for Locating Business. Vacancies are created by New Construction and Occupants Moving Out.
Sufficient Development Capacity to Accommodate Project
Sampling of Alternatives
30 total: 1 chosen and 29 randomly sampled non-chosen
30 total: 1 chosen and 29 randomly sampled non-chosen
30 total: 1 chosen and 29 randomly sampled non-chosen
Submodels (separate speci cation and estimation)
Number of Workers in Household
Employment Sectors: NAICS-based
Four Residential and Two Nonresidential Types
Principal Variables in Utility Function (preliminary speci cation to be extended a er initial testing)
• Housing Type • Income of Household • Parcel Land Area • Unit Square Feet • Building Year Built • Units on Parcel • Jobs in Zone • Households in Zone • Access by Mode to Jobs
• • • • • •
• Land Value • Land Area • Avg Income in Zone • Households in Zone • Businesses in Zone • Access by Mode to Jobs
• • • •
Building Type Building Sq. Number of Stories Parcel Land Area Building Year Built Zonal Jobs by Sector Businesses in Zone Households in Zone Avg Income in Zone Job Access by Mode
()
the estimation results in more detail was not feasible due to the volume of results, but these are recorded in a project report, and are subject to ongoing model improvement. e household location choice model was estimated using households located within San Francisco from the Bay Area Transportation Survey (BATS). is means that the model of choosing a housing unit within San Francisco re ects an implicit conditioning on the choice of living in San Francisco in the rst place. is conditioning is needed for the sub-regional application of the model in order to reconcile with externally imposed constraints on San Francisco population and employment. e estimation of the initial speci cation of the household location choice model re ects robust log-likelihood ratios for disaggregate location choice model at the building level, with log-likelihood ratios ranging from 0.12 for households with two or more workers to 0.28 for households with no workers. is lower t for 2+ worker households most likely re ects the greater diversity of considerations in the location choices of larger households with multiple commutes and locational considerations. e accessibility variables are generalized measures from a residence zone at this point, re ecting the travel time to destinations by mode. ey are not individual worker-speci c access to workplace measures, however. Workplace-speci c access requires full integration of the workplace choice model into UrbanSim, which has been done, but also requires running the travel model for each simulation year, which was too onerous at this stage of implementation, and these access variables were therefore excluded. e business location choice model uses business establishments rather than individual jobs as the unit of analysis, and considers both the sector and the size of the business when evaluating the feasibility of alternative locations. e businesses used for estimation were sampled from the population of businesses in each sector. Estimation results produced even higher log-likelihood ratios than for household location, ranging from 0.23 to 0.38. is is also better than results from prior models of employment location choice using a job as the unit of analysis, and is consistent with the business establishment as the decision-maker, and a natural unit of analysis. It is too early to say how general or robust these ndings are. In addition to these choice models, a real estate price model predicts the price per unit of each type of real estate, at a parcel level. is is structured as a hedonic regression, and is estimated using assessed values from the assessor database. e adjusted R-squared values for these models ranged from 0.12 to 0.71 based on preliminary speci cations mainly using lot area, building area, year built, zonal household and employment densities, zonal average income, and multi-modal accessibility to employment. A major concern in the price models, which would affect the other models indirectly, is the in uence of Proposition 13 in California, which maintains the stability of assessed values until a sale occurs. e values used to estimate these models are therefore a mixture of relatively current and older, arti cially low, values. is will need to be redone in the future using sales transactions for residential properties, and rental records for other properties.
8 Model assessment Model assessment was completed using the speci ed models presented in this paper, by running the full set of models on the full base year database, under a baseline scenario containing control totals derived from the land use forecasts generated by the Association of Bay Area For policy as well as for technical reasons, the model system relies on external control totals obtained from Association of Bay Area Governments.
e
Microsimpulating parcel-level land use and activity-based travel
Table 2: Goodness of Fit from Model Estimation
Choice Model
Submodels
Adj. Log-likelihood Ratio (N OBS)
Household Location Choice
0 workers 1 worker 2 or more workers
0.28 (4008) 0.17 (2947) 0.12 (3045)
Business Location Choice
1 Ag/Nat Resource 2 Manuf., Wholesale 3 Retail 4 Finance, Prof. Svcs. 5 Health, Education 6 Other
0.27 0.38 0.32 0.35 0.38 0.23
(63) (1350) (2018) (4001) (1089) (434)
Development Project Location Choice
1 Apartment 2 Condominium 5 Single-family 8 MIPS (Mgmt/Info/Prof. Services) 9 MIXED 13 Production/Distribution/Repair 14 Retail/Entertainment
0.30 0.55 0.12 0.58 0.71 0.16 0.16
(349) (1349) (1603) (241) (310) (63) (64)
Regression Model
Submodel (dep var)
Adj. R-squared (N OBS)
Real Estate Price Model
1 Apartment (ln price/unit) 2 Condominium (ln price/unit) 3 Flats (ln price/unit) 5 Single-family (ln price/unit) 7 CIE (ln price/sq. ) 8 MIPS (ln price/sq. ) 9 MIXED (ln price/sq. ) 13 PDR (ln price/sq. ) 14 Retail/Entertainment (ln price/sq. )
0.78 0.22 0.10 0.12 0.14 0.32 0.33 0.17 0.15
(20 588) (11 158) (15 706) (95 355) (613) (1562) (2707) (1755) (2660)
Governments (ABAG). e process involved iterations of running the models, diagnosing and addressing problems, and repeating the process, all within the limited constraints of the project budget and schedule. is section provides a summary of the results from the most recent runs of the model system. e land use model application, unlike a travel model system, cannot be simply calibrated or validated cross-sectionally. In fact, it is dubious to do this even for a travel model system, but that topic is beyond the scope for this paper. e most generally accepted approach to validating a land use model system is to use a back-casting procedure, beginning the model from one observed period in the past and running it until another observed point (preferably rea-
()
sonably current). Using this approach, it is possible to compare the simulated results over the forecasting period to the observed results. For this application, the base year for the model and its initial database was established as 2001, close to the 2000 census, but using much improved parcel data available for 2001. e data to which the simulation results are compared are from the 2007 ABAG forecasts, summarized by census tract. e 2000 gures from the ABAG results are assumed to be observed data, and are compared with the 2001 base year data used to begin the simulation of UrbanSim. e 2007 data from ABAG represent observed data. e control totals are closely matched by the simulation output. Control totals for households were speci ed using intervals for household sizes of 3–4, 5–6, and 7 or more persons. In order to compute the target population implied by this control total, the estimates below assume mid-points of 3.5 persons, 5.5 persons, and 7.5 persons for the last category. ese are likely to be high estimates of the population control total since the distribution is likely to be skewed. Nevertheless, as shown in Table 3, the simulated totals match exceptionally well the control totals, with both less than one half of one percentage points different in 2007 and 2020, in spite of setting control totals in terms of jobs and population while simulating businesses and households. Table 3: Control Totals
Year
Variable
Control Total
Simulated
Difference (%)
2007 2020
Population Population
770 627 826 356
767 507 822 961
−0.407 −0.413
2007 2020
Employment Employment
568 861 684 319
568 732 683 574
−0.002 −0.109
Two factors should be kept in mind about this backcasting exercise. One is that the period is relatively short, while the model forecasting horizon is typically on the order of 30 years, to coincide with the transportation planning horizon year. e second is that over the 2001–2007 period used for this exercise, the Bay Area was suffering from a signi cant recession; the economy contracted signi cantly early in the period and again a er this period owing to the current economic crisis that has reached global proportions. Finally, it is clear that there are quite signi cant differences between the data being used to begin the UrbanSim simulation in 2001 and the 2000 values from ABAG. ese initial differences are in some cases quite substantial. Interestingly, most of the largest differences in initial conditions begin to converge as the simulation proceeds. Two measures of error are reported in the tables below. One is the mean absolute nominal error (MANE), which is the mean of the absolute value of the actual − observed data value in each census tract, indexed by i , with n representing the total number of census tracts: n 1∑ A − P MANE = (1) i i n i =1 e second is the mean absolute percentage error (MAPE), or the mean absolute nominal error divided by the actual value: n A − P 1∑ i i (2) MAPE = n i =1 Ai
Microsimpulating parcel-level land use and activity-based travel
As is clear from the average results above, there are some signi cant deviations between observed data and the inputs to the simulation, particularly in terms of employment. Further, the total of the initial employment in the base year is considerably lower than the observed totals. is explains the relatively high MANE and MAPE values for employment, compared to households. More details on the model application and validation results are available in a technical report (Waddell 2009). It is valuable to note that the discrepancy between observed and predicted values actually declined over the validation period, with simulation results narrowing the difference between the initial base year data. Table 4: Longitudinal Validation Results
Variable
2001
2005
Households: MANE Employment: MANE
418 2824
295 2198
Households: MAPE Employment: MAPE
0.3090 1.2484
0.1677 1.4438
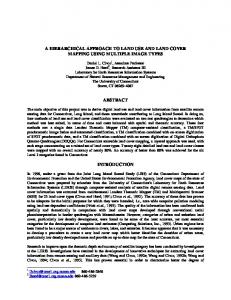
9 Simulation testing and computational performance Although the model system as described is still in early stages of re nement (based on the need to address problems in input data and re-estimate the models with updated data), it is still quite helpful in a model development project to run a model system and assess computational performance issues and general plausibility of results. For this purpose, we ran the land use model system in isolation rst, using base year skims from the travel model and not updating them with interactive use. We subsequently automated the connection between UrbanSim and SFCHAMP in order to test the mechanics of the model interfaces and the capacity to fully automate the model system. Both of these tests have been successfully completed, and generate insights into how to further develop the integrated model system. Land use model computational performance in UrbanSim has been surprisingly good, considering the parcel and building level of spatial detail, with run times of averaging just over one minute per simulation year, or approximately one half hour for a 30-year simulation, on a desktop computer with an Intel I7-920 processor, assembled in 2009 for under $1000 and running Linux. For comparison purposes, run times for the same model were two to three minutes per simulation year on a dual-core laptop running OS X. Run times on Windows were slower than either Linux or OS X, at around seven minutes per year, but on a somewhat older desktop computer. All of these run times are without the bene t of multi-threading or parallelization, which will be considered for future development. Unfortunately, computational performance of the travel models is orders of magnitude longer for each simulation year—though it is running for the full 9-County Bay Area region. Version 4 SF-CHAMP runs on an 8-core AMD Opteron 2360 SE with 32 GB of RAM. During assignment, in Citilabs Cube Cluster, 4 additional distributed processors are utilized. Combined run times for one simulated travel day using Version 4 of SF-CHAMP, are 36 hours on this hardware. Work on reducing the run times signi cantly is in progress.
()
e long run times for the travel model require interacting land use and transportation models only every several years. Running the travel model every ve years of a 30-year simulation period would require 216 hours, or nine days of computation, if run for the full region and using the full set of iterations feeding back assigned travel times to earlier stages of the model. To address the long run times, since the precision needed in nal target year for the travel model is not needed for intermediate years in order to provide feedback between the land use and travel models, the number of iterations within the travel model system was signi cantly reduced for the interim years is produced a combined run time for the interacting land use and travel model system of approximately 48 hours to simulate a 30-year scenario. ese run times, even with streamlining, are long enough that it raises the prospect that integrated land use and transportation modeling will require a major breakthrough in computational performance on the travel models, in addition to strategic simpli cations. Long run times are not exclusively the domain of activity-based travel models—the push for more detail in zones, trip purposes, modes, and times of day in traditional aggregate four-step models has also in ated the run times of many of these more traditional models. Figure 4 is a screenshot of the OPUS Graphical User Interface, containing a mapped parcellevel indicator of total residential units from 2030, the nal simulation year of the test scenario. e map is generated using built-in mapping capabilities and uses a modi ed shape le to render the image. Animated maps can also be generated using the indicator visualization in OPUS, allowing quick visual assessment of trends over time in spatially explicit indicators such as the residential units shown in this gure, various aggregated indicators at zone level, or higher geographies. In general, displaying parcel level results is potentially distracting and problematic for public stakeholders, but may be a valuable tool to quickly visualize artifacts in the data that would be obscured by aggregation to higher units of geography. Early assessment of the simulation results reveals spatial dynamics that are in many respects plausible, and in other respects point to the need for re nement of the model speci cations and con guration of some models. For example, one area showed an increase in households but a decline in total population; on inspection, this area appeared to contain households with unusually high household sizes compared to the city average. In this case, it may re ect concentration of ethnic groups with higher average household size than the citywide average, and suggest the need to more explicitly represent the role of social and cultural clustering within neighborhoods. Adding these types of variables is straightforward to do technically, by adding interaction terms to the household location choice model, but this may prove more difficult in an applied planning setting where there may be political difficulties in representing such ethnic clustering behavior in models. It may be necessary to represent the effect with other proxies, such as income and household size. Another example of results that will lead to a model re nement is an observed trend in the simulation to move jobs away from residential areas. is turns out to be an artifact arising from not allowing businesses to locate in residential properties in the model con guration. Homebased businesses can and should be represented in the base-year data, and in the modeling as it moves forward in time. e issue has been addressed in other applications of UrbanSim, such as in Seattle, and adapting it to this application should be straightforward, adding a home-based business location choice model to the con guration, and estimating the locational tendencies present in the observed data.
Microsimpulating parcel-level land use and activity-based travel
Figure 4: Simulation Results Displayed in the OPUS Graphical User Interface
10 Conclusions and future research is paper has described the development and implementation of a new integrated land use and transportation model system and its application in San Francisco. Its novelty arises from several features that have not been previously combined in an operational model system, including: 1) the use of parcels and buildings as units of location for consumers and developers of real estate, 2) the use of business establishments to represent economic activity, and 3) the interfacing of this microsimulation land use model with a microsimulation activity-based travel model. One noteworthy methodological result is that the extreme level of disaggregation of the model, using individual business establishments, households, buildings, and parcels for the whole of San Francisco, generated remarkably robust estimation results. e goodness of t on the estimated models was generally higher than has been the case with previous applications using grid cells or zones as units of analysis, in spite of considerable noise in the data. e development of this model system over approximately one year, with additional time for testing and data re nement, demonstrated that the use of a modular model development platform such as OPUS can support productive model development and innovation. e estimation of model parameters was done within the same so ware platform, eliminating a common source of complexity and inefficiency in developing an operational model. Further research has begun regarding re ning the real estate development model to re ect a variety of development project patterns and templates: re ning the process of calibrating uncertainty in model systems such as this, visualizing the simulation results in 2D and 3D, and integrating with dynamic traffic assignment. Modeling the evolving geometry of parcel subdivision and aggregation for redevelopment is planned for future research, as is the evolution of local streets (Levinson and Huang 1997). Operational use of the model system in the Planning Department and SFCTA is planned in coming months.
()
is project documents another forward step along the path towards behaviorally integrated and realistic models to support coordinated planning of land use, transportation, and environment. It is particularly salient in the context of California, which has adopted legal mandates to coordinate land use and transportation to meet climate change targets. ere is, of course, much more to do. e path ahead suggests the need to improve methods for data cleaning and imputation, in order to make the task of developing a robust and internally consistent database much easier to accomplish. On the modeling front, it suggests more ne-grained and tighter coupling of the microsimulation in the land use model with that in the activity-based model, and eventually, passing individual information all the way through dynamic assignment, so that individuals can be traced through the model system completely, both for behavioral delity and for equity analysis. Finally, we will need to think carefully about which details are really needed in an integrated modeling framework if we are to achieve integrated systems that are truly useful in allowing users to readily create and model the effects of many scenarios quickly enough to be responsive to stakeholders. Of course, faster computers and more clever optimizations will also be helpful in this task, but we still need to make thoughtful assessments of where the details are helpful and where they are merely slowing the models down.
Acknowledgements is research has been funded in part by the San Francisco County Transportation Authority, by grants from the National Science Foundation (IIS-0705898 and IIS-0534094), by a grant from the United States Environmental Protection Agency (R831837), and by the University of California MRPI on Transportation Sustainability. e assistance of Jeffrey Hood in re ning the interface between UrbanSim and SF-CHAMP is also gratefully acknowledged, as are Elizabeth Sall and Lisa Zorn at SFCTA for their assistance.
References Arentze, T., F. Hofman, H. van Mourik, and H. Timmermans. 2000. ALBATROSS: Multiagent, rule-based model of activity pattern decisions. Transportation Research Record: Journal of the Transportation Research Board, 1706:136–144. doi: 10.3141/1706-16. Bhat, C. R., J. Y. Guo, S. Srinivasan, and A. Sivakumar. 2004. Comprehensive econometric microsimulator for daily activity-travel patterns. Transportation Research Record: Journal of the Transportation Research Board, 1894:57–66. doi: 10.3141/1894-07. Bierlaire, M., D. Bolduc, and M. Godbout. 2004. An introduction to BIOGEME (Version 1.0). Ecole Polytechnique Fédérale de Lausanne, Lausanne, Switzerland. URL http://roso.epfl. ch/mbi/biogeme/doc/tutorial.pdf. Bowman, J. and M. Ben-Akiva. 1999. e day activity schedule approach to travel demand analysis. Paper presented at the 78th Annual Meeting of the Transportation Research Board, Washington, D.C. Bowman, J. and G. Rousseau. 2006. Validation of the atlanta (arc) population synthesizer (popsyn). TRB Conference on Innovations in Travel Modeling, Austin, Texas, May 21–23. Bradley, M., J. Bowman, and T. K. Lawton. 1999. A comparison of sample enumeration and stochastic microsimulation for application of tour-based and activity-based travel demand models. In European Transport Conference. Cambridge, UK.
Microsimpulating parcel-level land use and activity-based travel
Bradley, M., J. Bowman, T. K. Lawton, M. Ben-Akiva, T. Rossi, and Y. Shi an. 1998. A system of activity-based models for Portland, Oregon. Technical report, Federal Highway Administration Travel Model Improvement Program, Washington, D.C. de la Barra, T. 1989. Integrated Land Use and Transport Modelling. Cambridge Urban and Architectural Studies. Cambridge, UK: Cambridge University Press. Echenique, M. H., A. D. J. Flowerdew, J. D. Hunt, T. R. Mayo, I. J. Skidmore, and D. C. Simmonds. 1990. e MEPLAN models of Bilbao, Leeds and Dortmund. Transport Reviews, 10(4):309–322. doi: 10.1080/01441649008716764. Hunt, J. D., D. Kriger, and E. J. Miller. 2005. Current operational urban land-usetransport modelling frameworks: A review. Transport Reviews, 25(3):329–376. doi: 10.1080/0144164052000336470. Kitamura, R. 1997. Applications of models of activity behavior for activity based demand forecasting. In Activity-Based Travel Forecasting Conference. New Orleans, LA: Texas Transportation Institute, Texas A&M University. Kitamura, R., C. Chen, R. M. Pendyala, and R. Narayanan. 2000. Micro-simulation of daily activity-travel patterns for travel demand forecasting. Transportation, 27(1):25–51. doi: 10.1023/A:1005259324588. Levinson, D. and Y. Huang. 1997. Windowed transportation planning model. Transportation Research Part A: Policy and Practice, 1607:45–54. doi: 10.3141/1607-07. McNally, M. 2000. e activity-based approach. Technical Report UCI-ITS-AS-WP-00-4, Institute of Transportation Studies, University of California, Berkeley, CA. Olsen, A. 2004. Boom, Bust and Land Use Planning in San Francisco: Re-making the City Between Entropy and Contingency. Master’s thesis, University of Copenhagen, Copenhagan, Denmark. Outwater, M. and B. Charlton. 2008. e San Francisco model in practice: Validation, testing, and application. In Innovations in Travel Demand Modeling: Summary of a Conference. Volume 2: Papers, number 42 in Transportation Research Board Conference Proceedings, pp. 24–29. Transportation Research Board, Washington, D.C.: Transportation Research Board. URL http://onlinepubs.trb.org/onlinepubs/conf/CP42v2.pdf. Pendyala, R. M., R. Kitamura, A. Kikuchi, T. Yamamoto, and S. Fujii. 2005. Florida activity mobility simulator: Overview and preliminary validation results. Transportation Research Record: Journal of the Transportation Research Board, 1921:123–130. doi: 10.3141/192114. Putnam, S. 1983. Integrated Urban Models. London: Pion Ltd. Rickert, M. and K. Nagel. 2001. Dynamic traffic assignment on parallel computers in TRANSIMS. Future Generation Computer Systems, 17(5):637–648. doi: 10.1016/S0167739X(00)00032-7. Salvini, P. and E. J. Miller. 2005. ILUTE: An operational prototype of a comprehensive microsimulation model of urban systems. Networks and Spatial Economics, 5(2):217–234. doi: 10.1007/s11067-005-2630-5. San Francisco Planning Department. 2002. Industrial land in San Francisco: Understanding production, distribution, and repair. Technical report, San Francisco Planning Department. URL http://www.sf-planning.org/Modules/ShowDocument.aspx?documentid=4893. Simmonds, D. C. 1999. e design of the DELTA land-use modelling package. Environment and Planning B: Planning and Design, 26(5):665–684. doi: 10.1068/b260665.
()
Storper, M. 1997. e regional world: Territorial development in a global economy? New York: Guilford Press. Timmermans, H., T. Arentze, M. Dijst, E. Dugundji, J. Chang-Hyeon, L. Kapoen, S. Krijgsman, K. Maat, and J. Veldhuisen. 2002. Amadeus: A framework for developing a dynamic multiagent, multi-period, activity-based micro-simulation model of travel demand. In Proceedings of the 2002 TRB Annual Meeting, Proceedings of the 81st Annual Meeting. Washington, D.C.: Transportation Research Board. Waddell, P. 1998. e Oregon prototype metropolitan land use model. In S. Easa and D. Samdahl, eds., Transportation, Land Use and Air Quality: Making the Connection, pp. 549–558. Reston, VA: American Society of Civil Engineers. Waddell, P. 2000. A behavioral simulation model for metropolitan policy analysis and planning: Residential location and housing market components of UrbanSim. Environment and Planning B: Planning and Design, 27(2):247–263. doi: 10.1068/b2627. Waddell, P. 2002. Modeling urban development for land use, transportation, and environmental planning. Journal of the American Planning Association, 68(3):297–314. doi: 10.1080/01944360208976274. Waddell, P. 2009. Model documentation: UrbanSim land use models, San Francisco application. Technical report, San Francisco County Transportation Authority. Waddell, P., A. Borning, H. Ševčíková, and D. Socha. 2005. Opus: An open platform for urban simulation. In Proceedings of the Ninth International Conference on Computers in Urban Planning and Urban Management. Computers in Urban Planning and Urban Management Conference. Wolfe, M. 1999. e wired lo : Lifestyle innovation diffusion and industrial networking in the rise of San Francisco’s Multimedia Gulch. Urban Affairs Review, 34(5):707–728. doi: 10.1177/10780879922184158.