NATSEM
www.natsem.canberra.edu.au 23 May 2011
”Microsimulation and Policy Design” 3rd General Conference of the International Microsimulation Association Stockholm, Sweden, 8-10 June 2011
Title:
A Model of Riches - Modelling wealth in the APPSIM dynamic microsimulation model
Authors:
Marcia Keegan and Simon Kelly
Organization: The National Centre for Social and Economic Modelling, University of Canberra Mail:
NATSEM University of Canberra Canberra ACT 2601 Australia
E-mail:
[email protected]
Telephone:
+61 2 6201 5310
Fax:
+61 2 6201 2751
NATSEM
www.natsem.canberra.edu.au
2011 International Microsimulation Association Conference
This report uses unit record data from the Household, Income and Labour Dynamics in Australia (HILDA) Survey. The HILDA Project was initiated and funded by the Australian Government Department of Families, Housing, Community Services and Indigenous Affairs (FaHCSIA) and is managed by the Melbourne Institute of Applied Economic and Social Research (Melbourne Institute). The findings and views reported in this paper, however, are those of the authors and should not be attributed to either FaHCSIA or the Melbourne Institute.
A MODEL OF RICHES - MODELLING WEALTH IN THE APPSIM DYNAMIC MICROSIMULATION MODEL BY MARCIA KEEGAN AND SIMON KELLY
INTRODUCTION Dynamic microsimulation models have been increasing in popularity as populations age. First proposed by Guy Orcutt in 1956 (2007), dynamic microsimulation models simulate interacting individuals changing behaviour over time, providing a detailed, changing picture of the distribution of the population, rather than merely aggregates. Starting with a cross-section of the subject population, dynamic ageing is used to update each individual within the model for each time interval, thus each individual is simulated through time (Harding and Gupta 2007). Using this method, the heterogeneity of populations, and the impact of policy, can be simulated. In 2002, the Australian Treasury released its first Intergenerational Report (Treasury 2002), warning that if Australian government policies were not adjusted, the government spending would be about 5.0 per cent of GDP greater than government revenue by 2042. These findings have been revisited twice to incorporate changes to demographics and policy (Treasury 2007, Treasury 2010). These subsequent reports have been becoming less pessimistic, suggesting that these demographic and policy changes are having an impact. However, even the most recent findings suggest spending will exceed revenue by 2.7 per cent of GDP, due to increases in old age pension, health care and aged care expenditure. In response to these concerns about the ageing of the population, the National Centre for Social and Economic Modelling has developed APPSIM, the Australian Population and Policy Simulation Model, a dynamic population microsimulation model, to simulate the distributional impact of policies that can affect the ageing population. Many international dynamic microsimulation models are primarily concerned with the long-term sustainability of public defined benefit pension schemes, such as DYNASIM (Favrealt and Smith 2004), DYNACAN (Morrison 2009), and SAGE (Evandrou, et al. 2007). In such schemes, the calculation of pension entitlements is not dependent on a person’s wealth or other income, so there is limited value in simulating wealth accumulation in such models (although Sweden’s SESIM simulates some accumulation and disposal of wealth
1
NATSEM
www.natsem.canberra.edu.au
2011 International Microsimulation Association Conference
(Flood, et al. 2005, Flood 2008)). However, Australia has never had a public defined benefit pension scheme covering the whole labour force. Unlike the retirement income systems of most other countries that are based on earnings histories, Australia’s unusual retirement income system is only based on the current private income and assets of a person – see Kingston (2004) for a thorough comparison of Australian and overseas retirement systems. This means patterns of saving and wealth accumulation are important factors in the sustainability of future Australian government budgets. Capturing the retirement savings behaviour of Australians over their lives is an important aspect of the APPSIM model. This paper first describes Australia’s provision for the elderly in retirement, and why wealth accumulation is important. Next Australia’s patterns of wealth accumulation and drawdown over the life course are presented. Then the operation of APPSIM and how wealth is modelled is discussed. Finally, the paper discusses outputs of the wealth module in APPSIM.
AUSTRALIA’S RETIREMENT PROVISION SYSTEM Australia’s rather unique retirement income system means that the distribution of wealth in Australia can have a significant impact on future budgetary pressures. Australia operates a ‘three pillar’ retirement system, similar to that proposed by the World Bank (1994). The three pillars are: 1. The age pension 2. Compulsory retirement savings 3. Voluntary retirement savings These pillars are discussed below. The Age Pension
Most Australians will, at some stage in their lives, receive the Age Pension. This payment is a means-tested pension, funded out of current taxation revenue, to men aged 65 years and over and women aged 64 and over (the eligibility age for women is increasing and will be equal with men’s eligibility age by 2015). From 2017-2023, the age of eligibility will be increased to 67 years (Treasury 2009). Unlike government-provided pensions in many other OECD nations, the payments are not based on employment history but rather on the current means of the person (and their spouse). In addition to the age and means criteria, Age Pension recipients must be permanent residents who have met certain duration of residency requirements. The maximum pension rate a single person can receive is $670.90 per fortnight, and couples can receive up to $505.70 each (Centrelink 2011). These rates are indexed to growth in male full-time ordinary time earnings. The means test has two elements – an income test and an assets test – and the lower payment resulting from these two tests is the one paid. The income test tapers the amount of pension received if a single person earns more than $146 per fortnight or a couple earns more than $256 per fortnight; and the assets test tapers the
2
NATSEM
www.natsem.canberra.edu.au
2011 International Microsimulation Association Conference
pension received for singles who have more than $181 750 (if a homeowner, excluding home value) or $313 250 (if a non-homeowner), and for couples who have more than $258 000 (if homeowners, excluding home value) or $389 500 (non-homeowners) (Centrelink 2011). In 2008, 77 per cent of people aged 65 years and over received income support (either a full or part pension) from the Government (Harmer 2008). Compulsory superannuation
In 1993, the Superannuation Guarantee legislation was introduced that required employers to contribute a certain percentage of an employee’s wages into a retirement savings (“superannuation”) account, which would be available for use at his or her retirement. This compulsory defined-contribution scheme was designed to improve living standards in retirement and reduce reliance on the age pension. The amount was initially set at three per cent of an employee’s wages, and has since been increased to nine per cent (Bateman and Ablett 2000). The reason for this Superannuation Guarantee is that Australia has never had a compulsory defined-benefit pension plan. A number of government or employer provided pension programs have existed, but coverage was generally low with less than half the population having any sort of pension coverage (Nielson and Harris 2008). Voluntary savings/superannuation
In addition to the Superannuation Guarantee, a number of incentives exist to encourage people to contribute more than the minimum nine per cent to superannuation. Low income earners can add up to an additional $1000 per year to their superannuation and have it matched dollar for dollar by a government contribution; and, high income earners can reduce their tax obligation by sacrificing their earnings into superannuation (Kingston 2004). In addition to this, some people save for retirement through buying shares, real estate or saving cash; this has the advantage that the capital and income stream are accessible before retirement, but does not receive the same tax advantages.
The means tested age pension (with its exclusion of the family home from the assets test) and the combination of compulsory and voluntary retirement savings illustrates the importance of modelling wealth accumulation in Australia. Higher earnings feed into higher compulsory superannuation contributions; while high savings rates feed into higher voluntary superannuation contributions and investments in shares and property. These factors combine to increase the wealth of Australians, reducing age pension entitlements and reducing future budgetary burdens.
3
NATSEM
www.natsem.canberra.edu.au
2011 International Microsimulation Association Conference
AUSTRALIA’S PATTERNS OF WEALTH ACCUMULATION Australia’s patterns of wealth accumulation have been influenced by a range of factors, from taxation and social security policy to culture, geography, migration and demographics. Owner-occupied dwellings and superannuation are the largest stores of wealth, savings accounts are almost universal and substantial minorities invest in other investments. Composition of wealth
For most households in Australia, the bulk of worth is held in owner occupied dwellings or the ‘the family home’. In 2005-06, the mean value of gross wealth in a household’s owneroccupied dwelling was $286 000. In 2005-06, roughly 70 per cent of households owned the dwelling in which they lived; half of these households owned the home outright, the other half owned it with a mortgage (ABS 2007). Culturally home ownership is seen as a major goal in Australia. A typical person or family will seek to purchase a home in their 20s or 30s with the goal of having the mortgage associated with the purchase paid out before they retire. Around 85 per cent of households in which the reference person is aged 55-74 own their homes. Reasons for the popularity of the family home as a savings vehicle are that the effective income from it (imputed rent) is tax free, capital gains are untaxed, and its value does not affect the amount of basic age pension one is entitled to. In addition to this, grants and concessions are available to people who wish to buy their first home. The second most valuable wealth class for Australian households approaching retirement is superannuation. Most Australians have some wealth in superannuation, with around 90 per cent of people aged 25-44 having some wealth in super. A lower proportion of older age groups have superannuation; they have had the opportunity to draw down their superannuation and they represent cohorts who have not worked as employees since the superannuation guarantee was introduced in 1992 (Kelly and Gong 2010). Naturally, young people at the start of their working lives have little in superannuation (households headed by 25-34 year olds have $36 000 in superannuation) while households headed by a 55-64 year old have an average of $162 000 in superannuation (ABS 2007). The next most valuable investment for Australian households in 2005-2006 was other real property. Property investment is popular in Australia, with nearly a quarter of households owning at least one other property, and 30 households aged 55-64 owning at least one other property (ABS 2007). Most commonly these other properties are holiday houses or rental properties (although holiday houses can be rented out when the owners are not using them). In 2008-09, 2.3 million Australians claimed either rental income or rental deductions on their income tax returns (ATO 2011). Share investing is popular with Australians, both direct (buying shares directly through a broker) or indirect (buying into a managed fund, excluding managed superannuation funds). Research by the Australian Stock Exchange found that direct share ownership (including investment through self-managed superannuation funds) among Australian adults was 39 per cent in 2010. This figure has hovered around 40 per cent since 1999,
4
NATSEM
www.natsem.canberra.edu.au
2011 International Microsimulation Association Conference
although interest in indirect share investing has declined sharply since then, from 38 per cent of adults to 13 per cent (ASX 2011), possibly in response to the 2008 global financial crisis. Direct ownership of shares becomes more common at older age groups. Only 17 per cent of 15-24 year olds and 31 per cent of 25-34 year olds hold wealth in shares. This increases to just over 50 per cent amongst 55-74 year olds (Kelly and Gong 2010). A greater percentage of households own shares directly compared to investment properties, but average net wealth in investment properties is higher ($22 000 in shares compared with $60 000 net investment property equity). This is probably in part because of the property boom in Australia pushing up house values and the ability to purchase shares in small parcels without the need for leverage. Almost everyone in Australia has some sort of bank account (Kelly and Gong 2010), while the majority of this is of low value in transaction accounts, some people have significant levels of savings in this form. Lower amounts of wealth tend to be held in cash deposits compared with other stores of wealth. This is because cash savings are more liquid, but generally provide lower returns than shares or investment properties, and receive less favourable tax treatment. Some people do have large amounts of wealth in cash, but for most cash deposits are for a rainy day or saving for larger purchases, rather than long-term stores of wealth. A final source of wealth is a business. Businesses may be inherited, or built up over one’s working life. However, only 14 per cent of households have some wealth in a business (as opposed to shares) (Kelly and Gong 2010). Distribution of wealth
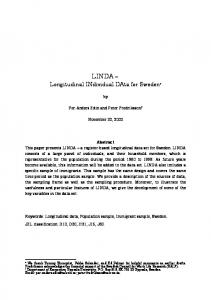
There is a clear relationship between the stage of the life course and the average level of household wealth. Wealth accumulates during a person’s working life, on average reaching its peak at retirement and then reducing in later life as the wealth is drawn down to fund the years post retirement. The wealth patterns over the life course can be seen in Figure 1.
5
NATSEM
www.natsem.canberra.edu.au
2011 International Microsimulation Association Conference
Figure 1
Household wealth by age group of reference person, 2005-06
900
Bank accounts Ow n home Shares Bonds
800
Wealth ($000s)
700
Superannuation Other property Trusts Ow n business
600 500 400 300 200 100 0 15-24
25-34
35-44
45-54
55-64
65-74
75 and over
Source: (ABS 2007)
In 2005-2006, households in the wealthiest quintile had gross assets of $1.7 million, while the poorest quintile had gross assets of $21 000 (Figure 2). In all but the poorest wealth quintile, wealth in the family home represented the greatest source of wealth (in the poorest quintile, superannuation represented the greatest source of wealth, reflecting compulsory superannuation and low homeownership rates among the poorest households.) The second largest source of wealth for second, third and fourth quintile households was superannuation; while among the wealthiest households, other real property and wealth in one’s own business represented a larger share of wealth than superannuation. Figure 2
Wealth type by household net wealth quintile, 2005-06
2,000 1,800 1,600
Bank accounts
Superannuation
Ow n home
Other property
Shares
Trusts
Bonds
Ow n business
Wealth ($000s)
1,400 1,200 1,000 800 600 400 200 0 Low est
Second
Third
Fourth
Highest
Source: (ABS 2007)
6
NATSEM
www.natsem.canberra.edu.au
2011 International Microsimulation Association Conference
THE AUSTRALIAN POPULATION AND POLICY SIMULATION MODEL (APPSIM) As discussed in the introduction, in response to projected ageing population pressures the National Centre for Social and Economic Modelling has built a dynamic microsimulation model called the Australian Population and Policy Simulation Model. Although a number of models exist to project the aggregate impacts of policy change, there was desire for a model that could show the distributional impacts – the impacts on individuals and specific subsets of the population. This project, funded by the Australian Research Council and in partnership with 12 Australian Government organisations began in 2005 and although the model is largely completed, it is still subject to further development. APPSIM begins with a 188 000 sample from the 2001 population census, which forms the base data. The population can grow or shrink over time through births, deaths, or overseas migration. Each individual within this base data is subject to annual transitions in their family status, education, labour force status, earnings, wealth and health, to give both an annual snapshot of the characteristics of the population and a longitudinal perspective on how individuals, families and households change over time. Transition equations are based on a number of data sources, the most commonly used is the Household, Income and Labour Dynamics in Australia (HILDA) Survey, a longitudinal survey conducted every year from 2001 with an initial sample size of around 17 000 individuals. Figure 3 shows the flow of modules within APPSIM.
Figure 3
APPSIM flow chart
Source: NATSEM
7
NATSEM
www.natsem.canberra.edu.au
2011 International Microsimulation Association Conference
APPSIM is capable of projecting the Australian population out to 2051. Further information about the operation of APPSIM, its data sources and components can be found at http://www.natsem.canberra.edu.au.
MODELLING WEALTH IN APPSIM Wealth in APPSIM has a value that is accumulated over the working life, and drawn down in retirement, with the residual passed on to surviving spouses and children. It is not possible to capture the full heterogeneity of wealth accumulation and drawdown over the life course, so some generalisations and assumptions have been made. In a typical family, children start out with no individual wealth, and have minimal wealth by the time they leave home (although if their parents die, they may inherit wealth). As they earn income, they start to contribute to compulsory and possibly voluntary superannuation, and save some of their earnings. They may buy a family home. When they have substantial enough cash savings outside of superannuation, they can buy investment property or shares. If a person is employed, they will save or reinvest the income from these assets. Upon retirement, individuals need to reorganise their finances. They may draw down their superannuation, retire debt and sell investment properties. They cease to save and reinvest the returns from their assets and start using this income for consumption instead. In some circumstances, they may draw down asset wealth and live off the proceeds. One difficulty in modelling wealth arises from the fact that wealth can owned by an individual, a couple or a household (although individual or couple ownership is most common). Superannuation can only be held by the individual that earns the money that goes into the superannuation account. Savings and shares can be held either by individuals or jointly owned by a married or de facto couple; they can also be jointly owned by other family members but this is much less common. Real property, such as the family home or investment property, is typically held in joint names if purchased by a couple. In APPSIM, ownership of wealth is allocated in the following way: • Cash savings, superannuation and shares are held by individuals. • Real property (family homes and investment property) are held by households. • Real property and the personal assets of all members of a household are summed to provide a household level estimate of household wealth.
DATA SOURCES As mentioned in the introduction, the source data for the base data of APPSIM is a one per cent sample file from the Australian Bureau of Statistics (ABS) 2001 Census (ABS 2002). This file does not contain any wealth information. However, it does contain household level housing tenure. To provide initial estimates of household and personal wealth, data from the ABS 2003-04 Survey of Income and Housing unit record file and wave 2 (2002) of
8
NATSEM
www.natsem.canberra.edu.au
2011 International Microsimulation Association Conference
the HILDA survey are used to impute values onto the base data. Both of these surveys contain estimates of current real property values and loans, cash deposit balances, superannuation balances, and current values of share portfolios. Both surveys also include estimates of outstanding education loans (HECS debt) and other personal debts.
WEALTH ACCUMULATION Wealth accumulation comes from saving a proportion of the earnings of the individual or from income generated by investments. Initially these savings or investment income are stored as cash (with the exception of property values which are re-estimated each year). As the balance of cash savings increases other forms of asset type are considered. These include homeownership, purchase of publicly listed shares, purchase of investment properties, and reducing debt. Savings
For most people, their prime method of wealth accumulation will be saving a percentage of their earnings. There is significant variation in the proportion of income a person saves (Kelly and Gong 2010). In an attempt to capture this variation in APPSIM, the amount a person saves is a function of the base savings rate (default is two per cent) multiplied by a random number and their income quintile. In this way, wealthier people save a greater percentage of their income on average, but the element of randomness allows frugality and lavishness to be represented across all deciles. Cash Deposits
It is assumed that the first $5 000 of a person’s savings are kept in a general transaction account, and thus are subject to a low rate of interest; while any further savings above this amount are kept in a high interest account or term deposit. The default high and low interest rates are based on historical rates up to the current day, and five per cent and 0.2 per cent for high and low interest rates in the future. Interest paid is classified as ‘other income’ and if the recipient is not retired, it is deemed to be reinvested – that is, it is added to the cash balance each year. Superannuation
Superannuation wealth grows by three methods: the compulsory employer Superannuation Guarantee contributions, voluntary contributions and superannuation earnings. It is assumed in APPSIM that all employees receive their full Superannuation Guarantee entitlements; that is, if they are earning more than $450 per month, an amount equal to nine per cent of their earnings for that year is placed into superannuation. No defined contribution schemes are simulated. However, 20 per cent of people are assumed to have double the rate of compulsory contributions, which represents the generous superannuation schemes of most public sector employers.
9
NATSEM
www.natsem.canberra.edu.au
2011 International Microsimulation Association Conference
In addition to this, some individuals will voluntarily contribute to superannuation. The probability that a person will contribute additional amounts to their superannuation is drawn from a probability distribution based on the ABS’ Employment Arrangements, Retirement and Superannuation survey and each individual’s age group and sex. The amount of the extra contribution they make (as a percentage of their gross income) is estimated according to percentages for each age group. Finally, superannuation funds earn returns, which are reinvested in the personal superannuation accounts, and cannot be spent by non-retirees. Superannuation returns in APPSIM are based on historical growth rates (where available) and beyond this, the long term average superannuation returns. Buying an owner-occupied dwelling (family home)
In Australia, modelling the decision to purchase a home is extremely difficult. The combination of government grants, concessions for first home buyers, guarantor loans, and low-doc loans have made it possible for many people formally ineligible for a housing loan to qualify for one. For this reason, a household need not have a store of cash savings to purchase a residential property. Against this easy access has been the rising price of housing with the result that homeownership has been extremely stable at 70 per cent of all households over a number of decades. Therefore, the decision to purchase a home in APPSIM is not based on the amount of savings available but rather an age-based probability table. In other words APPSIM assumes that the Australian financial system will continue to modify it lending criteria (as it has done of the last few decades) to ensure that current access to homeownership by age group is maintained into the future. Once a household takes the decision to purchase a property, a value is assigned to the property and if necessary a mortgage is established. All non-homeowners in private dwellings are assumed to be renting and a weekly rental rate is estimated for that household. Annual mortgage repayments are made. It is assumed that people will pay down five per cent of the principal each year or $5000, whichever is greater, until the mortgage is paid out. In addition to this, if a household accumulates more than $20 000 in cash, they will put half of it, ie $10 000 on the mortgage, reducing the overall balance owed. The value of the home is updated every year based on historical house price growth data. Buying an investment property
If a household accumulates more than $50 000 in cash at the end of any simulated year, then they are assumed to purchase an investment rental property. While rental properties are a household asset, the deposit for the property is raised come from the individual household members’ cash deposits and share portfolios. Half of each household member’s cash and 70 per cent of each household member’s share portfolio are used as a deposit. An upper limit of $100 000 contribution from each person is set. It is assumed that the deposit represents 30 per cent of the value of the investment property and a rental property loan is
10
NATSEM
www.natsem.canberra.edu.au
2011 International Microsimulation Association Conference
used to finance the remaining 70 per cent of the purchase price. (Note that APPSIM does not stipulate how many investment properties are purchased, this may represent one investment property or several inexpensive properties). Each year, the value of investment property is updated based on historical data. For simplicity, while the members of the household are not retired it is assumed that the household makes interest-only payments on the loan and that the rent received from the properties covers all costs and the interest on the associated loans. That is, it is assumed that no net income is earned and no principal is repaid. Buying shares
If a person accumulates more than $20 000 in cash and they do not have an outstanding home mortgage, they face a chance of either spending some of their cash or buying shares. The probability of a person spending their savings is dependent on their age group, with the youngest and oldest age groups more likely to spend their savings. People who are deemed to spend will spend half of their savings, and since the money is determined to be spent on cars, holidays and so forth, the money disappears from APPSIM. Of those who have more than $20 000 in cash and do not spend it, twenty per cent will use half of their savings to buy shares. Shares both grow in value over time and pay out dividends. Share price growth rates are based on historical returns and projections, and values of share portfolios are updated every year. Dividends are paid out every year, and dividend payouts are assumed to be the same as the interest rate on high interest accounts. This annual dividend is added to the cash deposits of the share owner. Transferring Wealth
People only inherit personal wealth (cash, shares, or superannuation) on the death of another person. On the death of a person, all personal wealth will transfer to the beneficiary or beneficiaries. The beneficiary is will be the spouse, if a spouse does not exist than it will be the current defacto partner, if neither a spouse or partner exist then the inheritance will transfer to the children. That is, in APPSIM, parents do not transfer wealth to their children except upon their death. Household level wealth (that is the family home and other properties) does transfer on couple formation and couple dissolution. If a person is an adult in one household and moves to another household, then a proportion of the total wealth of the old household transfers to the person moving to a new household. The proportion varies based on the number of adults in the old household and whether any children in the former household are moving or staying. For example, on divorce if the female leaves the family home and takes the children, she will take 70 per cent of old household’s wealth. If the children were staying in the home with the father then she would only take 30 per cent. If there were no children involved then the household assets would be split 50/50. The model simulates the splitting of household assets by providing a cash payout to the person moving away from
11
NATSEM
www.natsem.canberra.edu.au
2011 International Microsimulation Association Conference
the old household. If necessary the old household member may take on additional debt to make this payment.
WEALTH TRANSITIONS AT RETIREMENT When a person retires (that is, leaves the workforce and does not return), they generally restructure their assets in such a way that their debts are minimised and the returns from their assets can subsidise their standards of living. That is, their goals change from wealth accumulation to lifestyle maintenance. For people with very low levels of assets, including superannuation, this may mean drawing down superannuation to pay off the mortgage or buying a car, then relying on the age pension in retirement. Very little information exists on how people actually allocate or re-allocate assets at retirement. HILDA data shows that individuals aged 55-64 years (in the last years of labour force participation before retirement) are more likely to have a mortgage over their home, more likely to have superannuation, and more likely to have other real property with an associated mortgage than people aged 65-74 (typically recent retirees); ownership of shares and a family home was similar. However, these changes are just as likely to be the result of cohort effects rather than reallocation of assets at retirement. One overriding principle that has been coded into APPSIM is the attempt to, wherever possible, eliminate real property debt in retirement. Ownership of the family home mortgage-free is considered a major form of retirement saving in Australia, as one has security of tenure, and with no rent or mortgage to pay, income from other sources goes further. Furthermore, the family home is treated more generously under the age pension means test than other assets. This means a person with a share portfolio will receive a smaller age pension that a similar person who has reallocated their share portfolio to their home (by reducing the mortgage or building an extension on the house!). During one’s working life, holding debt against investment properties is considered acceptable as the interest is deductible against income and earnings. However, when a person retires, a lower income means a lower marginal tax rate and the value of deductions such as interest on an investment loan is less attractive. The lower marginal taxation rates also make negative gearing less attractive. In other words, generally, there is little incentive to hold debt against investment properties in retirement. The process of reallocation of wealth at retirement
First, people with little equity in their investment properties (property value minus property mortgage) are assumed to sell the properties for cash and pay out the mortgage. Of retiree households with more than $100 000 in equity, a user-defined percentage will sell (the default is 50%) with a Monte Carlo process used to determine who will sell. In both scenarios, the value of the investment properties are converted to cash, any associated
12
NATSEM
www.natsem.canberra.edu.au
2011 International Microsimulation Association Conference
mortgages over the investment properties are paid out, and the balance is added to the household’s cash balance. Once the investment properties are sold, the retiree begins the process of attempting to pay out his or her family home. First, any available cash is used to pay out their home mortgage. This will leave some households mortgage free. If there is cash left over after the household have paid out their mortgage, and the household owns investment properties with associated debt, the remaining cash is used to pay out investment property loans. If cash is insufficient to pay out investment property loans, then investment property assets are rationalised – that is, investment property debt is eliminated with an equivalent reduction in investment property assets. This is intended to simulate households selling only just enough of their investment properties to reduce their debt to zero. If a household still has mortgage debt after cash is used to reduce the mortgage, and a member of the household has shares, these will be sold to reduce the mortgage (any surplus remains in shares). Finally, if the household still has mortgage debt, the some or all of the retiree’s superannuation is used to pay out the mortgage. If this is insufficient to eliminate the mortgage, then the family home is ‘downgraded’; that is, the mortgage debt over the family home is eliminated and the equity in their home is the new home value. It is common for retirees to take some of their superannuation as a lump sum, for a holiday, home renovation or a new car. For each person who retires, a set amount of superannuation is deemed to be taken as cash and spent. The default is $30 000, and this can be changed by the user.
WEALTH AFTER RETIREMENT Although there is not a great deal of research to show how people draw down their wealth to fund their lifestyle in retirement, the evidence that does exist (Kelly and Gong 2010) suggests that retirees are conservative with their money, and try to preserve their capital for as long as possible, supplementing these returns with the age pension (full or part). Part of this is to self-insure against longevity risk, and part is to leave a bequest for children. After retirement, the people simulated in APPSIM cease adding to their wealth through any form other than capital growth, and start to consume the returns from their wealth rather than save it or reinvest. Once a person is retired, the interest income from savings, the rental income from investment properties and dividend income from shares is deemed to be consumed rather than reinvested – that is, it is calculated and treated as ‘other income’, but is not transferred to cash as it is with the non-retired. In the future, it is expected that superannuation wealth will be the greatest source of income in retirement. Since superannuation drawdown rates can have an impact on future pension burdens, these can be set by the user.
13
NATSEM
www.natsem.canberra.edu.au
2011 International Microsimulation Association Conference
If a person is retired but is not yet old enough to receive the age pension, they are assumed to draw down $20 000 per year from their superannuation or five per cent of the total (whichever is greater). If a person is old enough to receive the age pension, they are assumed to draw down $10 000 per year or five per cent of the total balance (whichever is greater). These amounts can be changed by the user to assess the impact of different drawdown rates.
SIMULATIONS OF FUTURE WEALTH USING APPSIM Validation of a model is typically conducted by comparing outputs of the model to known benchmarks. However, projections of wealth are highly sensitive to underlying assumptions. Small differences in underlying assumptions regarding, for example, coverage and rates of voluntary superannuation contributions, capital growth rates, or dividend returns, can produce substantial changes in the stock of wealth held by the simulated population after fifty years. The compounding effect of these small differences in assumptions makes it difficult to compare the long term APPSIM projections with projections generated by other models. Household wealth by asset type
Figure 4 shows a comparison in the composition of average household wealth in 2005-06 from ABS data (2007), from the estimated composition of average household wealth simulated by APPSIM in 2006 as a comparison, and simulated average household wealth from APPSIM in 2051. Note that the percentages are similar between ABS data and ABS simulations for the same year, suggesting that APPSIM is simulating wealth reasonably well. The largest proportion of 2005-06 household wealth is held in the family home. Equity in the home represents 55 per cent of the total net value and it is almost three times the second largest asset type – superannuation. Around a quarter of household wealth in 2005-06 was kept in shares, investment properties and cash. The main difference of note between the two charts is the increasing importance of superannuation as a source of household wealth. In 2005-06, superannuation made up under twenty per cent of average household wealth; this is projected to increase to 34 per cent by 2051. The proportions of all other forms of asset wealth decline slightly. The family home still represents half (48.9 per cent) of the wealth in 2051 and is the largest source of household wealth.
14
NATSEM
www.natsem.canberra.edu.au
2011 International Microsimulation Association Conference
Figure 4
Estimated composition of average household wealth, 2005-06 (ABS), 2006 (APPSIM) and 2051 (APPSIM) 2005-06 (ABS)
2006 (APPSIM) Family home 57.4%
Family home 55.0%
Shares 5.3%
Superann uation 19.7%
Cash 5.8%
Investmen t property 14.3%
Shares 4.0% Superann uation 15.2%
2051 (APPSIM)
Investmen t property 16.8% Cash 6.6%
Family home 48.9%
Shares 1.6%
Superann uation 34.2%
Cash 2.6%
Investmen t property 12.7%
Source: APPSIM simulations, ABS 2007
Asset types over the life course
It is expected that wealth will increase with age. Figure 5 agrees with our expectation and shows how average household wealth grows over the simulation of the life course, for the birth cohort aged 25-34 in 2011. Figure 5 also shows the simulated decomposition of household wealth by asset type for this birth cohort. Even at this age, despite their average net wealth being very low, home equity is the largest source of wealth, followed by investment property equity, and then superannuation. As the cohort ages, the compulsory nature of superannuation contributions ensures that superannuation wealth grows at a faster rate than other assets, and makes up the largest source of wealth by the time the cohort is aged 55-64 (just before retirement). When the cohort is aged 65-74 in 2051, the attractiveness of reducing income tax has declined and correspondingly investment properties have declined in importance (they are often sold in retirement). Among all
15
NATSEM
www.natsem.canberra.edu.au
2011 International Microsimulation Association Conference
stages of the life course, shares and cash deposits make up a fairly small percentage of total household wealth.
Figure 5
Wealth growth over the life course, cohort aged 25-34 in 2011 (2010 dollars)
1200 Super
Shares
Home equity
Other property equity
Cash
1000
$000s
800 600 400 200 0 2011
2021
2031
2041
2051
Source: APPSIM simulations
Superannuation
The remainder of the analysis of APPSIM simulations will focus on superannuation. As the largest asset outside of the family home, and generally an assessable asset under the age pension means test, it potentially has the largest impact on future pension burdens. As mentioned earlier, superannuation tends to be held in significant proportions among all wealth quintiles, unlike shares and investment properties, which tend to be concentrated among the wealthy; and the income generated from superannuation in retirement reduces dependency on the age pension. Note that because superannuation is an individually-held asset, this analysis focuses on individual wealth rather than household wealth. Figure 6 shows APPSIM’s simulated superannuation contributions. Both the compulsory Superannuation Guarantee contributions and voluntary contributions keep pace with earnings growth.
16
NATSEM
www.natsem.canberra.edu.au
2011 International Microsimulation Association Conference
Figure 6
Simulated superannuation contributions, 2002-2051, (2010 dollars)
250000 Voluntary contributions 200000
Superannuation Guarantee
150000
100000
50000
20 50
20 47
20 44
20 41
20 38
20 35
20 32
20 29
20 26
20 23
20 20
20 17
20 14
20 11
20 08
20 05
20 02
0
Note: The spike in voluntary contributions in 2007 is due to a temporary policy shock which allowed people to put up to $1 million into their superannuation tax free, which sparked a sudden one-off jump in voluntary contributions. This policy, and thus its effects, were only in place for one year. Values are in 2010 dollars. Source: APPSIM simulations
The increasing rate of superannuation contributions, and the resulting increasing stock of superannuation, results in much larger proportion of the population having substantial superannuation pre-retirement and during retirement. Figure 7 shows the percentage of people, by age group, who have $100 000 or more in superannuation at the start of each decade. In 2011, less than half of all age groups had more than $100 000 in superannuation. Those approaching retirement in 2011 (the 55-64 age group) have the highest share of people with more than $100,000 in superannuation as they have spent more years working under compulsory superannuation and have had less time to draw down their superannuation.. Simulations show that in the future, increasing proportions of the population at each age group will have more than $100 000 in superannuation. By 2031, it is projected that more than 70 per cent of the population aged 55-64 and 65-74 will have at least $100 000 in superannuation. By 2051, it is projected that around two-thirds of people aged 85 and over will have more than $100 000 in superannuation, which implies that the proportion of the oldest old, who will be solely reliant on the age pension to survive, will decline substantially.
17
NATSEM
www.natsem.canberra.edu.au
2011 International Microsimulation Association Conference
Figure 7
Proportion by age group and year with more than $100 000 in superannuation (2010 dollars)
Percent with more than $100K super
100%
45-54
55-64
65-74
75-84
85+
90% 80% 70% 60% 50% 40% 30% 20% 10% 0% 2011
2021
2031
2041
2051
. Source: APPSIM simulations
In addition to this, Figure 8 shows the proportion of each age group who has more than $500 000 in superannuation. In 2001, only a small minority of all age groups – less than five per cent – had more than half a million dollars in superannuation. A noticeable change in this chart is that up until 2031, 55-64 year olds are more likely to have more than half a million dollars in superannuation than 65-74 year olds. From 2041, this switches. There are two reasons for this. First, 55-64 year olds in 2031 had compulsory superannuation for most of their working lives while 65-74 year olds had not; by 2041, 6574 year olds had spent most of their working lives making compulsory superannuation contributions. Secondly, changes to the age pension entitlement age are expected to be completed by 2023, which affects the retirement age, which means more 65-74 year olds will be remaining in the labour force.
18
NATSEM
www.natsem.canberra.edu.au
2011 International Microsimulation Association Conference
Figure 8
Per cent by age group and year with more than $500 000 in superannuation (2010 dollars)
Percent with more than $500K super
70%
45-54
55-64
65-74
75-84
85+
60% 50% 40% 30% 20% 10% 0% 2011
2021
2031
2041
2051
. Source: APPSIM simulations
CONCLUSION This paper has explained the unusual method of retirement income provision in Australia, and how private wealth is a major element in reducing future pressure on the budget as the population ages. It then goes on to briefly explain the APPSIM dynamic microsimulation model, and how the wealth module works within it. Based on simulated outcomes to 2051, the importance of retirement savings (superannuation) as an element of household wealth is expected to grow significantly. While the family home will remain the most significant element of household wealth (its share is around half), superannuation is expected to increase from one-fifth to 34 per cent of the average household net worth. APPSIM projects that there will be strong growth in those with significant superannuation balances over the next 40 years and, unlike increased housing wealth, the increased superannuation will reduce the demand for age pension outlays by the government. Finally, it should be noted that the projections presented in this paper are provisional as the model is still under development and has not been fully validated.
19
NATSEM
www.natsem.canberra.edu.au
2011 International Microsimulation Association Conference
REFERENCES ABS 2002, Australian Census 2001, Cat. no. 2001.0, Australian Bureau of Statistics, Canberra. ABS 2007, Household Wealth and Wealth Distribution, Australia 2005-06, Cat. no. 6554.0, Australian Bureau of Statistics, Canberra. ASX 2011, 2010 Australian Share Ownership Study. Australian Stock Exchange, Sydney. ATO 2011, 'Taxation Statistics 2008-09', Australian Taxation Office. http://www.ato.gov.au/content/00268761.htm Bateman, H. and Ablett, J. 2000, 'Compulsory Superannuation and Australian Generational Accounts', Economic Analysis and Policy, vol. 30, no. 1, pp 33-48. Centrelink 2011, Age Pension, http://www.centrelink.gov.au/internet/internet.nsf/payments/age_pension.htm Accessed 21 April 2011. Evandrou, M., Falkingham, J., Johnson, P., Scott, A. and Zaidi, A. 2007, 'The SAGE Model: A Dynamic Microsimulation Population Model for Britain' in Modelling Our Future: Population Ageing, Health and Aged Care, Gupta, A. and Harding, A. (eds), Elsevier, Amsterdam, pp 443447. Favrealt, M. and Smith, K. 2004, A Primer on the Dynamic Simulation of Income Model (DYNASIM3), Discussion Paper 02-04, The Urban Institute. Flood, L., Jansson, F., Pettersson, T., Sundberg, O. and Westerberg, A. 2005, SESIM III - a Swedish dynamic microsimulation model, Ministry of Finance, Sweden. http://www.sesim.org/ Flood, L. 2008, 'SESIM: a Swedish microsimulation model' in Simulating an ageing population: a microsimulation approach applied to Sweden, Klevmarken, A. and Lindgren, B. (eds), Bingley: Emerald. Harding, A. and Gupta, A. 2007, 'Introduction and Overview' in Modelling Our Future: Population Ageing, Social Security and Taxation, Gupta, A. and Harding, A. (eds), International Symposia in Economic Theory and Econometrics, North Holland, Amsterdam. Harmer, J. 2008, Pension Review Background Paper. Department of Families, Housing, Community Services and Indigenous Affairs, Canberra. Kelly, S. and Gong, H. 2010, Saving Tomorrow - The savings and spending patterns of Australians. AMP.NATSEM Income and Wealth Report Issue 25, Sydney. Kingston, G. 2004, 'Superannuation: a guide to the field for Australian economists', Economic Analysis and Policy, vol. 33, no. 2, pp 203-226. Morrison, R. J. 2009, 'Rates of Return in the Canada Pension Plan: Sub-populations of Special Policy Interest and Preliminary After-Tax Results' in New Frontiers in Microsimulation Modelling, Zaidi, A., Harding, A. and Williamson, P. (eds), Ashgate Publishing Ltd, Surrey, United Kingdom, pp 307-332. Nielson, L. and Harris, B. 2008, Chronology of superannuation and retirement income in Australia, Parliamentary Library Background Note 6 February 2008, Canberra, http://www.aph.gov.au/library/pubs/BN/2007-08/Chron_Superannuation.htm April 27 2009.
20
NATSEM
www.natsem.canberra.edu.au
2011 International Microsimulation Association Conference
Orcutt, G. 2007, 'A new type of socioeconomic system', International Journal of Microsimulation, vol. 1, no. 1, pp 2-9. Treasury 2002, 'Intergenerational Report 2002-03' 2002-03 Budget Paper No. 5, Department of Treasury, Canberra. http://www.budget.gov.au/200203/bp5/html/01_BP5Prelim.html#P42_796 Treasury 2007, 'Intergenerational Report 2007', Department of Treasury, Canberra. http://www.treasury.gov.au/igr/IGR2007.asp Treasury 2009, 2009-2010 Commonwealth Budget, Canberra, http://www.budget.gov.au/200910/content/overview/html/index.htm 13-12-09. Treasury 2010, 'Intergenerational Report 2010', Department of Treasury, Canberra. http://www.treasury.gov.au/igr/igr2010/ World Bank 1994, Averting the Old Age Crisis: Policies to protect the old and promote growth. World Bank Policy Research Report, Oxford University Press.
21