Oecologia https://doi.org/10.1007/s00442-018-4098-2
GLOBAL CHANGE ECOLOGY – ORIGINAL RESEARCH
Microspatial ecotone dynamics at a shifting range limit: plant–soil variation across salt marsh–mangrove interfaces E. S. Yando1 · M. J. Osland2 · M. W. Hester1 Received: 15 September 2017 / Accepted: 15 February 2018 © Springer-Verlag GmbH Germany, part of Springer Nature 2018
Abstract Ecotone dynamics and shifting range limits can be used to advance our understanding of the ecological implications of future range expansions in response to climate change. In the northern Gulf of Mexico, the salt marsh–mangrove ecotone is an area where range limits and ecotone dynamics can be studied in tandem as recent decreases in winter temperature extremes have allowed for mangrove expansion at the expense of salt marsh. In this study, we assessed aboveground and belowground plant– soil dynamics across the salt marsh–mangrove ecotone quantifying micro-spatial patterns in horizontal extent. Specifically, we studied vegetation and rooting dynamics of large and small trees, the impact of salt marshes (e.g. species and structure) on mangroves, and the influence of vegetation on soil properties along transects from underneath the mangrove canopy into the surrounding salt marsh. Vegetation and rooting dynamics differed in horizontal reach, and there was a positive relationship between mangrove tree height and rooting extent. We found that the horizontal expansion of mangrove roots into salt marsh extended up to eight meters beyond the aboveground boundary. Variation in vegetation structure and local hydrology appear to control mangrove seedling dynamics. Finally, soil carbon density and organic matter did not differ within locations across the salt marsh-mangrove interface. By studying aboveground and belowground variation across the ecotone, we can better predict the ecological effects of continued range expansion in response to climate change. Keywords Coastal wetland · Plant community · Climate change · Carbon · Expansion dynamics
Introduction Range limits and ecotones are two landscape features that are likely to respond to global climate change (Noble 1993; Walther et al. 2002; Parmesan and Yohe 2003; Van der Putten et al. 2010). Both features are constrained by abiotic, biotic, and dispersal limitations that define the expansion ability of a single species and/or an entire ecosystem (Gosz 1993; Peters et al. 2006; Van der Putten et al. 2010). Communicated by Daniel Laughlin. Electronic supplementary material The online version of this article (https://doi.org/10.1007/s00442-018-4098-2) contains supplementary material, which is available to authorized users. * E. S. Yando
[email protected] 1
Department of Biology, University of Louisiana at Lafayette, Lafayette, LA 70503, USA
Wetland and Aquatic Research Center, U.S. Geological Survey, Lafayette, LA 70506, USA
2
These dynamic areas are sensitive to change and may serve as an appropriate proxy for future shifts, but only by understanding both aboveground and belowground processes are we able to fully comprehend current changes and new interactions. Ecosystem transitions can be examined at a variety of scales to understand the factors that maintain their existence, define their shape, and control their advance and retreat (Gosz 1993; Peters et al. 2006). Ecotones, areas of transition between two ecosystems, form as a result of changes in biotic or abiotic drivers, such as climate, fire regime, herbivory, or other edaphic conditions (Risser 1995) with areas of overlap forming a mosaic (Watt 1947). Range limits are defined as the edges of a species’ “ecological niche in space” (Sexton et al. 2009), with species only persisting in habitats and locations where they can tolerate conditions, successfully establish, and ultimately survive and reproduce. Analyses of range limits and ecotones are often difficult due to challenges in assessment and comparison, as temporal and spatial variability need to be considered (Fortin and Drapeau 1995; Fortin et al. 2000). Recently, a variety of spatial
13
Vol.:(0123456789)
Oecologia
detection analyses and curve fitting approaches have proven to be useful in beginning to understand, and more importantly compare, transitional patterns across range limits and ecotones (Fortin et al. 2000; Hufkens et al. 2008, 2009; Danz et al. 2013). Understanding these transitions of species and ecosystems is just as critical as understanding species range interiors and homogenous portions of each ecosystem (Lloyd et al. 2000) because landscapes and species distributions are naturally patchy and exist along a continuum (Breashers 2006). Species ranges and ecotonal transitions that respond quickly to changes in climate are valuable areas for monitoring climate change and advancing understanding of climate change impacts (Noble 1993). The boundary between salt marsh and mangrove may be both an ecotone and the latitudinal range limit for mangroves in locations where temperature is the primary governing factor (Cavanaugh et al. 2014; Osland et al. 2017b). It may also serve as a suitable boundary for monitoring the impacts of climate change, due to the capability of coastal wetland plants to rapidly respond to changes in key drivers (Lovelock et al. 2010; Wasson et al. 2013). This ecotone can be found globally on low energy, subtropical coasts where temperate salt marshes meet tropical mangroves. The salt marsh–mangrove ecotone is determined by sea level, temperature, and precipitation at regional scales, but local factors, including dispersal, are also important (Saintilan et al. 2009, 2014; Osland et al. 2017b). In the northern Gulf of Mexico, the recent expansion of mangroves into salt marshes has been linked to a decrease in the severity, duration, and frequency of freeze events, allowing for freeze-intolerant mangroves to expand poleward (Osland et al. 2013; Cavanaugh et al. 2014). Comparisons between salt marshes and invading mangrove ecosystems have been made to predict the future implications of mangrove expansion on soil, vegetation, and both aboveground and belowground carbon dynamics (Perry and Mendelssohn 2009; Comeaux et al. 2012). Other studies have examined the structural, spatial, or temporal components of this gradient on these properties and processes (Stevens et al. 2006; Osland et al. 2012; Doughty et al. 2016; Kelleway et al. 2016; Yando et al. 2016; Gabler et al. 2017; Simpson et al. 2017), and regional analyses of literature-derived data have compared ecosystem properties in mangroves and salt marshes (Feher et al. 2017). However, studies explicitly examining ecotones at the individual tree level are scant and have not explored microspatial variation in aboveground and belowground vegetation metrics, belowground carbon dynamics, and rooting patterns. The successful expansion from single individuals to larger patches over time will eventually result in a shifting range limit and ecotone in any ecosystem, unless a disturbance event results in mortality (Gosz 1993). The areal extent of
13
developing mangrove patches or individuals within a salt marsh is evident aboveground, but rooting extent, belowground competition, propagule dispersal ability, and the concomitant impacts on soil properties, particularly soil carbon and organic matter, are far more cryptic. Aboveground vegetation metrics in the salt marsh–mangrove ecotone are commonly measured, and soil metrics are often used to compare edaphic conditions. Rooting metrics, however, are assessed less frequently (Comeaux et al. 2012), particularly in comparison to aboveground metrics and horizontal extent of the visible ecotone. Rooting is likely to be important due to resource competition where individual or groupings of mangroves are adjacent to other habitats (e.g. salt marsh, mudflat, salt flat, terrestrial) (Simpson et al. 2013; Howard et al. 2015), but this has not been explicitly investigated using microspatial data across the ecotone. At the salt marsh–mangrove ecotone, marsh vegetation interacts with mangroves at all life stages both aboveground and belowground. Marsh vegetation may facilitate or inhibit net expansion of mangroves by impacting resource acquisition, stress tolerance, propagule dispersal, and seedling establishment (Clarke and Hannon 1971; Kangas and Lugo 1990; McKee et al. 2007b; Pickens and Hester 2011; Peterson and Bell 2012, 2015). Finally, soil organic matter and carbon density have been shown to have no difference between salt marsh and mangrove ecosystems in the productive tidal saline wetlands of Louisiana and Florida (Perry and Mendelssohn 2009; Henry and Twilley 2013; Doughty et al. 2016) or along a structural forest gradient in either location (Yando et al. 2016), but this has not been tested at the individual tree scale. Only by understanding these responses, feedbacks, and interactions, in both the aboveground and belowground environment, will we be better able to address how this expansion occurs at both local and landscape scales (Wiens et al. 1985). In this study, we examine plant–soil interactions within a shifting mangrove range limit and ecotonal transition from salt marsh to mangrove at the individual tree scale. This finescale assessment broadly addresses whether individuals of a species expanding into incumbent habitats have the same proportional relationship and extent aboveground and belowground. We hypothesized that, at the microspatial scale, (1) belowground extent would exceed aboveground extent, (2) larger trees would have greater belowground extent, (3) differences in salt marsh species and overall structural density would differentially influence aboveground and belowground mangrove dynamics, including seedling distribution, and (4) soil properties, specifically organic matter and soil carbon density, would not differ across the salt marsh-mangrove interface within our study sites.
Oecologia
Methods and materials Study area In the summer of 2013, we established field sites at two locations in the northern Gulf of Mexico where Avicennia germinans, the most freeze-tolerant mangrove species in the region, reaches its latitudinal limit and forms an ecotone with salt marsh species. Field site locations included Port Fourchon, Louisiana (29.11°N, 90.20°W; adjacent to Bayou Lafourche) and Cedar Key, Florida (29.14°N, 83.03°W; between Cedar Key and Scale Key) (Online Resource 1). Both locations are microtidal with mean tidal ranges of 0.37 m (Port Fourchon, Louisiana) and 0.86 m (Cedar Key, Florida) (NOAA 2014a, b). Salt marsh vegetation in the Louisiana sites is exclusively dominated by Spartina alterniflora, whereas the Florida sites contain a mixture of Batis maritima, Paspalum vaginatum, Salicornia depressa, and S. alterniflora (Yando et al. 2016).
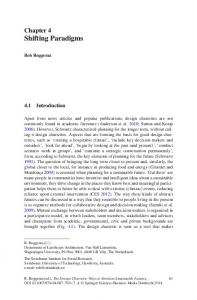
Experimental design At each of the two locations, we identified six mangrove trees forming a discrete boundary with the surrounding salt marsh. Three replicate trees were of the large size class and three replicate trees were of the small size class, for a total of twelve trees across both locations and six trees per location. Tree sizes were relative to location. All trees were reproductive adults and represented the variation of mangrove individuals growing solitarily in salt marsh within each location. At each tree, we established a transect at the edge of the canopy (hereafter, the salt marsh–mangrove interface), positioned at 0 m and sampled 0.2-m2 (0.15 m × 1.33 m) plots at set distances from each individual tree (− 4, − 2, − 1, − 0.5, 0, 0.5, 1, 2, and 4 m) (Fig. 1). The transect extended outwards into the salt marsh and inwards under the mangrove canopy. Plots in the salt marsh were assigned positive values that denote their distance from the salt marsh–mangrove interface, whereas mangrove plots were assigned negative values that denote their distance, in the opposite direction, from the salt marsh–mangrove interface. In cases where we found mangrove pneumatophores, the aerial roots of A. germinans, extending to the 4-m plot in the salt marsh, additional plots were added on the transect until pneumatophores could no longer be found (e.g. at 8 m and 16 m). For small individuals, if the transect extended beyond the main trunk of the tree prior to the −4, −2, or −1 m plots, those plots were eliminated. The rectangular plots were oriented with the long axis of the plot perpendicular to the transect.
Fig. 1 Idealized transect at each mangrove extending both under the mangrove canopy and out into the surrounding salt marsh. Color version of this figure is available online
Vegetation Aboveground, we characterized mangrove and salt marsh plant community composition and structure within each plot. For mangroves, percent cover, number of pneumatophores, number of seedlings (i.e. trees less than 1.4 m in height), and maximum canopy height were measured at each plot along the transect. For salt marsh, we measured percent vegetation cover by species. We also collected aboveground vegetation from a 0.05-m2 subplot (0.15 m × 0.33 m). Upon returning to the lab, the collected vegetation was used to determine stem densities and individual heights for each species. Belowground, we characterized mangrove and salt marsh root biomass. A 30-cm deep, 4.7-cm diameter soil core was collected from the edge of each plot for root analyses so not to disturb vegetation for possible future monitoring. Rooting in this region occurs primarily in the top 30 cm, with the majority of roots occurring in the top 15 cm of soil (Darby and Turner 2008), but we acknowledge that we may be underestimating total root biomass. Cores were collected using a custom stainless-steel piano-hinge corer and stored on ice while in the field. Upon return to the laboratory, we transferred samples to a 4 °C refrigerator until analyses were conducted. Roots were washed of soil, sorted into macro (> 2 mm) and micro (