Bull. Mater. Sci., Vol. 29, No. 4, August 2006, pp. 385–390. © Indian Academy of Sciences.
Microstructural studies on variation of defect parameters in Zr–Sn alloys and their transition with interchange of solvent and solute in Zr–Ti and Ti–Zr alloy systems by modified Rietveld method and Warren–Averbach method J GHOSH†,*,#, S K CHATTOPADHYAY††, A K MEIKAP† and S K CHATTERJEE† †
Department of Physics, ††Department of Metallurgical Engineering, National Institute of Technology, Durgapur 713 209, India # Present address: Department of Analytical Facility & XRD, Central Glass and Ceramic Research Institute, Kolkata 700 032, India MS received 13 December 2005; revised 26 June 2006 Abstract. The effects of deformation and the transition of microstructural defect states with the interchange of solvent and solute in Ti–Zr and Zr–Ti alloys of six different compositions and Zr–Sn alloys in three different compositions have been investigated by X-ray diffraction line profile analysis. The detailed analysis of the Xray powder diffraction line profiles was interpreted by Fourier line shape analysis using modified Rietveld method and Warren–Averbach method taking silicon as standard. Finally the microstructural parameters such as coherent domain size, microstrains within domains, faulting probability and dislocation density were evaluated from the analysis of X-ray powder diffraction data of Zr base Sn, Ti and Ti base Zr alloys by modified Rietveld powder structure refinement. This analysis confirms that the growth fault, β , is totally absent or negligibly present in Zr–Ti, Ti–Zr and Zr–Sn alloy systems, because the growth fault, β , has been observed to be either negative or very small for these alloy systems. This analysis also revealed that the deformation fault, α, has significant presence in titanium-base zirconium alloy systems but when zirconium content in the matrix goes on increasing beyond 50%, this faulting behaviour suffers a drastic transition and faulting tendency abruptly drops to a level of negligible presence or zero. This tendency has also been observed in Zr–Sn alloys signifying high stacking fault energy. Therefore, Zr and Zr-base alloys having high stacking fault energy can be used as hard alloys in nuclear technology at high temperature. Keywords. X-ray diffraction; Fourier line shape analysis; modified Rietveld method; Warren–Averbach method; microstructural defect parameters; Ti and Zr base alloys.
1.
Introduction
In the present work, we have studied X-ray diffraction profiles of Zr-base Sn, Zr-base Ti and Ti-base Zr alloys by modified Rietveld method (Lutterotti and Scardi 1990) and Warren–Averbach method (1950). In the present study, considering wide applicability of zirconium-base alloys in nuclear technology, six compositions (table 1a) of Zr–Ti and three compositions (table 1b) of Zr–Sn alloy systems have been chosen for the investigation. The microstructural parameters such as domain size, microstrains within the domains, stacking faults and dislocation densities of these alloy systems have been determined from detailed Fourier line shape analysis of various fault-unaffected (H – K = 3N) and fault-affected (H – K = 3N ± 1) reflections.
*Author for correspondence (
[email protected])
The results were compared with earlier observations on pure zirconium. 2.
Experimental
The alloy ingots prepared by standard arc-melting method and homogenized at 800°C for 48 h, were powdered by hand filing using a jeweler’s file at room temperature. Then these powdered samples after magnetically separating iron filing (if any) were sieved through a 250 mesh screen and flat diffractometer samples in the form of briquette suitable for the recording of X-ray diffraction profiles were prepared for the cold worked samples. Silicon (Si) sample was used as standard (van Berkum et al 1995; Santra et al 2002) for instrumental broadening correction because it has large crystallites and is free from any defect. The XRD profiles for the cold worked alloys (Zr–Ti and Ti–Zr) as well as silicon standard samples were recorded from 25–90° (2θ) and 30–80° (2θ) for Zr–Sn alloys 385
J Ghosh et al
386
Table 1a. The values of lattice parameters for Ti–Zr and Zr–Ti alloy systems along with alloy composition. Lattice parameters (Å) Error limit: ± 0⋅0004 Å Alloy
Nominal composition (wt %)
a
c
c/a
Titanium-based zirconium alloys Alloy I Ti – 95%, Zr – 5% Alloy II Ti – 85%, Zr – 15% Alloy III Ti – 80%, Zr – 20%
2⋅9600 2⋅9683 2⋅9977
4⋅7017 4⋅7057 4⋅7336
1⋅5885 1⋅5853 1⋅5791
Zirconium-based titanium alloys Alloy IV Zr – 75%, Ti – 25% Alloy V Zr – 70%, Ti – 30% Alloy VI Zr – 65%, Ti – 35%
3⋅1218 3⋅1396 3⋅1109
4⋅9400 4⋅9649 4⋅9145
1⋅5824 1⋅5814 1⋅5798
Table 1b. The values of lattice parameters and hardness (microhardness) for Zr-based Sn alloys along with alloy composition. Lattice parameters (Å) Error limit: ± 0⋅0004 Å Nominal composition (wt %)
Alloy
a 3⋅1741 3⋅2111 3⋅2082
112
alloy VIII
102
110
103 112
60
2 θ (degree)
103
110
a llo y V
112
101 100 002
a lloy IV
102
103
110
alloy VII
Zirconium -based Titanium a lloys
40
3636 5033 5682
a lloy I
a lloy III
002 101 100
1⋅6222 1⋅6025 1⋅6002
Intensity (a.u)
Intensity (a.u)
5⋅1491 5⋅1458 5⋅1337
Vickers hardness (MPa)
Zirconium-based Tin alloys
a lloy II
Figure 1.
c/a
Titanium - based Zirconium a lloys
102
002 101
100
Zirconium-based tin alloys Alloy VII Zr – 82%, Sn – 18% Alloy VIII Zr – 78%, Sn – 22% Alloy IX Zr – 76%, Sn – 24%
c
alloy IX
a lloy VI 80
(a)
30
40
50
60
2θ (degree)
70
80
(b)
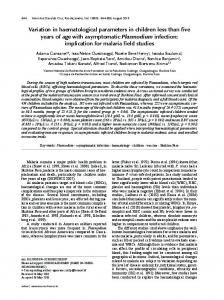
(a) XRD patterns of Ti–Zr and Zr–Ti alloys (alloys I–VI) and (b) XRD patterns of Zr–Sn alloys (alloys VII–IX).
with Ni-filtered CuKα radiation in a highly stabilized Philips PW 1830 X-ray diffractometer operating at 40 kV, 30 mA for Ti–Zr and 35 kV, 20 mA for Zr–Sn in step scanning mode of 0⋅02° in 2θ. The diffraction profiles of cold worked alloys are shown in figure 1a for Zr–Ti (Ti–Zr) and figure 1b for Zr–Sn alloy systems. The XRD pattern for standard Si is shown in figure 2. Fourier line shape analysis has been performed on the recorded profiles of
each alloy to evaluate microstructural parameters. X-ray data were analysed for domain size and r.m.s. strain with the help of modified Rietveld method using the program LS1 (Lutterotti and Scardi 1990). Crystal structure and microstructural parameters can be refined simultaneously using this LS1 program, a modified Rietveld programme similar to the package GSAS (Larson and Von Dreele 2001; Nalini et al 2001; Balzar et al 2004). Microstruc-
Microstructural studies on variation of defect parameters in Zr–Sn alloys tural parameters like domain size and microstrain of these alloys were refined using hexagonal symmetry of space group by Rietveld analysis (using the program LS1) of the diffraction data. Lattice parameters were calculated from the peak position (2θ0) for all observable reflections. Then the values of lattice parameters were incorporated in the program as initial parameters. The method involved the Fourier analysis of the broadened peaks. The average domain size, microstrain and lattice parameters were used as fitting parameters simultaneously to obtain the best fit in order to calculate the average values of the fitting parameters. The pseudo-Voigt function was used in this program to describe the X-ray diffraction peak profile of the coldworked alloys to fit the experimental data. The variation of FWHM of the silicon reflection was assumed to follow the Caglioti relation (Caglioti et al 1958): FWHM2 = U tan2θ + V tanθ + W. Using LS1 program, Caglioti parameters U, V and W were refined separately and the values were subsequently incorporated in the convolution fitting process. Then effective domain size, De and r.m.s. strain 〈ε2(L)〉1/2 with respect to fault-affected crystallographic planes were refined to obtain the best fitting parameters. This program also incorporates the correction for preferred orientation (March 1932; Dollase 1986; Will et al 1988). The corrections for oriented planes have been incorporated for these alloy systems to obtain the best fitting parameters. The dislocation density, ρ, is an important material property, which gives the length of the dislocations present per unit volume (cm/cm3) in the material. This arises due to particle size and strain effect, respectively noted in ρD and ρS and are related as (Chatterjee and Sen Gupta 1974; Chattopadhyay et al 1990) ρ = (ρD⋅ρS)1/2,
(1)
387 –
2 (L)〉/b2, K is a material where ρD =(3/D2av) and ρS = K〈ε – – constant and Burgers vector, b, is equal to (1/3)[1120] (Chatterjee and Sen Gupta 1974; Dieter 1987). The effective domain size, De, is related to the average domain size, Dav, and stacking faults (deformation fault, α and growth fault, β) by the following relations
1 1 = + [| L0 | d (3α + β ) / C 2 ], De Dav
(2)
where, L0 is odd and H – K = 3N ± 1 for HKL0 reflection. 1 1 = + [| L0 | d (3α + 3β ) / C 2 ], De Dav
(3)
where, L0 is even and H – K = 3N ± 1 for HKL0 reflection and d the interplanar spacing and C the lattice constant. Then the deformation fault, α, and growth fault, β, were separated by least square analysis (Cullity 1978) considering the fault-affected reflections (H – K = 3N ± 1, L0, even or odd). X-ray diffraction profiles of these alloy systems were also analysed for microstructural parameters by the Warren– Averbach method. The microstructural parameters like average domain size and average microstrain within the domains can be determined by expressing the observed diffraction profiles in Fourier series. The coefficients of this series include the effect of deformations and instrumental effects. The instrumental effects can be separated following Stokes (1948) method i.e. by deconvoluting the Fourier coefficients of the Fourier series into which the profiles from standard silicon are expressed. These Stokes corrected Fourier coefficients, AL, are related to the size coefficient (ALS) and distortion coefficient (ADL ), respectively, as (Warren 1969) AL(hkl) = ALS⋅ADL .
(4) ALS
The size coefficients, and distortion coefficients, ADL , can be separated from the intercept at 1/d2 = 0 of the plot of lnAL vs 1/d2, where d is the interplanar spacing. The micro-strain 〈ε2(L)〉 can be determined from distortion coefficient, ADL , separated from (4) by assuming Gaussian strain distribution as (Warren 1969)
20000
Silicon Standard
Intensity (a.u)
15000
ADL = exp[–2π2〈ε2(L)〉L2/d 2].
(5)
The column averaged domain size 〈Dcol〉 is calculated from initial slope of ALS vs L, i.e.
10000
dAS 1 − L = . dL L →0 〈 Dcol 〉
5000
(6)
0
40
60
2θ (degree)
Figure 2.
XRD pattern for silicon standard sample.
80
The second derivative of the size coefficients, ALS, is proportional to the surface-weighted and volume-weighted column-length distribution functions, ρS(L) and ρV(L). These two functions are expressed as (Enzo et al 1988; Balzar and Ledbetter 1993):
J Ghosh et al
388 ρS ( L) ∝
d 2 ALS 2
dL
ρV ( L) ∝ L ⋅
,
d 2 ALS dL2
.
The volume averaged domain size 〈DV〉 and the surface averaged domain size 〈DS〉 can be determined from the following equations (Enzo et al 1988; Balzar and Ledbetter 1993) ∞
∞
0
0
〈 DV 〉 = ∫ L ρ V ( L)dL / ∫ ρV ( L)dL, ∞
∞
0
0
(7)
〈 DS 〉 = ∫ L ρS ( L )dL / ∫ ρS ( L)dL.
(8)
The suitable form of these column-length distribution functions are adopted in WMN (LINE BROADENING ANALYSIS DI PROFILI W.A.X.S) program to calculate 〈Dcol〉, 〈DS〉 and 〈DV〉 for these alloy systems. 3.
Results and discussion
Nominal compositions of the alloys are shown in table 1a and b. Lattice parameters have been calculated from the
peak position (2θ0) for all observable reflections using Cohen’s least-squares method (Cullity 1978; Sen et al 1997, 1998). Lattice parameters (a, c) for the cold-worked alloys (alloys I–VI) for Zr–Ti (Ti–Zr) and alloys VII–IX for Zr–Sn systems are shown in tables 1a and b along with c/a ratio. Fourier line shape analysis has been performed on the recorded X-ray diffraction profile of these alloy systems by modified Rietveld method taking silicon sample as standard for instrumental correction, because it has large crystal size and is totally free from defect. Finally microstructural parameters such as coherent domain size, microstrains within domains, faulting probability and dislocation density were evaluated by X-ray diffraction line profile analysis (XRDLPA) using modified Rietveld method. The best fitting values of the average domain size (Dav) and r.m.s. strain at 〈Dav〉/2 are shown in table 4 for all the alloy systems. The effective domain size, De, with respect to fault-affected crystallographic planes were calculated from the best fitting parameters. The values are shown in table 2 for alloys I–VI and table 3 for alloys VII–IX. The surface averaged domain size (〈DS〉), volume averaged domain size (〈DV〉), column averaged domain size (〈Dcol〉) and average microstrain were calculated using (5) to (8) from Warren–Averbach method using WMN program for these alloy systems. The values are shown in table 4. The domain size and r.m.s. strain determined from Warren–Averbach method, are
Table 2. The values of effective domain size (De), fault parameters (3α + 3β) and (3α + β) for fault-affected (H – K = 3N ± 1) reflections (L0, even and odd), stacking fault densities (α and β) and dislocation density (ρ) for Ti–Zr and Zr–Ti alloy systems.
Alloy Alloy I
Alloy II
Alloy III
Alloy IV
Alloy V
Alloy VI
Reflection H – K = 3N ± 1 L0 even and odd
De (Å) Error limit: ± 5–10 Å
Compound fault parameters (× 103) Error limit: ± 0⋅003 to ± 0⋅005 (3α + β)
10⋅1 10⋅3 10⋅2
89 119 112
44⋅84 9⋅57
10⋅1 10⋅3 10⋅2
162 195 205
26⋅94 9⋅39
10⋅1 10⋅3 10⋅2
180 242 220
17⋅54 1⋅99
10⋅1 10⋅3 10⋅2
140 102 130
–19⋅15 4⋅61
10⋅1 10⋅3 10⋅2
121 145 139
–28⋅16 –23⋅76
10⋅1 10⋅3 10⋅2
89 119 112
–16⋅16 –25⋅37
(3α + 3β)
α (× 103) Error limit: ± 1⋅5 × 10–3
β (× 103) Error limit: ± 3 × 10⁻³
14⋅57
–12⋅35
1⋅6486
7.71
–4⋅71
1⋅1172
4⋅14
–2⋅53
1⋅2507
–2⋅13
–0⋅82
2⋅2845
–8⋅73
0⋅24
3⋅2205
–6⋅01
–2⋅65
4⋅633
ρ (× 10–12) (cm/cm3)
14⋅45
9⋅26
4⋅94
–8⋅81
–25⋅50
–25⋅84
Microstructural studies on variation of defect parameters in Zr–Sn alloys
389
Table 3. The values of effective domain size (De), fault parameters (3α + 3β) and (3α + β) for fault-affected (H – K = 3N ± 1) reflections (L0, even and odd), stacking fault densities (α and β) and dislocation density (ρ) for Zr-based Sn alloys.
Reflection H – K = 3N ± 1 L0 even and odd
Alloy Alloy VII
Alloy VIII
Alloy IX
De (Å) Error limit: ± 5–10 Å
Compound fault parameters (× 103) Error limit: ± 0⋅003 to ± 0⋅005 (3α + β)
10⋅1 10⋅3 10⋅2
110 81 89
–52⋅17 –9⋅35
10⋅1 10⋅3 10⋅2
125 87 98
–85⋅36 –26⋅43
10⋅1 10⋅3 10⋅2
110 70 83
–94⋅95 –21⋅47
(3α + 3β)
α (× 103) Error limit: ± 1⋅5 × 10–3
β (× 103) Error limit: ± 3 × 10⁻³
ρ (× 10–12) (cm/cm3)
–12⋅43
6⋅29
1⋅968
–21⋅56
8⋅41
3⋅312
–22⋅68
9⋅47
5⋅505
–18⋅71
–39⋅83
–40⋅07
Table 4. Size and strain values calculated by modified Rietveld technique and Warren–Averbach method for alloy systems. Warren–Averbach method 〈Dcol〉 (Å)
〈〈ε2(L)〉 1/2〉 (× 103)
Average domain size (Dav) (Å)
〈〈ε2(L)〉 1/2〉 (× 103)
Titanium-based zirconium alloys Alloy I 189 199 Alloy II 305 373 Alloy III 153 183
227 232 223
3⋅10 4⋅32 3⋅49
150 292 265
3⋅19 4⋅22 4⋅33
Zirconium-based titanium alloys Alloy IV 118 171 Alloy V 104 189 Alloy VI 106 188
242 260 234
6⋅86 7⋅18 6⋅53
111 91 78
3⋅45 4⋅01 4⋅72
Zirconium-based tin alloys Alloy VII 208 272 Alloy VIII 240 311 Alloy IX 169 214
122 139 117
5⋅96 5⋅62 6⋅23
72 63 56
1⋅96 2⋅92 4⋅31
Alloy
〈DS〉 (Å)
〈DV〉 (Å)
Modified Rietveld technique
Error limit for domain size: ± 5 to ± 10; error limit for average r.m.s. strain: ± 0⋅03 × 10–3.
somewhat higher than those found by the modified Rietveld method. The deviation in the results obtained from Warren–Averbach method from the results that was obtained from modified Rietveld method may be due to the assumption of Gaussian nature of size and strain broadened profiles in Warren–Averbach method. The X-ray diffraction profiles are never pure Gaussian or Lorentzian. The pseudoVoigt function is used to describe the X-ray diffraction peak profile in modified Rietveld method. Moreover, modified Rietveld method takes into consideration the correction for preferred orientation if there is any, while the Warren–Averbach method is not capable of eliminating such effects. From the analysis (table 4) it has been observed that there is a significant decrease in average domain size with microstrain increasing almost systematically with the titanium content in Zr base Ti alloy sys-
tems while contradictory to Zr–Ti alloy systems, the average domain size and microstrain both increases with zirconium content in Ti base Zr alloy systems. In Zr–Sn alloy systems a similar tendency of decrease of average domain size and increase in strain with increase in Sn content has been observed in Zr–Sn systems. The values of average domain size of Zr-base Ti and Zr-base Sn alloys are quite less compared to pure zirconium (Chatterjee and Sen Gupta 1974), where average domain size was found to be 280 Å. The compound fault probabilities (3α + β) and (3α + 3β) were obtained considering (2) and (3) using modified Rietveld method. The deformation fault, α and growth fault, β, calculated from the compound fault values for various reflections are also as shown in table 2 for alloys I–VI and table 3 for alloys VII–IX. The values of these two faults for all alloy systems were separated by least
390
J Ghosh et al
square analysis. The growth fault, β, has been observed to be either negative or negligibly small (within the range of experimental error) in Zr–Ti and very small in Zr–Sn systems which signifies that the growth faults are absent or negligible in these alloy systems as was observed in other hexagonal systems (Warren 1969; Chatterjee and Sen Gupta 1974, 1975; Chattopadhyay et al 1990; Sen et al 1995, 1998). However, the deformation fault, α, appears to be positive for Ti base Zr alloy systems and negative for Zr base Ti alloy and Zr–Sn alloy systems. The analysis revealed that the deformation fault, α, which is negligible in Zr–Sn systems, has significant presence in Ti-base Zr alloy systems but when zirconium content in the matrix goes on increasing beyond 50%, this faulting behaviour suffers a drastic transition and faulting tendency abruptly drops to a level of negligible presence or zero. This diametrically opposite transition of deformation faulting tendency from Ti–Zr to Zr–Ti alloy systems can be explained from the basic nature of Ti and Zr. It was earlier observed by Chatterjee and Sen Gupta (1974, 1975) that Ti possesses a slight tendency of faulting while this deformation fault, α, is totally absent in Zr and Zr base alloy systems. This opposite nature may be due to the fact that {0002} basal slip mode is bit easier in Ti than that in Zr (Chatterjee and Sen Gupta 1974; Sen et al 1997, 1998). The entire line shape analysis for hexagonal system is based on this basal slip only (Warren 1969; Chatterjee and Sen Gupta 1974, 1975). The low deformation or stacking fault probability, α, in zirconium signifies high stacking fault energy because it has inverse relation with α. It is known that the metals that have high stacking fault energy strain harden less rapidly. It is also observed in metals that the tendency of the cross slip is greater during deformation with higher stacking fault energy. Therefore, zirconium and zirconium base alloy can be used as hard alloys in nuclear technology at high temperature. In order to substantiate this conclusion Vickers hardness has been determined for Zr–Sn alloy systems and are shown in table 1b. The analysis also reveals that the stacking fault energy of zirconium is greater than titanium. This may be due to the easier basal slip mode in Ti compared to Zr. The dislocation density, ρ, has been measured from the relation given in (1) and the values are listed in table 2 for alloys I–VI and tables 3 for alloys VII–IX. It is found that the dislocation density is quite high for these zirconium-base alloy systems compared to the pure zirconium (Chatterjee and Sen Gupta 1974), where ρ was found to be of the order of 1011. It has been observed that the dislocation density, ρ, increases systematically with concentration of Ti in Zr-base Ti alloy systems and decreases with Zr in Ti-base Zr alloy systems. This observation is obvious because Ti possesses a slight tendency of deformation faulting, however, for Zr–Sn system, it shows a systematic increase.
4.
Conclusions
Alloying of Zr with Ti and Sn decreases its deformation faulting tendency. The low values of deformation stacking fault probability, α, in zirconium base alloys signifies high stacking fault energy because it has inverse relation with α. Higher stacking fault energy observed in these alloy systems may help to achieve higher cold deformation in these materials without much strain hardening effect. So these observations conclude that zirconium and zirconium base alloys can have high temperature applications as hard alloys in nuclear technology. Acknowledgements The authors are thankful to Dr Sampad Biswas and Mitun Das, CGCRI, Kolkata, for carrying out the Vickers hardness test. References Balzar D and Ledbetter H 1993 J. Appl. Crystallogr. 26 97 Balzar D et al 2004 J. Appl. Crystallogr. 37 911 Caglioti G, Paoletti A and Ricci F P 1958 Nucl. Instrum. Method 35 223 Chatterjee S K and Sen Gupta S P 1974 J. Mater. Sci. 9 953 Chatterjee S K and Sen Gupta S P 1975 J. Mater. Sci. 10 1093 Chattopadhyay S K, Chatterjee S K and Sen Gupta S P 1990 J. Mater. Res. 5 2120 Cullity B D 1978 Elements of X-ray diffraction (Reading, MA: Addison-Wesley Publishing Co.) p. 363 Dieter G E 1987 Mechanical metallurgy (New York: McGrawHill Book Co.) p. 136 Dollase W A 1986 J. Appl. Crystallogr. 19 267 Enzo S, Fagherazzi G, Benedth A and Pollizzi S 1988 J. Appl. Crystallogr. 21 536 Larson A C and Von Dreele R B 2001 General structure analysis system GSAS, Los Alamos National Laboratory Report Lutterotti L and Scardi P 1990 J. Appl. Crystallogr. 23 246 March A 1932 Z. Krystallogr. 81 285 Nalini G, Somashekar R and Guru Row T N 2001 J. Solid State Chem. 156 207 Santra K, Chatterjee P and Sen Gupta S P 2002 Bull. Mater. Sci. 25 251 Sen R, Chattopadhyay S K and Chatterjee S K 1995 Trans. Indian Inst. Metals 48 247 Sen R, Chattopadhyay S K and Chatterjee S K 1997 Jpn J. Appl. Phys. 36 364 Sen R, Chattopadhyay S K and Chatterjee S K 1998 Met. & Mater. Trans. 29 2639 Stokes A R 1948 Proc. Phys. Soc. London 61 382 van Berkum et al 1995 Powder Diffraction 10 129 Warren B E 1969 X-ray diffraction (Reading: Addison-Wesley) Warren B E and Averbach B L 1950 J. Appl. Phys. 21 595 Will G, Bellotto M, Parrish W and Hatr M 1988 J. Appl. Crystallogr. 21 182