High-Contrast Object Recovery ... to constrain the image reconstruction to recover the correct ... surement data is limited and corrupted by noise, distinctions.
104
IEEE TRANSACTIONS ON MEDICAL IMAGING, VOL. 20, NO. 2, FEBRUARY 2001
Microwave Image Reconstruction Utilizing Log-Magnitude and Unwrapped Phase to Improve High-Contrast Object Recovery Paul M. Meaney*, Member, IEEE, Keith D. Paulsen, Member, IEEE, Brian W. Pogue, Member, IEEE, and Michael I. Miga Abstract—Reconstructing images of large high-contrast objects with microwave methods has proved difficult. Successful images have generally been obtained by using a priori information to constrain the image reconstruction to recover the correct electromagnetic property distribution. In these situations, the measured electric field phases as a function of receiver position around the periphery of the imaging field-of-view vary rapidly often undergoing changes of greater than radians especially when the object contrast and illumination frequency increase. In this paper, we introduce a modified form of a Maxwell equation model-based image reconstruction algorithm which directly incorporates log-magnitude and phase of the measured electric field data. By doing so, measured phase variation can be unwrapped and distributed over more than one Rieman sheet in the complex plane. Simulation studies and microwave imaging experiments demonstrate that significant image quality enhancements occur with this approach for large high-contrast objects. Simple strategies for visualizing and unwrapping phase values as a function of the transmitter and receiver positions within our microwave imaging array are described. Metrics of the degree of phase variation expressed in terms of the amount and extent of phase wrapping are defined and found to be figures-of-merit which estimate when it is critical to deploy the new image reconstruction approach. In these cases, the new algorithm recovers high-quality images without resorting to the use of a priori information on object contrast and/or size as previously required. Index Terms—A priori information, microwave imaging, modelbased reconstruction, phase unwrapping.
I. INTRODUCTION
D
ESPITE well-documented electromagnetic property contrast between tissues which vary over frequency [1], microwave imaging methods have been slow to develop in large measure due to the difficulties associated with image reconstruction. Recent advances in model-based methods where solutions of the full Maxwell equations are matched to measured field data in order to estimate the electromagnetic property distribution over the imaging region have been encouraging in this regard [2]–[6]. Manuscript received April 4, 2000; revised November 2, 2000. This work was supported by NIH/NCI under Grants RO1 CA55034 and P01 CA80139. The Associate Editor responsible for coordinating the review of this paper and recommending its publication was J. C. Newell. Asterisk indicates corresponding author. *P. M. Meaney is with the Thayer School of Engineering, Dartmouth College, Hanover, NH 03755 USA. K. D. Paulsen is with the Thayer School of Engineering, Dartmouth College, Hanover, NH 03755 USA. He is also with the Norris Cotton Cancer Center, Lebanon, NH 03756 USA. B. W. Pogue and M. I. Miga are with the Thayer School of Engineering, Dartmouth College, Hanover, NH 03775 USA. Publisher Item Identifier S 0278-0062(01)01232-0.
Images recovered from both synthetic and experimental measurements, including in vivo data, have been reported [7]–[9] and the modeling approach appears to have set the stage for the realization of successful medical microwave imaging. While significant progress has resulted, issues of image uniqueness, algorithmic stability and convergence and data independence remain partially unresolved. In the experimental environment where the amount of measurement data is limited and corrupted by noise, distinctions between these issues become blurred. For example, limits on measurement data compromise image uniqueness and data independence both of which lead to ill conditioning of the reconstruction process necessitating application of regularization and other forms of constraints. From the perspective of image reconstruction as a nonlinear optimization problem involving the minimization of an objective function, use of regularization and incorporation of constraints influence image convergence by seeking to avoid the possibility of reaching local minima solutions or even algorithmic divergence depending on data quality and other parameters such as the initial property distribution estimate. As a result, it is critical to collect and exploit the available measurement data as judiciously as possible. Perhaps surprisingly, a particularly demanding problem for microwave imaging has proved to be the reconstruction of large high-contrast objects even when the geometry and property distribution is relatively simple [2], [5], [8], [10]. In fact, recovery of successful images in this situation has required the use of varying degrees of a priori information in order to ensure that the reconstruction algorithm converges to the correct electromagnetic property distribution. These cases are typically characterized by large phase variations between measurement sites around the periphery of the imaging field-of-view (FOV). This degree of phase variation may pose problems when the measured field data is expressed in its complex number (real and imaginary parts) representation since information about phase wrapping between measurement positions around the target is not retained. Others have certainly recognized the importance of accounting for phase variations in measured data which undergo changes of greater than radians [10]–[13]. However, to the best of our knowledge, there have been no reports of iterative Maxwell equation model-based image reconstruction algorithms which attempt to retain information encoded into phase wraps in the measured data between receiver locations. In this paper, we introduce a modified form of our Maxwell equation model-based reconstruction algorithm which directly
0278–0062/01$10.00 © 2001 IEEE
MEANEY et al.: MICROWAVE IMAGE RECONSTRUCTION
105
Fig. 1. Schematic representation of the target region with respect to the monopole antennas. Note that each transmitting antenna has its own unique set of receiver antennas.
incorporates log-magnitude and phase of the measured electric field data. Specifically, the process minimizes squared differences between measured and computed electric field logmagnitude and phase by iteratively adjusting the spatial distribution of electromagnetic properties within the imaging FOV through a regularized least squares approach. Resulting changes in the nonlinear system of equations to be iteratively solved with Newton’s method are described. The technique allows the measured phase as a function of receiver position to be mapped to a unique value by unwrapping the phase variation onto multiple Rieman sheets in the complex plane. Experiments involving synthetic and experimental data demonstrate that this approach leads to dramatically improved images in cases where there is a significant degree of phase wrapping in the measurement data which is symptomatic of the high-contrast large object reconstruction problem. Measures for quantifying the degree and extent of phase wrapping are identified. Simple methods for unwrapping the measured and computed phase values are presented. The substantial improvements in the recovered images appear to result from modifications in the objective function surface for the log-magnitude and phase representation that lead to the enhanced convergence properties of the algorithm which have been observed. Equivalent images obtained with the traditional complex number formulation (i.e., real and imaginary values distributed on a single Rieman sheet) can be recovered through the incorporation of a priori information in the form of a favorably biased initial starting distribution of electromagnetic properties. This suggests that there is a loss of information in mapping the measured phase variation onto a single Rieman sheet which is retained by using the log-magnitude and phase representation in the reconstruction process. II. LOG-PHASE RECONSTRUCTION ALGORITHM A. Numerical Implementation The log-phase reconstruction algorithm is an iterative technique involving the minimization of a squared error objective function based on Newton’s method. A requirement of this ap-
proach is that the electric field values be computed at each iteration for the current estimate of the electrical property distribution. This aspect of the algorithm has not changed from previous implementations; refer [4], [9], [11], and [14]–[18] for a comprehensive review. However, for electrical property recovery with the log-phase algorithm the true log electric field magnitude (denoted as ) and electric field phase (symbol) are approximated at a point as a function of the ized by true electrical property distribution (represented by , the complex-valued wavenumber squared expressed in terms of its real , and imaginary components) through truncated Taylor series’ expanded around an approximate electrical property proand file represented by -dimensional vectors,
(1) and
(2) and , represent matrices of first derivawhere tives of the approximate solution with respect to each member and forming the -dimensional sets and , and and are difference vectors, and , respectively. One can easily deterand given the mine the electrical properties from each and where operating frequency since is the magnetic permeability, is the electrical permittivity and is the electrical conductivity. To make use of the approximations in 1 and 2 to update the and profiles, true values of the electric field are needed.
106
IEEE TRANSACTIONS ON MEDICAL IMAGING, VOL. 20, NO. 2, FEBRUARY 2001
Fig. 2. Two-dimensional (2-D) representations of the wrapped relative measured phases for 500 MHz as functions of both the transmitter number and associated relative receiver number. (a)-(f) correspond to cases of the scattering object having electrical properties 0.7, 0.5, 0.4, 0.3, 0.2, and 0.15 times the background medium. (g) Phase values for the relative receivers and a single transmitter (number 3) corresponding to the six cases shown in (a)-(f).
In practice, these are taken as field observations that can be recorded in the region around the body after it has been illuminated by a known source. To generate sufficient numbers of observations, multiple measurement locations can be used along with multiple excitation arrangements. In matrix form, the process can be written as
as the product of the number of excitation patterns times the number of observations per excitation. , , , and are the measured and calculated log electric field magnitude and electric field phase vectors of length , respectively. This set of equations can be solved as a least squares problem using the method of normal equations [19] by multiplying both to yield sides of (3) by
(3) is the Jacobian matrix of dimensions where where is the number of total observations which can be considered
(4)
MEANEY et al.: MICROWAVE IMAGE RECONSTRUCTION
107
Fig. 3. Two-dimensional representations of the unwrapped relative measured phases for 500 MHz as functions of both the transmitter number and associated relative receiver number. (a)-(f) Correspond to cases of the scattering object having electrical properties 0.7, 0.5, 0.4, 0.3, 0.2, and 0.15 times the background medium. (g) Phase values for the relative receivers and a single transmitter (number 3) corresponding to the six cases shown in (a)-(f).
where is the Hessian matrix. In practice, is ill conditioned because of the limited number of noisy measured field observations which can be obtained and requires regularization analogous to Ridge Regression in ill-posed linear least squares problems [20], [21]. We exploit the widely used Levenberg–Marquardt technique [22], [23] which adds a decreasing amount to the diagonal entry of a scaled version of in proportion to the squared error reduction at each iteration. Further details of our implementation and others can be found in [4], [5]. The Jacobian matrix is structured as (5)
such that each of the four submatrices is are denoted by of
. The elements (6)
where and range from one to and one to , respectively. The elements of the other three submatrices are identical analogs. They can all be expressed as (7a) (7b)
108
IEEE TRANSACTIONS ON MEDICAL IMAGING, VOL. 20, NO. 2, FEBRUARY 2001
Fig. 4. Reconstructed images of the relative permittivity and conductivity distributions for a single large object at 500 MHz without utilizing the phase unwrapping algorithm. (a)-(f) Correspond to the object electrical properties being 0.7, 0.5, 0.4, 0.3, 0.2, and 0.15 of the 0.9% saline background.
(7c)
It is noted here that except for places where changes have been made to due to imposition of boundary conditions, its nonzero terms consist of
(7d) where the log-magnitude and phase derivatives in (7) are re-expressed in terms of the real and imaginary parts of the electric and , respectively. field, To find , , , and we differentiate the matrix representation of the forward solution, , with respect to and to form (8) and (9)
(10) are standard linear Lagrange basis functions [24] where the from the finite element electric field representation and the are basis functions of the same linear form from the finite element representation of the material property distribution described by
and
MEANEY et al.: MICROWAVE IMAGE RECONSTRUCTION
109
Fig. 5. Reconstructed images of the relative permittivity and conductivity distributions for a single large object at 500 MHz while utilizing the phase unwrapping algorithm. (a)-(f) Correspond to the object electrical properties being 0.7, 0.5, 0.4, 0.3, 0.2, and 0.15 of the saline background.
Selection of these bases imply that the field and property variables are continuous and piecewise linear everywhere on their become zero exrespective meshes. Thus, the terms in is nonzero, in which case . cept when are zero except where is Likewise, all terms of . Thus, from (8) and (9) we nonzero, and can extract the derivative quantities required in (7) to construct (5) through the relationships (11) and (12) Additionally, because factor of
and
differ only by a (13)
and (14) This is important for algorithmic efficiency because all four components in (7) can be computed with a single matrix backsubstitution. B. Phase Unwrapping The primary components in (4) that require phase unwrapping and are the measured and computed electric field phases, , respectively. For relatively low frequencies and fine levels of mesh discretization in the electrical property grid, the terms and typically do not need to be unwrapped because the phase changes due to an infinitesimally small perturbation of the electrical properties at a single node in the coarse
110
IEEE TRANSACTIONS ON MEDICAL IMAGING, VOL. 20, NO. 2, FEBRUARY 2001
mesh rarely exceed at a measurement site. For both measured and computed field phase terms, we begin by evaluating the phase at the receiver sites for an individual transmitter. Either the absolute phase (across a given set of receivers for each transmitter) or the relative phase with respect to a calibration common to both the measured and computed quantities can be used. In this implementation, we found it more efficient to incorporate the measured relative phases which are computed with respect to the common calibration data set for a homogeneous target region. For the computed field phase unwrapping, the algorithm compares phase values at receiver sites proceeding counter-clockwise around the target region, either adding or subtracting when the difference between adjacent sites exceeds . Difficulties can arise in this procedure when the receiver sites are separated by electrically large distances in which case phase differences may be quite large. This problem can be easily alleviated by computing additional electric field values at intermediate positions between the predetermined receiver sites and subsequently re-applying the phase unwrapping scheme. Using this approach, unwrapping of the computed phase values can be efficiently accomplished and incorporated into our existing numerical algorithm. Phase unwrapping is not as readily processed for the measured phase values. Generally, there is a lower limit to the receiver antenna spacing. Further, it is entirely possible to observe phase differences greater than for adjacent receivers at relatively high frequencies. In these situations, examining individual receiver data sets for a single transmitter does not provide intermediate field values that can be exploited to differentiate between phase differences which should and should not exceeded. For these cases, it is instructive to plot the relative measured phase in a 2-D coordinate system with the abscissa being the transmitter number and the ordinate being the relative receiver number, respectively. Contour plots of these distributions clearly illustrate where the breaks between Rieman sheets occur and allow for relatively straight forward phase unwrapping either by manual means or by employing algorithms developed for analogous situations in the magnetic resonance imaging (MRI) arena [25]–[27]. While these methods will successfully unwrap the phase values relative to themselves, it is important to establish a technique to determine which Rieman sheet should be the actual baseline prior to utilizing the data for image reconstruction. In some circumstances, various types of a priori information may prove useful. While this task may require a certain level of operator input or the application of any one of the phase unwrapping strategies cited above, it is fortunate that the process need only be performed once for the measured data prior to executing the reconstruction algorithm. III. RESULTS Sections III-A and III-B demonstrate results from simulated experiments which illustrate cases where the conventional image reconstruction algorithm breaks down while the logphase version retains suitable image quality. The set of exper-
PTWP
Total
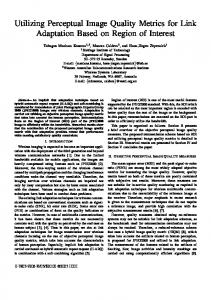
Fig. 6. The percent total unwrapped phase (PTWP) and the average unwrapped phase: � fraction (AUPPF) as functions of the scatterer composition with respect to the background medium at 500 MHz.
iments in Section III-A involve a single operating frequency illuminating a large variable contrast object embedded in a background medium. The experiments in Section III-B include the same object but with a fixed contrast to the same background where the illumination frequency is incrementally raised. A single large object was selected as the benchmark to perform these tests because it is a relatively simple geometry which can supply sufficient contrast to induce large phase variations between receiver positions. It is also reasonably representative of breast imaging which is one of our targeted applications [28]. Finally, Section III-C presents some representative results for an ex vivo breast tissue phantom. We have developed two metrics, the percent total unwrapped phase, PTWP, and the average unwrapped phase : fraction, AUPPF, to assess the threshold levels where the conventional complex value-based image reconstruction algorithm degrades. PTWP is defined as shown in (15) at the bottom of the page and AUPPF is defined as
AUPPF
(16)
As will be demonstrated, in certain instances where only a small number of measured electric field values are phase wrapped, the conventional algorithm is able to produce high-quality images. However, in other situations where a considerable percentage of measured data is phase wrapped, the degree of phase wrapping can be related to algorithmic performance and used to quantify when the phase variation is sufficient to require the log-phase image reconstruction approach.
of Measured Phase Values Requiring Unwrapping Total of Measured Phase Values
(15)
MEANEY et al.: MICROWAVE IMAGE RECONSTRUCTION
111
Fig. 7. Two-dimensional representations of the wrapped relative measured phases for a single object with electrical properties 0.4 times that of the saline background as functions of both the transmitter number and associated relative receiver number. (a)-(e) correspond to operating frequencies of 500, 600, 700, 800, and 900 MHz. (f) Phase values for the relative receivers and a single transmitter (number 3) corresponding to the five cases shown in (a)-(e).
Fig. 8. Two-dimensional representations of the unwrapped relative measured phases for a single object with electrical properties 0.4 times that of the saline background as functions of both the transmitter number and associated relative receiver number. (a)-(e) Correspond to operating frequencies of 500, 600, 700, 800, and 900 MHz. (f) shows phase values for the relative receivers and a single transmitter (number 3) corresponding to the five cases shown in (a)-(e).
A. Single-Object Single-Frequency Contrast Study In this section, simulated measurement data was used to reconstruct images of a large single object with varying contrast relative to the background obtained at an operating frequency
of 500 MHz. The experimental configuration consisted of 16 monopole antennas positioned on a 15.2-cm-diameter circle about a 13-cm-diameter target region. In practice, the antennas within the array interact and we have developed a nonactive antenna compensation method [11], [18] for use with exper-
112
IEEE TRANSACTIONS ON MEDICAL IMAGING, VOL. 20, NO. 2, FEBRUARY 2001
Fig. 9. Reconstructed images of the relative permittivity and conductivity distributions for a single large object with electrical properties 0.4 times the saline background without utilizing the phase unwrapping algorithm. (a)-(e) Correspond to operating frequencies of 500, 600, 700, 800, and 900 MHz.
imental data (e.g., in Section III-C). For simulation studies, we ignore these interactions because the synthetic data can be generated from idealized models of the radiating and receiving antennas. The finite element mesh used to compute the forward solutions had 2012 nodes and 3878 elements. Similarly, the material property mesh had 142 nodes and 246 elements on the same size circle. Fig. 1 shows the arrangement of antennas with respect to the target region and demonstrates the relationship between a given transmitter and its respective set of receivers. In Fig. 1, the electrical properties of both the background, denoted as the target region, and the object are recovered during the inversion process. The electrical properties of the 78.47 and background were: relative dielectric constant, 1.66 S/m. Six cases are presented electrical conductivity,
for material properties of the offset object: 0.7, 0.5, 0.4, 0.3, 0.2, and 0.15 times that of the background value, providing a wide range of property contrast for study. Fig. 2(a)–(f) illustrates the phase contour map for each data set where the abscissa and the ordinate of the graph correspond to the transmitter and relative receiver numbers, respectively, for the cases where the simulated measured phase values have not been unwrapped. Fig. 2(g) shows transects of the corresponding phase contour plots for the receivers associated with global transmit antenna number 3 (Fig. 1). In the first three cases, no phase wrapping has occurred and the main phase projection of the object is clearly evident as it oscillates in a serpentine manner with respect to the transmitter number. However, the phase wrapping is obvious in the latter three cases as the contrast increases.
MEANEY et al.: MICROWAVE IMAGE RECONSTRUCTION
Fig. 3(a)–(g) illustrates similar plots for the same data of Fig. 2 with the phase values unwrapped. From this analysis it would appear that image reconstruction difficulties will occur for the latter three cases when the phase wrapping is not taken into account. Figs. 4 and 5 illustrate the recovered relative permittivity and conductivity images for the measurement data presented in Figs. 2 and 3, respectively. The images in Fig. 4 were produced with our previous algorithm which mapped the measured phase data onto a single Rieman sheet in the complex plane through complex-number representation, whereas Fig. 5 shows the identical image pairs when the log-phase algorithm is used which unwraps measured phase onto multiple Rieman sheets. Reconstructions were completed in 15 iterations in all cases which allowed sufficient time to reach solution convergence. For reconstructions not utilizing the log-phase scheme, it appears that the inversion process significantly degrades for the last two cases (where the object properties are 20% of the background medium or less). Looking at Fig. 6, the degradation in the inversion process corresponds to situations where the percent of phase data requiring unwrapping (PTWP) fraction exceeds 44% and the average unwrapped phase: (AUPPF) exceeds 0.86. Based on these results we can qualitatively describe cases below this threshold as exhibiting mild phase wrapping while those in excess as having high phase wrapping. This suggests that in situations (case d) where there is mild phase wrapping between receiver positions for some of the data within the object’s projection, our original algorithm is capable of recovering the object with sufficient fidelity. When the phase unwrapping scheme is incorporated, the log-phase algorithm is able to provide quality images for all object contrast cases, including those beyond 20% of the background. This clearly indicates that mapping the receiver phases to unique values that may span multiple Rieman sheets improves image reconstruction in these difficult high-contrast large object problems. B. Single-Object Set-Contrast Frequency Study In this section, the same object has been employed with a fixed property contrast to the background (object properties were 40% of the background medium). The geometrical configuration of the antennas with respect to the meshes and the background material were also identical. The image reconstruction experiments were performed over a range of frequencies (500, 600, 700, 800, and 900 MHz) to examine where the phase wrapping effects become significant. Fig. 7(a)–(e) illustrates the phase contour map for each data set where the simulated measured phase values have not been unwrapped. Fig. 7(f) shows transects of these phase contour plots for all of the relative receivers associated with transmitter 3. For the first frequency, 500 MHz, the phase plot is free of any phase wrapping; however, phase wrapping is clearly evident in the latter four cases corresponding to 600, 700, 800, and 900 MHz. Fig. 8 shows similar plots for the same data in Fig. 7 with the phase values unwrapped. Fig. 9 illustrates the recovered images for the cases presented in Fig. 7. It appears that the reconstruction process degrades entirely for the 900 MHz case with some noticeable abnormal-
113
Fig. 10. The percent total unwrapped phase (PTWP) and the average unwrapped phase: � fraction (AUPPF) as functions of frequency with the scatterer composition fixed at 40% of the background medium.
ities appearing at 800 MHz as well when the standard complex-number representation is used. For the three lower frequency cases, the object perimeters are clearly defined and the electrical property distribution is quite uniform over the recovered object in the real part of the images. For the imaginary component, there is a consistent but minor perturbation in the object center. Similarly to the analysis in Fig. 6 for the single frequency contrast study, the data plotted in Fig. 10 shows the threshold for the inversion process breakdown is near 46% for PTWP and 0.86 for AUPPF, respectively. These thresholds are similar to those for the single-frequency contrast study which suggests that these metrics are useful tools for predicting when phase wrapping is detrimental in complex value-based image reconstruction. Fig. 11 illustrates the recovered images for the measurement data presented in Fig. 8 which has been unwrapped and supplied to the log-phase algorithm. The object is adequately recovered for all frequencies although there appears to be minor smearing of the real component of the recovered object with the background closest to the target region boundary for frequencies above 500 MHz. Otherwise, the real component of the object is relatively uniform. For the imaginary component of the recovered images, the perimeter of the object is clearly identified while there are some minor inhomogeneities within the object at the highest frequency, not unlike those observed in the low frequency cases (500–700 MHz) in Fig. 9. C. Ex Vivo Imaging Experiments Imaging experiments were performed using an 8.2 cm diameter cylindrical sample of mammary tissue acquired from breast reduction surgery illuminated at a frequency of 600 MHz. The physical dimensions of the monopole antenna array used in the data acquisition corresponded exactly to those modeled in the simulation studies. The electrical property values of the 0.9% 76.9 and 1.90 S/m saline background medium were 7.27 and while typical values for the tissue sample were,
114
IEEE TRANSACTIONS ON MEDICAL IMAGING, VOL. 20, NO. 2, FEBRUARY 2001
Fig. 11. Reconstructed images of the relative permittivity and conductivity distributions for a single large object with electrical properties 0.4 times the saline background while utilizing the phase unwrapping algorithm. (a)-(e) correspond to operating frequencies of 500, 600, 700, 800, and 900 MHz.
0.071 S/m. Consistent with data presented in the simulation studies, Fig. 12 illustrates the wrapped and unwrapped phase distributions for the breast tissue sample where it is evident that the phase variation between receivers has been compressed when the phase is wrapped. Fig. 13 shows the recovered images for the two data sets reported in Fig. 12. When the complex number representation is used [Fig. 13(a)], the algorithm has converged to an uninteresting electrical property distribution. The imaginary part of the image shows an increase in conductivity with respect to the background where there should be a significant decrease. The real part image contains a ring of lower dielectric material with a dramatic (but incorrect) increase in value at the center of the tissue cylinder. The PTWP and AUPPF values for this case are
73.6% and 1.52, respectively. Given that these exceed the previously determined thresholds by considerable amounts, it is not surprising that the conventional algorithm cannot recover the breast tissue properties with any fidelity. The images from the reconstruction utilizing phase unwrapping and the log-phase algorithm are considerably better [Fig. 13(b)]. In general, the electrical property values recovered for the target tissue are in line with expectations. The imaginary component exhibits good definition of the tissue perimeter although the real part of the recovered object smears somewhat with the right side of the target region boundary. These results show that the log-phase reconstruction algorithm can improve recovery of large, highly scattering bodies in a laboratory scale experiment when the phase data is unwrapped.
MEANEY et al.: MICROWAVE IMAGE RECONSTRUCTION
115
(a) Fig. 12.
(b)
Two-dimensional representations of the relative measured phases for an ex vivo breast tissue sample. (a) Wrapped and (b) unwrapped.
(a)
(b)
Fig. 13. Reconstructed images of the relative permittivity and conductivity distributions for an ex vivo breast tissue sample: (a) without phase unwrapping reconstruction algorithm and (b) with phase unwrapping algorithm.
IV. DISCUSSION AND CONCLUSION The results presented here have demonstrated that phase wrapping between receivers in a measurement array can be significant in microwave imaging and may be responsible for algorithms either converging to local minima solutions or diverging altogether in some cases. In situations where a small subset of the measured phase values have been wrapped, our Maxwell equation model-based algorithm which exploits only complex number representation converges to a meaningful image. However, beyond a certain threshold of phase wrapping between receivers, image reconstruction degrades significantly without incorporating a technique to utilize the information which has been lost or inject a priori information during the imaging process. The thresholds established for the two metrics we introduced here appear to be good indicators of when a reconstruction algorithm based on complex number representations is unable to accurately recover the electrical
property distribution of the target region. In terms of the PTWP, the threshold is just below 50%, suggesting that when phase information is wrapped in approximately half of the measured data, image reconstruction suffers accordingly. We have successfully implemented a version of our image reconstruction algorithm which uses measured phase and log magnitude data directly. In cases where phase wrapping between receivers occurs, we have identified strategies for processing the data that are consistent with schemes employed in other areas such as MRI which are convenient to our hardware and software implementation. While our approach to unwrapping the phase data between receivers is primitive, its incorporation into the log-phase reconstruction algorithm clearly illustrates that better images result in single object, high-contrast situations, both in simulations and experimentally. It should also be noted that the log-phase modification alters the convergence behavior of our reconstruction algorithm, presumably due to changes in the objective function surface when
116
IEEE TRANSACTIONS ON MEDICAL IMAGING, VOL. 20, NO. 2, FEBRUARY 2001
the data transformation is applied. In the previous version of the algorithm, the greatest contributions to the root-mean-square error (rms) electric field error were produced by data recorded at receiver antennas closest to the transmitter (see Fig. 1). Even when the relative field errors at these receivers are minor, their absolute error contributions dominate compared to those from other antennas with low absolute field values. This is generally undesirable because the greatest field perturbations will occur at receiver sites which are part of the object’s direct projection. This problem is obviated when the reconstruction algorithm is modified to utilize a log-phase representation which expresses the field error vector in terms of the relative phase and amplitude differences. With this formulation, it is precisely the electric field differences from the receivers in the direct projection which produce greater contributions to the rms field error computation. These considerations significantly impact the convergence behavior of the image reconstruction algorithm and require further study with respect to choosing a suitable regularization technique and determining optimal weighting parameters. REFERENCES [1] F. Duck, Physical Properties of Tissue: A Comprehensive Reference Book. London, U.K.: Academic, 1990. [2] N. Joachimowicz, C. Pichot, and J. P. Hugonin, “Inverse scattering: An iterative numerical method for electromagnetic imaging,” IEEE Trans. Antennas Propagat., vol. 39, pp. 1742–1752, Dec. 1991. [3] S. Caorsi, G. G. Gragnani, and M. Pastorino, “A multi-view microwave imaging system for two-dimensional penetrable objects,” IEEE Trans. Microwave Theory Tech., vol. 39, pp. 845–851, May 1991. [4] P. M. Meaney, K. D. Paulsen, and T. P. Ryan, “Two-dimensional hybrid element image reconstruction for TM illumination,” IEEE Trans. Antennas Propagat., vol. 43, pp. 239–247, Mar. 1995. [5] A. Franchois and C. Pichot, “Microwave imaging-complex permittivity reconstruction with a Levenberg–Marquardt method,” IEEE Trans. Antennas Propagat., vol. 45, pp. 203–215, Feb. 1997. [6] A. E. Souvorov, A. E. Bulyshev, S. Y. Semenov, R. H. Svenson, A. G. Nazarov, Y. E. Sizov, and G. P. Tatsis, “Microwave tomography: A twodimensional Newton iterative scheme,” IEEE Trans. Microwave Theory Tech., vol. 46, pp. 1654–1659, Feb. 1998. [7] N. Joachimowicz, J. J. Mallorqui, J. C. Bolomey, and A. Broquetas, “Convergence and stability assessment of Newton–Kantorovich reconstruction algorithms for microwave tomography,” IEEE Trans. Med. Imag., vol. 18, pp. 562–570, Aug. 1998. [8] A. Franchois, A. Joisel, C. Pichot, and J. C. Bolomey, “Quanitative microwave imaging with a 2.45-GHz planar microwave camera,” IEEE Trans. Med. Imag., vol. 17, pp. 550–561, Aug. 1998. [9] P. M. Meaney, K. D. Paulsen, and J. T. Chang, “Near-field microwave imaging of biologically-based materials using a monopole transceiver system,” IEEE Trans. Microwave Theory Tech., vol. 46, pp. 31–45, Jan. 1998.
[10] M. Slaney, A. C. Kak, and L. E. Larsen, “Limitations of imaging with first-order diffraction tomography,” IEEE Trans. Microwave Theory Tech., vol. 32, pp. 860–874, Aug. 1984. [11] K. D. Paulsen and P. M. Meaney, “Nonactive antenna compensation for fixed array microwave imaging: Part I—Model development,” IEEE Trans. Med. Imag., vol. 18, pp. 496–507, June 1999. [12] O. P. Franza, “Formal compensation of sensor-related interactions for microwave tomography,” Ph.D. dissertation, Univ. Illinois at UrbanaChampaign, 1998. [13] O. S. Haddadin and E. S. Ebbini, “Imaging strongly scattering media using a multiple frequency distorted born iterative method,” IEEE Trans. Ultrason., Ferroelect., Freq. Contr., vol. 45, pp. 1485–1496, Nov. 1998. [14] P. M. Meaney, K. D. Paulsen, and T. P. Ryan, “Two-dimensional hybrid element image reconstruction for TM illumination,” IEEE Trans. Antennas Propagat., vol. 43, pp. 239–247, Mar. 1995. [15] P. M. Meaney, K. D. Paulsen, A. Hartov, and R. K. Crane, “An active microwave imaging system for reconstruction of 2-D electrical property distributions,” IEEE Trans. Biomed. Eng., vol. 42, pp. 1017–1026, Oct. 1995. [16] K. D. Paulsen, P. M. Meaney, M. J. Moskowitz, and J. M. Sullivan Jr., “A dual mesh scheme for finite element based reconstruction algorithms,” IEEE Trans. Med. Imag., vol. 14, pp. 504–514, June 1995. [17] P. M. Meaney, K. D. Paulsen, A. Hartov, and R. K. Crane, “Microwave imaging for tissue assessment: Initial evaluation in multitarget tissueequivalent phantoms,” IEEE Trans. Biomed. Eng., vol. 43, pp. 878–890, Sept. 1996. [18] P. M. Meaney, K. D. Paulsen, J. T. Chang, M. W. Fanning, and A. Hartov, “Nonactive antenna compensation for fixed array microwave imaging: Part II—Imaging results,” IEEE Trans. Med. Imag., vol. 18, pp. 508–518, June 1999. [19] G. H. Golub and C. F. van Loan, Matrix Computations, 2nd ed. Baltimore, MD: Johns Hopkins Univ. Press, 1989, pp. 193–259. [20] D. W. Marquardt, “Generalized inverse, ridge regression biased linear estimation, and nonlinear estimation,” Technometr., vol. 12, pp. 591–612, 1970. [21] G. H. Golub, M. Heath, and G. Wahba, “Generalized cross validation as a method for choosing a good ridge parameter,” Technometr., vol. 21, pp. 215–223, 1979. [22] K. Levenberg, “A method for the solution of certain nonlinear problems in least squares,” Quart. Appl. Math., vol. 2, pp. 164–168, 1944. [23] D. W. Marquardt, “An algorithm for least-squares estimation of nonlinear parameters,” J. Soc. Ind. Appl. Math., vol. II, pp. 431–441, 1963. [24] J. Jin, The Finite Element Method in Electromagnetics. New York: Wiley, 1993. [25] J. Szumowski, W. R. Coshow, F. Li, and S. F. Quinn, “Phase unwrapping in the three-point Dixon method for fat suppression MR imaging,” Radiology, vol. 192, pp. 555–561, 1994. [26] M. Hedley and D. Rosenfeld, “A new two-dimensional phase unwrapping algorithm for MRI images,” Magn. Reson. Med., vol. 24, pp. 177–181, 1992. [27] G. H. Glover and E. Schneider, “Three-point Dixon technique for true water/fat decomposition with B inhomogeneity correction,” Magn. Reson. Med., vol. 18, pp. 371–383, 1991. [28] P. M. Meaney, M. N. Fanning, D. Li, S. P. Poplack, and K. D. Paulsen, “A clinical prototype for active microwave imaging of the breast,” IEEE Trans. Microwave Theory Tech., vol. 48, pp. 1841–1853, Nov. 2000.