Microzonation models for Montreal with respect to $$\hbox {V}_\mathrm{S30}$$ V S 30 Ph. Rosset, M. Bour-Belvaux & L. Chouinard
Bulletin of Earthquake Engineering Official Publication of the European Association for Earthquake Engineering ISSN 1570-761X Bull Earthquake Eng DOI 10.1007/s10518-014-9716-8
1 23
Your article is protected by copyright and all rights are held exclusively by Springer Science +Business Media Dordrecht. This e-offprint is for personal use only and shall not be selfarchived in electronic repositories. If you wish to self-archive your article, please use the accepted manuscript version for posting on your own website. You may further deposit the accepted manuscript version in any repository, provided it is only made publicly available 12 months after official publication or later and provided acknowledgement is given to the original source of publication and a link is inserted to the published article on Springer's website. The link must be accompanied by the following text: "The final publication is available at link.springer.com”.
1 23
Author's personal copy Bull Earthquake Eng DOI 10.1007/s10518-014-9716-8 ORIGINAL RESEARCH PAPER
Microzonation models for Montreal with respect to VS30 Ph. Rosset · M. Bour-Belvaux · L. Chouinard
Received: 5 March 2013 / Accepted: 11 December 2014 © Springer Science+Business Media Dordrecht 2014
Abstract The development of seismic microzonation maps is now a prerequisite for performing advanced seismic hazards and seismic risk assessments in urban areas. Current microzonation procedures are based on classifying site response in soil categories based on VS30 . In many practical cases, information on shear wave velocity is sparse and analysts must resort to other sources of information to develop zonation maps over large regions. For Montreal, Canada, a geostatistical approach combining a large dataset of boreholes, f0 data from the H/V method, and a limited number of shear wave velocity measurements is proposed. Predictive equations are developed with the different types of information and partly used to create three different Vs30 models: A first model based on the total thickness of soft soil deposits (One Layer Model), a second model based on stratigraphy obtained from borehole data (Four Layers Model) and a third model (Composite Model) that combines data from the previous two models with data from seismic surveys. Variability and uncertainty associated with the choice of the models are described and estimated using a second moment analysis. The composite model which combines borehole, f0 and Vs data is shown to be the most accurate compared to models derived only from borehole and Vs data (an average reduction of 40 % of the squared error) and shows good agreement with the geological map for clay and sand locations with soils classes C and D (54 % agreement on average). This approach opens new perspectives for Vs30 microzonation in urban areas when budgets for Vs surveys are limited. Keywords Seismic microzonation · Shear wave velocity · Fundamental frequency · Uncertainty · Mapping
Ph. Rosset (B) · L. Chouinard Civil Engineering and Applied Mechanics, McGill University, Macdonald Engineering Building, 817 Sherbrooke Street West, Montreal, QC H3A 2K6, Canada e-mail:
[email protected] M. Bour-Belvaux Risks and Prevention Division, BRGM, 3 Avenue Claude Guillemin, 45100 Orleans, France
123
Author's personal copy Bull Earthquake Eng
1 Introduction Montreal is ranked second in Canada after Vancouver for seismic risks in terms of exposed population and seismic hazard. Although the history of felt and recorded earthquakes in the region is relatively short (Lamontagne et al. 2008), the most severe event reported mentions damage to 300 houses after the 1732 earthquake of estimated magnitude 5.8 (Leblanc 1981). Recorded seismicity since 1980 outlines two seismogenic zones: one along an NE-SW axis following the St Lawrence River passive margin, and the second along a more active SE-NW axis (Adams 2011). Probabilistic seismic hazard analysis for Montreal indicates the median PGA and PGV are 0.43 g and 0.18 m/s, respectively for a probability of exceedance of 2 % in 50 years (NBCC 2010). A desaggregation model for this level of hazard indicates that the most likely event is of magnitude 6 at a distance of 30 km (Adams and Halchuk 2003). Local site effect was exemplified on November 25th, 1988, when severe damage was observed to the masonry cladding of the former Montreal East City Hall after the Mw 5.9 Saguenay earthquake, at an epicentral distance of 350 km. Mitchell et al. (1990) attributed this damage to the combined effect of soil amplification due to the presence of a thick layer (17 m) of clay and the advanced state of deterioration of the structure prior to the earthquake. At this site, the average transfer function calculated from a set of 1D numerical simulations using SHAKE91 (Idriss and Sun 1992) shows a well-defined peak around 2 Hz with an average amplification factor of 7. The H/V spectrum also exhibits a clear peak at a similar frequency which correlates well with the natural period of the building (Chouinard and Chouinard 2007). This approach of combining resonance frequency derived from H/V data with amplification factors from 1D modeling was used at 700 sites across the island to produce a first microzonation mapping of Montreal for three different earthquake scenarios (Rosset and Chouinard 2009; Chouinard and Rosset 2011). The authors proposed to group sites into four classes combining resonance frequency and relative amplification, the most significant class corresponding to frequencies ranging from 2 to 7 Hz and with amplification factors between 2 and 3. However, this microzonation is not related to the National Building Code soil classification based on VS30 (NBCC 2010). Since estimates of VS30 from seismic surveys are expensive and time-consuming to perform over large regions, alternative methods using ambient noise records have been developed to obtain this parameter (e.g. Chouinard 2012; Castellaro and Mulargia 2009; Zhao et al. 2006). Over the course of several years, a total of 1,650 sites were investigated with this technique in Montreal. First, a procedure is proposed for combining data from H/V measurements, boreholes and data on Vs profiles obtained from seismic surveys to derive three VS30 microzonation models with increasing levels of completeness in terms of data; (1) using depth to bedrock borehole data to create a one layer model with 26,600 sites, (2) using detailed borehole data to define a four layers model with 2,452 sites and (3) combining H/V, borehole and direct VS30 data to create a composite model with 2,520 sites. Over the last decade, other approaches to seismic microzonation have been proposed using geotechnical data (e.g. Lebrun et al. 2004), numerical modeling (e.g. Capua et al. 2014; Ansal et al. 2010) or surface and downhole seismic data (e.g. Motazedian et al. 2011). Thompson et al. (2010), in the Kobe region, Japan, show that models using geostatistical methods for interpolation perform better than models using geological units or topographic slope. Scott et al. (2006) also commented on the comparative accuracy of soil classifications using various sources of information and on extrapolations away from surveyed sites. Second, the performance of the models are evaluated and compared by using second moment analysis (e.g. Benjamin and Cornell 1970) for each of the soil classes and to estimate
123
Author's personal copy Bull Earthquake Eng
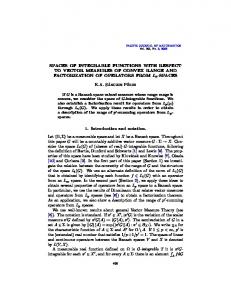
Fig. 1 Simplified geological map (modified from Prest and Hode-Keyser (1977)). The location of Vs field measurements are also shown
the uncertainty on VS30 as a function of spatial location and the amount and quality of data available in proximity to each site.
2 Methodology for Vs and microzonation The surface geology of Montreal based on the work of Prest and Hode-Keyser (1977) is shown on the map of Fig. 1. Bedrocks are limestone and shale from the Cambrian–Ordovician period. During the Wisconsinan glacial episode, glaciers retreated and surged forward several times, resulting in the deposition of several different types of glacial tills. After the final retreat of the ice over Montreal, around 12,500 years ago, the Champlain Sea was formed and covered the region for 6,000 years, which provided the environment for the deposition of a unique form of highly sensitive marine clay, the Leda clay, which has the property of changing from a relatively stiff material to a liquid form when it is mechanically disturbed. The current period is characterized by erosion and deposition of sand by the Saint-Lawrence River (Wise 2000). The thickest post-glacial deposits (about 35 m) can be found at the northeast tip of the Island and shallower deposits (few meters) in the western part of the Island. The choice of methods to estimate Vs at a set of sites depends on budgetary and time constraints as well as on limitations associated with the level of background noise from urban activities (e.g. Hunter and Crow 2012 for a comprehensive list of methods). Three surface and downhole shear wave seismic survey methods were used at selected sites in
123
Author's personal copy Bull Earthquake Eng
order to obtain Vs estimates at different depths for the prevalent types of soil deposits in Montreal (Fig. 1). 1. The Multichannel Analyses of Surface Waves or MASW method (Park et al. 2005) was used at 29 sites, mainly located in city parks in Montreal and the neighboring cities of Laval and Longueil. Measurements were performed with 24 geophones with a 4.5 Hz natural frequency positioned along linear survey lines (with receiver spacing varying between 1–3.5 m and source offset varying between 10–25 m). At each location a set of 6 to 8 records were obtained by using an active source (standing jump or hammer on steel). Each record was processed individually by Park Seismic LLC (2010) for dispersion image data and a fundamental-mode dispersion curve was extracted from the image. Each dispersion curve was inverted to obtain the most probable 1-D shear-velocity profile by using least-square optimization with an initial model of nine layers and depth to bedrock obtained from the closest borehole [see Park (2010) for more details]. The velocity profile most consistent with the soil layering from the closest borehole was then selected. Estimates of Vs for each soil type were obtained at the mid point of the layer. 2. The Downhole seismic method was used at three sites with a typical depth interval of 50 cm as suggested in Hunter et al. (1998). One of the boreholes was surveyed down to the bedrock (at 34 m) while the two other ones were surveyed down to the till layer (∼12 m). The source (hammer on I-beam) was set at a 3 m offset from the borehole. Interval and average Vs were compiled as a function of depth and related to soil type along the length of the borehole. In the sand layers, the interval velocity is positively correlated with the normalized standard penetration index (N-SPT). 3. The High Resolution multichannel Seismic Reflection method (HRSR, Pugin et al. 2007) was used along three road segments totaling 7.5 km. Measurements were performed with a 48 channel 3-component land-streamer and an IVI MiniVib source (Pugin et al. 2008). Interval S-wave velocity was calculated at three to four depths every 25 m along the profiles and then converted to average shear wave velocity (Vav ). The main reflector is typically the top of glacial sediments. The Vs measurements obtained at different depths are correlated with the four prevalent soil layers in Montreal; (1) backfill and peat, (2) sand, (3) Leda clay and (4) till, by identifying soil types from nearby boreholes. The purpose of this analysis is to develop models for Vs profiles to be used for estimating VS30 at sites where seismic measurements are not available. Backfill materials represent the top soil layer at most locations with a thickness varying from 1 to 5 m. Materials composing this layer are very heterogeneous and the HRSR method cannot provide good estimates of Vs . The MASW method often indicates lower Vs for backfill material than for sand or clay layers, while downhole data indicate Vs around 155 m/s. The latter value is used for our analysis. For clay and sand deposits, a total of 197 and 232 observations Vs were compiled from the combined data sets from downhole, MASW and HRSR measurements. Weighted non-linear regressions of Vs as a function of depth (Z) are performed in order to model the increase of Vs with depth. Observations obtained from MASW are assigned a lower weight (0.5) in the estimation process due to the higher uncertainty associated with the analysis of the records. Figure 2 shows the data and resulting regressions for sand and clay up to 35 m: Vs = 144.8 + 36.8 Z0.57 (±54 m/s), for sand
(1)
Vs = 121.2 + 40.8 Z
(2)
0.43
(±43 m/s), for clay
The uncertainty for predicted values of Vs (RMSE is given in brackets) for clay and sand as a function of depth is large and can be explained by the variability in compaction and soil
123
Author's personal copy Bull Earthquake Eng
Fig. 2 Estimated Vs for the 3 main soil deposits and bedrock in Montreal. Vs relation with depth is proposed for a sand and b clay
Fig. 3 Average Vs for a glacial tills and b bedrock is estimated from the distribution of available values. Numbers on the x-axis are the upper bound limit
composition (e.g. grain size distribution) which are not accounted for in the regressions. The p-values for all the coefficients and for the non-linear regression equations were found to be significant at the 0.05 significance level ( p < 0.001 in all cases). Estimates of Vs for tills are obtained from MASW and downhole measurements and show values ranging from 200 to 1,300 m/s (Fig. 3a). The histogram shows three groups of values that speculatively could be related to the three main episodes of the last glaciation. This variability may be due to differences in material composition as well as deposition history. However, because it is not possible to determine the type of till at any particular location, the average value of 565 m/s is used, keeping in mind that the standard deviation is high and around 261 m/s.
123
Author's personal copy Bull Earthquake Eng
Fig. 4 Variation of average velocity Vav derived from seismic high resolution profiles with depth
Bedrock in Montreal consists mainly of limestone and shale. P-wave velocity measurements (Vp ) at 160 sites are available from proprietary seismic refraction surveys and laboratory measurements. Vs is estimated using the ratio Vp /Vs which typically varies between 1.6 and 1.9 for shale and limestone (e.g. Mavko and Mukerji 1998). A ratio of 1.9 is adopted to be on the conservative side. Figure 3b shows the distribution of shear wave velocities and indicates a wide range of values which may be associated with the varying degree of weathering or fracturing of the bedrock. A mean Vs value of 2,300 m/s and a standard deviation of 590 m/s are assigned to all bedrock. The average shear wave velocity Vav data from HRSR allow to derive a relationship with the depth of post-glacial sediments (all soil types confounded). The data set comprises 380 observations (Fig. 4). The best-fit regression between Vav and the depth to bedrock Z (the maximum depth is around 35 m) is expressed by: Vav = 170 + 29 Z0.5 (±50 m/s)
(3)
Two trends appear in the data shown in Fig. 4. The first one with lower velocities is associated with sites along Notre Dame East Blvd and the Jardin Botanique. The second trend has higher velocities for locations along Notre Dame West Blvd and Girouard Street. Differences in average velocities are in the range of 26 to 38 % for the two groups for thicknesses ranging from 1 to 35 m (Fig. 4). This difference may be attributed to the preponderance of clay
123
Author's personal copy Bull Earthquake Eng
Fig. 5 Relation between VS30 derived from various seismic methods and resonance frequency f0 of soil estimated from spectral ratio of ambient noise records
deposits in the first group compared to the second group, which comprises a sand layer at the surface with higher Vs values. Another explanation could be attributed to the distinction between stiff and soft clays. Soft clays tend to be located at higher elevations away from the river while stiffer clays tend to be located at lower elevations close to the river. At this stage, no clear rule can be formulated to assign one of the two trends to a particular site because properties of glacial and post-glacial deposits are not well known. Rosset and Chouinard (2009) indicated a strong correlation between soil column fundamental frequency (f0 ) and the thickness of Leda clay overlaying till or bedrock for Montreal locations using a dataset from 1,003 sites. A new relationship between f0 and VS30 is investigated by analyzing data from 69 sites where both VS30 from seismic surveys and f0 from ambient noise measurements were acquired (Fig. 5). The best correlation (R2 = 0.71) is obtained with a linear regression for frequencies up to 10 Hz: VS30 = 177 + 44.7 f0 (±89 m/s)
(4)
This equation is valid for bedrock to the depth of 30 m and for sites where sand, and particularly clay layers, are clearly identified on geological maps.
3 Proposed microzonation models The equations for predicting shear velocity profiles or VS30 from site specific information are considered for producing three different microzonation models. A dataset of more than 26,600 boreholes is first used to develop a map for the depth to bedrock. The data set covers mainly parts of the island where roads, subways and lifelines are built. This first model is called One Layer Model and abbreviated OLM since it uses only a single layer of glacial and post glacial deposits overlying bedrock. For a subset of approximately 2,500 boreholes, a detailed soil profile soil is provided with information on the four prevalent layers (i.e. backfill and peat, sand, clay, and till). This second model is called Four Layer Model and abbreviated FLM. The last model is a composite model (called Composite Model and abbreviated CM)
123
Author's personal copy Bull Earthquake Eng
Fig. 6 Microzonation map of Montreal using the One Layer Model of glacial and post-glacial deposits. Black dots locate used data
that combines information from the previous models plus geological and empirical data in specific part of the island. For each model, values for measured or predicted VS30 are interpolated on a regular spatial grid with a 50 m resolution using a weighted natural neighborhood procedure (Sibson 1981). The interpolation on the grid is performed on VS30 and classifies sites according to the VS30 soil classes A (>1,500 m/s), B (760–1,500 m/s), C (360–760 m/s), D (180–360 m/s) and E (