ACSIJ Advances in Computer Science: an International Journal, Vol. 3, Issue 2, No.8 , March 2014 ISSN : 2322-5157 www.ACSIJ.org
Middle East User Navigation in Online Social Networks and Interactions in E-Commerce, an Analogy Mehrdad Zaker Shahrak1, Shahriar Mohammadi2, Hamid Safarpour3 1
Industrial Engineering Department, K.N.Toosi University of Technology, Tehran, Iran
[email protected]
2
Industrial Engineering Department, K.N.Toosi University of Technology, Tehran, Iran
[email protected] 3
Southern Illinois University, USA
[email protected]
at wide variety of uses in online social environments, from finding professionals and getting familiar to their area of expertise (ex. LinkedIn) to hang out with friends and sharing content to others (Google+ & Facebook). Virtual online community nowadays plays inseparable role in people’s life. This fact illustrates why users tend to spread their activities among more OSNs.[3]. Internet penetration among young proportions of developing countries is more than 65 percent [4], also most of them are users of social networks like Facebook, Google+ , Twitter, etc. For instance, Facebook reaches about 1.11 billion monthly active users as of March 2013 [5]. Google+ has over 500 million users with just 17 months since launched as beta in June 2011 [6]; and Twitter is now experiencing more than 300 million Tweets per day [7]. In past researches, lack of organized and comprehensive research on e-commerce scope of developing countries (i.e. Iran) is obvious. Some sporadic efforts had been done, but there was no comprehensive research. Understanding user behavior and navigation in Online Social Networks have an indispensable role in development of more effective social network sites,[8] which in turn can contribute to better privacy policies. Developing precise models for understanding the user behavior in Social Networks is of great importance, because it influences embedded brand perception through social networks.[1] for instance, analysis of member’s activity in embedded brand communities in OSNs makes the organization able of expanding their influence on their online customers alongside with gaining trust and reputation in virtual online communities. Only few recent researches studied the impact of obtained data from OSNs. As an example, permanent messages from a user to his own friends. [9, 10]. When we survey user activities as workload to the OSNs, their activities could not be presented as “apparent” activities. A perfected approach to research OSN influences in middle-east could be studying clickstream data that includes all activities of users of those countries in Social Network sites. [1, 11] an appropriate study contains data of visible interactions and can dis-
Abstract User navigation Understanding gives both the researchers and firms the opportunity to design better interfaces, gain more active users and richer studies of online social interactions. This study is based on the clickstream data, collected over 15 days period, summarizing HTTP session of over 25000 valid requests of Middle east users from popular social networks like Facebook, Instagram, twitter, and LinkedIn. The data were gathered from a social network aggregator website, which enables users to connect their profile of multiple social networks into one site. This analysis retrieves the key factors of the social network workloads in Middle East countries, for example, how frequently people connect to social networks and for how long they stay connected, and what type of activity they do and from which sequences of activity they often use the OSN services. Additionally this process is studied from geographic perspective and the results discussed on a distance basis probability.
Keywords: Online Social Networks, User Behavior, Session, Clickstream, Social Network Aggregator
1. Introduction Over the past few years, social structure plays an important fundamental role in modern and civilized societies. Online social networks (OSNs) have become extremely popular. Nielsen report states that, social media have excess email and became the most popular online activity[1]. More than 60 percent of online users among the world take part in social network activities [1] and it forms more than one fifth of their time spent on the Internet. [2] These facts show that Social Networks regarded as one of the most, if not the only, important parts of online experience. Users able to find their friends, share and upload content, and publish information through “status” updates. The natural need of human kind to socialize can be regarded as one of the most significant reasons for which people spend their times on online social networks, for instance, take a look
32 Copyright (c) 2014 Advances in Computer Science: an International Journal. All Rights Reserved.
ACSIJ Advances in Computer Science: an International Journal, Vol. 3, Issue 2, No.8 , March 2014 ISSN : 2322-5157 www.ACSIJ.org
tribute accurate and get a comprehensive perspective of the OSN workload in Mena countries.[1] In this paper an in-depth analysis of OSN workloads based on middle-east user clickstreams and their tendency to e-commerce channel collected through a social network aggregator presented. According to the researches, social network aggregators provide users with an interface for accessing multiple online social networks in one server [1] and gathers information together under a single username. In this paper a popular social network aggregator named “KLOUT.com” used for survey analysis. Implementing a survey like [1], this research obtained a workload dataset. The dataset included activity data for more than 50,000 middle-east users who accessed various OSNs through the social network aggregator. Using the clickstream data, three types of analyses had been conducted. First, traffic and session patterns of OSN workloads characterized (Section 4). The frequency the people connect to OSN sites and the length of the connection examined. Based on the data, best fit models of session length distributions and formulas provided. New analysis strategy, developed, which could be called the workload model, to characterize user tendency to ecommerce communities embedded into OSNs (Section 5). The workload model captures dominant user activities and the transition rates between activities. To gain insight into how users interact within a given social network, the Facebook website user activity analyzed along the social graph (Section 6). The analysis indicates how often users visit their friends online profiles, photos, and videos. The model also reveals that, in terms of physical distance, users usually tend to interact mainly with local e-commerce sites and vendors. In summary, this study provides an in-depth analysis into the usage of OSN services and the users’ tendency to interact with e-commerce vendors in Middle East countries from the viewpoint of a social network aggregator. The workload data analyzed in the paper provides an accurate insight of how users navigate when they connect to OSN sites. Furthermore, data analysis suggests several interesting insights into how users interact with friends in OSNs.
extracted from network traffic and trying to distinguish the user navigation patterns in OSNs, such as Facebook. In their paper [14], they used data of a Chinese OSN to gather information on users’ profile visits and concluded that silent interplays are much more superior than visible interactions. 2.2 Geo-Location Epidemic use of mobile devises, especially smart phones, to share personal data on online social networks, added global perspectives to online social interactions and, consequently to the study of OSNs. In their survey [2], they highlighted location based services as one of the most growing interests of online social users. Another research conducted to this matter also investigated the influence of geographic information emerged from social is positive on operation improvement caching of multimedia files in a Content Delivery Network (CDN). The results of this study showed that improvement of the cache hits, sequel the improvement of cache policies regardless of social and geographic information. [15]
3. Research Methodology The dataset used in this paper is workload data collected and provided by social network aggregator.
3.1 Data Description The clickstream data that analyzed were collected over a 15-day period (January 15 through January 30, 2013). The dataset consist of summaries of general profiles information of users in OSNs who connected their data content to the social aggregator and the aggregator assessed user’s navigation and activation within social networks. The dataset summarizes requests, including information such as users comments, activation time, status updates, followers, picture uploads, friends connection, IP address of the user, login ID, URL of the social network site. After discarding events with missing fields or inappropriate for this survey, there were more than 25,000 valid requests. According to [16] the majority of the signals used to calculate the aggregator’s score are derived from combinations of attributes, such as the ratio of reactions you generate compared to the amount of content users share.
2. Literature Review
Table 1: Summary of clickstream data
2.1 Dataset There has been a rich set of studies, analyzing user behavior and data usage throughout OSNs.[12] mentioned seven unique intentions of users to use Facebook: social connection, shared identities, content, social investigation, social network surfing, and status updating. Albeit, [2] stated that more than 56% social networking users have used social networking sites for spying on their partners. There have been a few efforts using click stream data to analyze user navigation, especially middle-eastern users, in OSNs.[13] studied OSN clickstream data which is
OSNs
# Users
# Sessions
# Requests
Facebook
18,956
39,712
114,920
Twitter
11,752
20,306
27,089
LinkedIn
949
965
1226
Instagram
17,411
41,731
113,264
33 Copyright (c) 2014 Advances in Computer Science: an International Journal. All Rights Reserved.
ACSIJ Advances in Computer Science: an International Journal, Vol. 3, Issue 2, No.8 , March 2014 ISSN : 2322-5157 www.ACSIJ.org
file, Communities, and Other. Table 3 displays the list of these 5 activities with the number and fraction of users who engaged in the corresponding activity at least once and the number and fraction of the requests. The statistics of user activity in Table 3 signifies interesting information about middle-eastern user navigation. First disposition to the communities are evident both in terms of the number of users and the request volume. In fact, online users of Mena countries guided through ecommerce sites by OSN communities. Second, there is a huge amount of tendency to photo and video uploads, because looking at the advertisements about ecommerce web sites takes less time in comparison to read. So, it is natural to expect users’ disposition to photos & videos. Interestingly, [13] made very similar observations for the Hi5 social network. Moreover, Social awareness cause a person to be more concerned about his/her privacy on the Internet.[17] Third most popular activity is related to search. As a result users need to search and find their friends, their birthdays, their online activities, and connections via online social networks. As [1] observed, it is a part of one of the most common behavior across all categories which is browsing, although they have been categorized browsing into four categories, this study focuses on the relations and connections between navigation in OSNs and e-commerce tendency, especially brand equity and brand reputation, as a channel for firms to trade. Thus, this research concerns mostly on transitions of activities between 5 categories discussed before.
Table 2: Variations of Sample
Gender
Age
Male
59.3%
Female
40.7%
>16 16 – 25 26 – 35 35+
26.1% 40.4% 30.6% 2.9%
3.2 OSN Session Characteristics The length and the frequency in which people connect to OSN sites are regarded as two important factors in this survey. To estimate these quantities, the frequency and duration of sessions for each user measured.
3.3 Modeling OSN Sessions To understand the dynamics of user login and logout processes from a system’s perspective, the session interarrival times measured. Here, a case study for Instagram also presented. For better understanding, we utilize a time series t(i),i = 1,2,3, … to denote the arrival time of the ith session in the trace. The time series a(i) is defined as t(i + 1) − t(i) and it denotes the interarrival time of ith and i + 1th sessions, where workloads may belong to different users. The probability distribution function for the lognormal distribution is given by ( ( ) ) 1 f(x) = e σx√2π (1)
Table 3: Enumeration of All Activities and Their Concurrencies
With parameters μ = 2.419 and σ = 1.173 The distribution was fitted to a Zipf (zeta) distribution of the form βx with parameters α = 1.465 andβ = 4.358, which is a discrete distribution commonly used in the modeling of rare events. This distribution implies that workload lengths are highly variable when users connect to online social networks. Such high variability is in order with the contexts seen in web surfing.
Category
# Users
(%)
#Requests
(%)
Search
8,525
16.9
18244
25.5
Status Update
5,496
10.9
7961
11.1
Photo & Video
16,601
32.7
18730
26.1
Communities
15,917
31.6
21617
30.2
Other
3,814
7.6
5109
7.1
Total
50353
71661
4. User Navigation Patterns in OSNs 4.2 Transition from one activity to another
In this section a comprehensive perspective of user behavior in OSNs by characterizing the type, frequency, and sequence of activities users engage in is presented. With expansion of new analysis strategy in order to fit Mena users, which called the clickstream model[1], to identify and elaborate representative user interactions in OSNs based on obtained data.
For understanding the user activity sequence, a firstorder Makarov chain constructed based on sequence of activities from all categories. Table 4 shows the tendency probability to transmit over categories to ecommerce. For better understanding of 5 main categories in this paper, X-means clustering algorithm from [18] used which extends the popular K-means algorithm.[19]. A key advantage of X-means over K-means is that the algorithm not only provides the clusters, but also estimates the best possible number of clusters. Therefore, it’s not necessary to decide a priori the number of typi-
4.1 User Activities in OSNs In this study, there are 5 distinct types of activities that concerns. These activities grouped into the following categories: Search, Status updates, Photo & Video, Pro-
34 Copyright (c) 2014 Advances in Computer Science: an International Journal. All Rights Reserved.
ACSIJ Advances in Computer Science: an International Journal, Vol. 3, Issue 2, No.8 , March 2014 ISSN : 2322-5157 www.ACSIJ.org
cal sessions. X-means algorithm finds clusters by minimizing the sum of the squared distances between each vector and the cluster’s centroid, a vector that represents the averaged properties of each group. The distance between two vectors is computed by the Euclidean distance as follows: D=
∑
(x − y )
Table 5: the Frequency of Clusters in OSNs
Request (%)
(2)
Cluster 1
41.2
Cluster 2
25.8
Cluster 3
18
Cluster 4
8.6
Cluster 5
6.4
Where n is the size of any vector and x and y are the two vectors.
4.5 Interactions over Physical distance
Table 4: Tendency to Interact Across Categories
Category
Entire log (8 days)
Days 1-4
Days 5-8
Search
0.68
+0.03
-0.01
Status
0.17
-0.01
0.00
Photo & Video
0.37
+0.04
+0.03
Profile & Friends
0.69
0.00
+0.02
Communities
0.89
+0.06
+0.03
Other
0.12
0.00
-0.01
The last facet studied in this paper is geographical aspects of social interactions which plays an indispensible role in OSN relation with OSNs. There is distance for generated content to be consumed in e-commerce relations. Suppose that OSNs original infrastructure designed to deliver social content progressively, helps to identify the geographical aspects of social interactions which snarls potential opportunities for sanitation on the fundamental designing aspects of OSN content delivery. [1] The location information available in user profiles is in free text form. For this purpose the location of over 20000 users identified. In total, the identified users located in 4,297 different cities among 8 middle-east countries. From this purpose results show the probability of interaction varies as a function of the physical distance between two users. As physical distance between users is getting longer, their interest probability in their friend’s uploaded data based on longitude and latitude is going to be reduced. It is evident that there is a significant correlation between friendship, and physical proximity in the OSNs and relation to e-commerce interactions. It is also observed a strong correlation between the probability of interaction and the probability of forming friendship links. This is expected as users tend to interact more with their friends in the social graph. This suggests that users in the social network tend to be geographically closer to each other when the interaction occurs mainly due to the presence of social links.
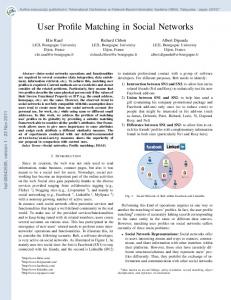
4.3 Transition from one category to another Finally the sequence of user activities at the level of categories examined (Fig. 1). Nodes represent the transition between two categories. Edges with probability smaller than 0.04% were removed to reduce the figure complexity. It is observed that most users initiated their sessions from Profile & Friends, Status Updates, and Photos & Videos as mentioned earlier and leads to communities at final session’s workloads.
4.4 How interaction patterns affect content popularity When users share any data on the web, the content typically is not accessible for every Internet users everywhere. On the other hand, when users upload content on OSNs, they aimed to obtain audience, such as friends, acquaintances, co-workers and etc.[1]. As an example, the audience is explicitly tagged by the user. For instance, video or photo content when uploaded in Facebook is visible on your friend’s timeline but user can limit the presentation only to the close friends or the people who was tagged in picture. This survey analyzes the characteristics of the content popularity as an attempt to quantify the interaction patterns which affect the popularity of e-commerce communication’s embedded in OSNs.
Fig. 1 Transition Probability Among categories
35 Copyright (c) 2014 Advances in Computer Science: an International Journal. All Rights Reserved.
ACSIJ Advances in Computer Science: an International Journal, Vol. 3, Issue 2, No.8 , March 2014 ISSN : 2322-5157 www.ACSIJ.org
[11] P. Chatterjee, D. L. Hoffman, and T. P. Novak, "Modeling the clickstream: Implications for web-based advertising efforts," Marketing Science, vol. 22, pp. 520-541, 2003. [12] A. N. Joinson, "Looking at, looking up or keeping up with people?” motives and use of facebook," in Proceedings of the SIGCHI conference on Human Factors in Computing Systems, 2008, pp. 1027-1036. [13] F. Schneider, A. Feldmann, B. Krishnamurthy, and W. Willinger, "Understanding online social network usage from a network perspective," in Proceedings of the 9th ACM SIGCOMM conference on Internet measurement conference, 2009, pp. 35-48. [14] J. Jiang, C. Wilson, X. Wang, P. Huang, W. Sha, Y. Dai, et al., "Understanding latent interactions in online social networks," in Proceedings of the 10th ACM SIGCOMM conference on Internet measurement, 2010, pp. 369-382. [15] S. Scellato, C. Mascolo, M. Musolesi, and J. Crowcroft, "Track globally, deliver locally: improving content delivery networks by tracking geographic social cascades," in Proceedings of the 20th international conference on World Wide Web, 2011, pp. 457-466. [16] Kluot.com. (2013). How it Works. Available: http://klout.com/corp/how-it-works [17] M. Zaker Shahrak, H. Safarpour, E. S. Eneyo, and B. Abbasi, "Presenting an Integrated Model For Studying The Key Factors Of Customer Trust In Developing ECommerce Environment," International Journal of Research in the Academic Disciplines in Higher Education, vol. 1, pp. 37-52, 2013. [18] D. Pelleg and A. W. Moore, "X-means: Extending Kmeans with Efficient Estimation of the Number of Clusters," in ICML, 2000, pp. 727-734. [19] A. K. Jain, M. N. Murty, and P. J. Flynn, "Data clustering: a review," ACM computing surveys (CSUR), vol. 31, pp. 264-323, 1999.
5. Discussion &Conclusion In this paper, a thorough characterization of online social network workloads and their relation to influence on e-commerce channel presented. A detailed clickstream data of over 50000 users in middle-east countries in an 8-day period summarized, and the data collected from social network aggregator website, which after a single authentication enables users to connect to multiple social networks such as Facebook, Instagram, twitter, and LinkedIn. The statistical and distributional properties of most of the important variables of OSN sessions analyzed. Also, this study is designed to examine the effects of OSNs on interactions in e-commerce and tendency to use this channel in middle-east countries. According to the results of survey, the following guidelines are offered in the direction of positive growth of social network influence on e-commerce interactions: 1. By increasing the number of embedded brand communities in social networks 2. Using all aspects of social networks abilities to be more active and more highlighted communities. 3. Banks and finance institution’s attendance in online social networks such as Facebook, or LinkedIn, as a community could be very lucrative.
References [1] F. Benevenuto, T. Rodrigues, M. Cha, and V. Almeida, "Characterizing user navigation and interactions in online social networks," Information Sciences, vol. 195, pp. 1-24, 2012. [2] G. Gulf. (2012). How people spend their time online. Available: http://www.go-gulf.com/blog/online-time/ [3] F. Buccafurri, V. D. Foti, G. Lax, A. Nocera, and D. Ursino, "Bridge analysis in a Social Internetworking Scenario," Information Sciences, vol. 224, pp. 1-18, 2013. [4] wamda.com. (2012). Available: http://www.wamda.com/application/rapyd/assets/mfm_012 /upload/authors_uploads/6213/mena_2012_final.jpg [5] facebook.com. (2013). Available: https://newsroom.fb.com/Key-Facts [6] google+. (2013). Available: http://googleplus.com/8430/google-crosses-500-million-total-userswith-over-135-million-active-users/ [7] marketinggum.com. (2011). Available: http://www.marketinggum.com/twitter-statistics-2011updated-stats/ [8] Y.-M. Li, C.-Y. Lai, and C.-W. Chen, "Discovering influencers for marketing in the blogosphere," Information Sciences, vol. 181, pp. 5143-5157, 2011. [9] H. Chun, H. Kwak, Y.-H. Eom, Y.-Y. Ahn, S. Moon, and H. Jeong, "Comparison of online social relations in volume vs interaction: a case study of cyworld," in Proceedings of the 8th ACM SIGCOMM conference on Internet measurement, 2008, pp. 57-70. [10] B. Huberman, D. Romero, and F. Wu, "Social networks that matter: Twitter under the microscope," Available at SSRN 1313405, 2008.
Mehrdad Zaker Shahrak is graduated with honors from Master of Science in Information Technology (E-Commerce Major) at Tehran’s K.N.Toosi University of Technology. He received his Bachelor of Science degree from the Shiraz University in Computer Engineering (Hardware Major). He started his graduate program in 2011. He is an honorary researcher in Iran’s ecommerce scientific association. His research areas of interests are E-Trust, Online Social Networks, Supply Chain Management, Information Processing Engineering, Information Technology Strategies, bio-informatics, and Neural Network. Dr. S. Mohammadi is a former senior lecturer at the University of Derby, UK. He also used to be a Network consultant in the UK for more than fifteen years. He is currently a lecturer in the Industrial Eng. Department of the University Of K.N.Toosi, of Iran. His main research interests and lectures are in the fields of Networking, Data Security, Network Security, e-commerce, and e-commerce Se curity. He has published more than eighty papers in various journals and conferences as well as four books. He may be reached at
[email protected] or
[email protected]
36 Copyright (c) 2014 Advances in Computer Science: an International Journal. All Rights Reserved.