HHS Public Access Author manuscript Author Manuscript
J Occup Environ Hyg. Author manuscript; available in PMC 2016 August 29. Published in final edited form as: J Occup Environ Hyg. 2014 ; 11(12): 781–792. doi:10.1080/15459624.2014.919392.
Migration of Beryllium via Multiple Exposure Pathways among Work Processes in Four Different Facilities Jenna L. Armstrong1, Gregory A. Day1, Ji Young Park1,3, Aleksandr B. Stefaniak1, Marcia L. Stanton1, David C. Deubner2, Michael S. Kent2, Christine R. Schuler1, and M. Abbas Virji1 1Division
of Respiratory Disease Studies, National Institute for Occupational Safety and Health, Morgantown, West Virginia
Author Manuscript
2Materion 3Institute
Brush Inc., Elmore, Ohio
of Health and Environment, Seoul National University, Seoul, Korea
Abstract Inhalation of beryllium is associated with the development of sensitization; however, dermal exposure may also be important. The primary aim of this study was to elucidate relationships among exposure pathways in four different manufacturing and finishing facilities. Secondary aims were to identify jobs with increased levels of beryllium in air, on skin, and on surfaces; identify potential discrepancies in exposure pathways, and determine if these are related to jobs with previously identified risk.
Author Manuscript
Beryllium was measured in air, on cotton gloves, and on work surfaces. Summary statistics were calculated and correlations among all three measurement types were examined at the facility and job level. Exposure ranking strategies were used to identify jobs with higher exposures.
Author Manuscript
The highest air, glove, and surface measurements were observed in beryllium metal production and beryllium oxide ceramics manufacturing jobs that involved hot processes and handling powders. Two finishing and distribution facilities that handle solid alloy products had lower exposures than the primary production facilities, and there were differences observed among jobs. For all facilities combined, strong correlations were found between air-surface (rp ≥ 0.77), glovesurface (rp ≥ 0.76), and air-glove measurements (rp ≥ 0.69). In jobs where higher risk of beryllium sensitization or disease has been reported, exposure levels for all three measurement types were higher than in jobs with lower risk, though they were not the highest. Some jobs with low air concentrations had higher levels of beryllium on glove and surface wipe samples, suggesting a need to further evaluate the causes of the discrepant levels.
Address correspondence to: M. Abbas Virji, National Institute for Occupational Safety and Health, 1095 Willowdale Road, MS 2800, Morgantown, West Virginia 26505-2888;
[email protected]. DISCLAIMER The findings and conclusions in this report are those of the authors and do not necessarily represent the views of the National Institute for Occupational Safety and Health. This article is not subject to US copyright law. [Supplementary materials are available for this article. Go to the publisher’s online edition of Journal of Occupational and Environmental Hygiene for the following free supplemental resource: a file describing the forms of beryllium materials encountered during production and characteristics of the aerosols by process areas.]
Armstrong et al.
Page 2
Author Manuscript
Although such correlations provide insight on where beryllium is located throughout the workplace, they cannot identify the direction of the pathways between air, surface, or skin. Ranking strategies helped to identify jobs with the highest combined air, glove, and/or surface exposures. All previously identified high-risk jobs had high air concentrations, dermal mass loading, or both, and none had low dermal and air. We have found that both pathways are relevant.
Keywords beryllium; dermal; exposure; inhalation; pathways; sensitization; surfaces
INTRODUCTION Author Manuscript
A recent epidemiologic study at a beryllium production facility demonstrated airborne exposure-response relationships with both average exposure and an index of relative peak exposure (highest job worked average exposure) and beryllium sensitization (BeS), and cumulative exposure with chronic beryllium disease (CBD).(1) Although levels of airborne exposures have been associated with the development of BeS, the potential contribution of dermal exposures towards the development of BeS is not clearly understood. Exposure characterization at the facility in the aforementioned study demonstrated that a large fraction of beryllium aerosol was in the nonrespirable size range [i.e., > 6.0 micrometers (μm).(2)] Although inhalation exposures are dependent on particle size, dermal exposure to both large and small particles may be relevant, particularly if the skin barrier is breached.
Author Manuscript
In 2003, a study was conducted at a copper-beryllium alloy finishing facility to evaluate potential exposure pathways.(3) The findings suggested that measurable levels of beryllium particles can deposit on work surfaces, clothing, and/or directly onto skin leading to dermal exposure. The study results stressed the need to assess and control not only inhalation exposures to beryllium, but also dermal exposures and surface contamination, to minimize migration of beryllium via other exposure pathways and to clean areas.
Author Manuscript
In an epidemiologic study of BeS at a beryllium ceramics facility, Cummings et al.(4) reported a reduction of BeS in newly hired workers subsequent to implementation of comprehensive protective measures, which suggested that controlling both inhalation and dermal exposures along with minimizing the migration of beryllium from contaminated surfaces likely played a role. This observed reduction in BeS suggested that furthering our understanding of exposure pathways among air, dermal, and surfaces may be important for the prevention of BeS. Furthermore, assessment of the pathways may aid epidemiologic studies in separating the contribution from different routes of exposure to BeS. Schneider et al.(5) developed a conceptual source-receptor model of dermal exposure that describes the transport of contaminants from the source to the surface of the skin through multiple compartments, including source, air, surface, outer clothing, inner clothing, and skin. The processes that describe the transport of mass include: emission, deposition, resuspension or evaporation, transfer, removal, re-distribution, decontamination, and penetration or permeation. The model assumes that within the industrial process there are a number of sources that can generate airborne particles. Some of these particles may deposit J Occup Environ Hyg. Author manuscript; available in PMC 2016 August 29.
Armstrong et al.
Page 3
Author Manuscript
onto surfaces, skin, or be directly inhaled. Particles may also be resuspended from surfaces back into the air. Although inhalation due to resuspension is thought to be minimal,(6) settled particles may potentially be transferred onto skin or to other surfaces. Thus, the model describes multiple exposure pathways and interactions among those pathways. Few studies have examined multiple routes of exposure and their relationships in the industrial setting. Hughson et al.(7) and Du Plessis et al.(8) measured levels of nickel in workplace air, on surfaces, and on workers’ skin in the primary nickel production and user industries. Nickel was identified on multiple areas of workers’ bodies, including hands, forearms, necks, faces, and chests. This finding suggested potential deposition from the air and/or transfer from contaminated hands or gloves.
Author Manuscript
In an investigation of pathways of exposure in the rubber manufacturing industry, Vermeulen et al.(9) systematically applied the conceptual source-receptor model(5) to demonstrate the transfer and redistribution of cyclohexane soluble matter (CSM) among multiple compartments. The authors evaluated these data in a subsequent study that applied mixed models to evaluate influence of workplace controls and employee tenure on exposure levels.(10) They found that controls such as source elimination, local exhaust ventilation, and process automation led to significant decreases in dermal and inhalable levels of CSM over time. Evaluating the different pathways of exposure helped to develop strategies to manage occupational exposures at the industry level.
Author Manuscript
All these studies looked at the importance of different exposure pathways (e.g., glove-air, glove-surface, and surface-air) and how each may vary considerably among production functions. In addition, the identification of such pathways proved useful for implementing control measures designed to minimize both inhalation and dermal exposures. The studies by Vermeulen et al.(9,10) led to the formation of exposure groups for a subsequent epidemiologic study that incorporated simultaneous air and dermal exposure metrics to examine associations with a urinary biomarker.(11) In this epidemiologic application, both air and dermal metrics were predictive of genotoxic compounds in urine, and the dermal exposure route was found to have a stronger contribution than the inhalation route. The primary purpose of this study was to measure beryllium in air, on cotton gloves, and on surfaces to better understand the migration of beryllium via exposure pathways among jobs and work processes in four different facilities. Our secondary aims were to identify specific jobs with increased levels of beryllium in air, on skin, and on surfaces; identify potential discrepancies in exposure pathways, and determine if these are related to jobs with previously identified increased risk of sensitization or chronic beryllium disease.
Author Manuscript
METHODS Facility descriptions The four facilities evaluated in this study comprise the full range of production activities associated with the manufacture and finishing of beryllium materials (see Figure 1 for a summary of production, production support, and non-production jobs). The physical and chemical characteristics of beryllium exposure and materials used or encountered during the
J Occup Environ Hyg. Author manuscript; available in PMC 2016 August 29.
Armstrong et al.
Page 4
Author Manuscript
manufacture and finishing of beryllium products are summarized in Supplemental Table 1, which was adapted from Virji et al.(2) The production activities at these facilities included:
Author Manuscript
1.
primary production of beryllium metal powder, beryllium oxide (BeO) powder, and beryllium alloy products (e.g., rod, wire, and strip) (Facility A),
2.
manufacturing of ceramic products from BeO powder (Facility B),
3.
semi-finishing of beryllium alloy rod, wire, and strip products (Facility C), and
4.
final finishing and distribution of beryllium alloy strip products (Facility D).
Facility A was the largest of the four facilities and used many beryllium-containing process materials including beryllium salts, hydroxide, oxide, metal, and alloys. All of these materials can be characterized by a range of physical and chemical properties including particle size, surface area, and solubility.(12,13) At the time data were collected for this study there were approximately 600 employees, 170 of whom participated in exposure monitoring.
Author Manuscript
Facility B was a smaller facility which obtained feedstock BeO powder from Facility A. After introducing additives and binders, the BeO powder was converted to various ceramic products by forming, firing, and finishing operations. All BeO powder in the facility was crystalline, with observed differences in the surface areas among feedstock and processed materials.(14) At the time data were collected for this study there were 62 employees at the facility, 15 of whom participated in exposure monitoring. Facility C was intermediate in size between Facilities A and B, and performed semifinishing (e.g., pickling, annealing, rolling, and slitting) of beryllium alloy rod, wire, and strip products primarily obtained from Facility A. The alloy material was mostly copperberyllium, with some nickel-beryllium. Of 149 employees, 40 participated in exposure monitoring. Facility D was the smallest of the four facilities, and the work involved slitting, leveling, and shipping of copper-beryllium strip products. Of the 35 employees, 22 participated in exposure monitoring. Sampling and Analysis
Author Manuscript
Beryllium sampling included measurement of beryllium in air, on cotton gloves (as a relative index of dermal exposure), and on surfaces in specific production and non-production areas in each facility. The industrial hygiene surveys took place at all four facilities from January to July 2007. The number of samples (n), average sampling duration, analytical method, and percentage of samples below the analytical limit of detection (LOD) varied by facility (Table I). The jobs sampled in the four facilities are listed in Figure 1 and in Table II.
J Occup Environ Hyg. Author manuscript; available in PMC 2016 August 29.
Armstrong et al.
Page 5
Author Manuscript
Personal Air—All personal air samples were collected from workers’ breathing zones with two-piece 37-mm closed-face cassette samplers loaded with 0.8-μm pore size mixed cellulose ester (MCE) filters. Pumps were calibrated to 2.5 liters per min (L/min) prior to sampling and flow rates were verified daily and at the end of the sampling period. To estimate required personal sampling time periods, we used historical air monitoring data to define expected levels of airborne beryllium. For example, in facilities with historically higher airborne concentrations (e.g., Facilities A and B), single-shift air samples were collected for durations of 6 to 10 hr. In facilities with historically lower airborne concentrations (e.g., Facilities C and D)(3,15) “composite” samples, whereby participants wore the same filter cassette sampler over the course of multiple days were collected. This approach was designed to increase the mass collected on filters thereby increasing the likelihood of exceeding the LOD for beryllium. Depending on facility, between one and four measurements were collected per worker.
Author Manuscript Author Manuscript
Cotton gloves—All workers who provided air samples also provided cotton glove samples during the same sampling period. Regardless of whether a given employee provided a single-shift or a composite air sample, new glove samples were collected each day. Current work practices in each facility required the use of nitrile gloves to protect skin from beryllium exposure when working in production areas. Occlusive glove use became a requirement soon after introduction of a comprehensive exposure mitigation program in 2000–2001. As such, at the time of our studies, an alternative approach was needed for estimating historical skin exposures. Cotton gloves were chosen as the sampling substrate to estimate potential dermal exposures among workers who had in the past routinely contacted beryllium-contaminated work surfaces or beryllium material without the use of gloves. These gloves could be worn over nitrile gloves while still permitting dexterity to perform job tasks yet they easily fit into outer gloves (e.g., leather, rubber, or Kevlar) that were occasionally worn to protect workers against physical and chemical hazards. The duration of wear for each sampling period was approximately two hr and a different portion of the shift was selected for each day of sample collection (i.e., beginning, middle, and end). Analytical results were reported by the laboratory as total mass (μg) of beryllium per glove, which were then added together. The total beryllium mass was divided by the duration of the sampling period to estimate beryllium loading in μg/hr. One to four measurements were collected per worker to capture information on within- and betweenworker variability. More specific details about the glove sampling method have been reported in Day et al.(3)
Author Manuscript
Surface wipes—Surface wipe samples were generally collected from work surfaces in the same areas in which participating employees performed their regular work activities during the same period as air and glove samples were collected. Although there is strong adherence to wearing dermal personal protective equipment, sampling surfaces for beryllium contamination is still relevant for gaining insight into the potential for beryllium migration throughout areas of the plant. After observation, surfaces were selected based on the likelihood of daily worker contact and included containers, control panels, desktops, furniture, stationary and mobile equipment, tools, office equipment, and telecommunications
J Occup Environ Hyg. Author manuscript; available in PMC 2016 August 29.
Armstrong et al.
Page 6
Author Manuscript
devices. When possible, the workers were consulted to learn more about the surfaces that were frequently contacted during their work shift. To maintain product integrity and quality, surface wipes of the beryllium products were not collected. As in the previous study, samples were collected in a manner consistent with National Institute for Occupational Safety and Health (NIOSH) Method 9102(3) for an area equal to 100 cm2. An equivalent area was approximated when sampling from irregular surfaces. Results were expressed as mass beryllium per area wiped (μg/100 cm2). Statistical Analysis
Author Manuscript
All statistical analyses were performed using SAS version 9.3 (SAS Institute, Cary, N.C.). Distributions of beryllium air concentrations, glove mass loadings, and surface concentrations were lognormal, thus geometric means (GMs) and standard deviations (GSDs) were calculated for jobs in each facility. For repeated air and glove measurements, summary statistics (GM and GSD) were estimated with the NLMIXED(16) procedure in SAS, which uses the maximum-likelihood estimation (MLE) method for the analysis of leftcensored exposure data.(17) Summary statistics were estimated separately for each job from models with the log-transformed beryllium concentration as the dependent variable, worker ID as a random effect, and no fixed effects. For surface measurements, summary statistics were calculated for jobs using the MEANS procedure in SAS. Only four surface measurements were below the LOD (0.6%), and these were substituted with a value of LOD/2. Analysis of means was conducted with PROC ANOM to examine differences in exposures across facilities and jobs. In addition, we identified jobs that were previously associated with a higher risk of BeS and/or CBD.(1,15,18–21)
Author Manuscript
Pearson correlations were calculated between logtransformed air, glove, and surface wipe measurements for each facility. The means of the surface wipes in each job were linked with the individual workers’ air concentrations or glove mass loadings because surface wipes were associated with a job and were not unique to individual workers or sampling dates. Correlation values and scatter plots of the air, glove, and surface wipe measurements were prepared in SigmaPlot 11 (Systat Software Inc., San Jose, Calif.). Lastly, the PROC RANK procedure in SAS was used to compute the ranks of GMs of air concentrations, dermal mass loadings, and surface concentrations for each job within a facility. We computed Total Rank (RTOT) by summing the ranks for air, glove, and surface: (1)
Author Manuscript
If exposure data were missing for a certain pathway, the average of the other two ranked pathways was used. Since this is a ranking, the smallest RTOT values correspond to higher combined exposure jobs. For correlated pathways, RTOT may be a useful metric within a facility to assist in prioritizing jobs for exposure management and control because it allows all three exposure pathways to be considered simultaneously.
J Occup Environ Hyg. Author manuscript; available in PMC 2016 August 29.
Armstrong et al.
Page 7
Author Manuscript
RESULTS Table II presents the results from personal air, glove, and surface wipe by each job within a facility. The jobs have been ranked within each facility using RTOT values. Beryllium was detected in the majority of samples collected from all four facilities. Overall, less than 3% of all personal air samples were below the LOD, with fewer than 2% from Facilities A and B (n = 5 and 1, respectively), and higher proportions from Facilities C and D (n = 3, 7% and n = 2, 8%, respectively). All cotton glove and surface wipe samples from Facilities A, B, and C were above the LOD, except for one surface wipe sample from Facility C. At Facility D, 2% of cotton glove and 5% of surface wipe samples were below the LOD (see Table I). Personal Air Samples
Author Manuscript
Overall air concentrations at Facility A were higher and more varied among jobs (GSDs ranged from 1 to 13) than at other facilities (Table II). The highest GM air concentrations at facility A were observed in beryllium metal production jobs like Vacuum Hot Press (GM 3.60 μg/m3), Powdering (GM 3.96 μg/m3), and Be Sheet Operator (GM 1.01 μg/m3) which were all significantly higher than the mean level for the facility based on ANOM results. These jobs involve hot processes and generation and handling of powder materials. Interestingly, jobs like Powdering and Oxide had the highest GSDs (6 and 13, respectively), and these jobs also involved generation and handling of powder materials. Administration (Office) and Supervisors and Engineers (Alloy) (GM ≤ 0.01 μg/m3) were significantly lower than the facility mean.
Author Manuscript
The air concentrations at Facility B were less varied (GSDs ranged from 1.0 to 2.5). At Facility B, the highest air concentrations were in oxide production jobs like Material Preparation (GM 0.86 μg/m3), Pressing (GM 0.40 μg/m3), and Machining and Lapping (GM 0.28 μg/m3), which were all significantly greater than the facility level mean. These jobs are characterized by powder handling and high input mechanical energy. Shipping/Receiving and Supervisors and Engineers (GM ≤ 0.01 μg/m3) jobs were significantly lower than the facility mean. At Facilities C and D, GM air concentrations in production jobs like Slitting and Strip Operator were much lower as compared to facilities A and B (all air concentrations were ≤0.44 μg/m3), but still varied within jobs (GSDs ranged from 1.1 to 4.4). Both of these facilities are finishing and distribution centers that handle primarily solid beryllium alloy pieces. The highest mean air concentrations at these facilities was observed in a Wire Annealing/Pickling job at Facility C (GM 0.18 μg/m3).
Author Manuscript
Glove and Surface Wipe Samples Overall glove and surface wipes at Facility A were higher and more varied among jobs (GSDs ranged from 1 to 13) than at other facilities (Table II). The highest GM cotton glove measurements at Facility A were observed in beryllium metal production jobs like Powdering (GM 1000 μg/hr) and Machining (High Be) (GM 1136 μg/hr) and the beryllium alloy production job Rod and Wire (Bulk Products) (GM 64 μg/hr) which were all significantly higher than the facility mean based on ANOM results. The highest surface wipe
J Occup Environ Hyg. Author manuscript; available in PMC 2016 August 29.
Armstrong et al.
Page 8
Author Manuscript Author Manuscript
measurements were observed in beryllium metal production jobs like Vacuum Hot Press (GM 4289 μg/100 cm2), followed by Chipping Lathe (GM 303 μg/100 cm2), Machining (High Be) (GM 73 μg/100 cm2), and Powdering (GM 62 μg/100 cm2). High surface wipes measurements were also observed in beryllium oxide (GM 120 μg/100 cm2), Billet Preparation (GM 30 μg/100 cm2), and Rod and Wire (Bulk Products) (GM 16 μg/100 cm2). Most of these jobs involve generation and handling of powder materials, and/or handling of solid beryllium pieces. The lowest glove and surface wipe levels were observed in jobs like Shipping/Receiving, R and D/QA and QC, Janitor, Laundry, Waste Water, Supervisors and Engineers, Administration, and Environmental Laboratory jobs (all GM ≤ 17 μg/hr and 0.09 μg/100 cm2, respectively). At this facility, it was interesting that surface wipes samples were significantly lower in laundry, janitorial, and wastewater treatment jobs even though the air and glove results were not significantly lower. This demonstrated that although work surfaces in these job areas were clean, the nature of the work may still involve going out into production areas or handling contaminated items. At Facility B, the highest glove and surface wipes were observed in beryllium oxide production jobs like Material Preparation (GM 9161 μg/hr and 84 μg /100 cm2, respectively) and Pressing (GM 6667 μg/hr and 128 μg /100 cm2, respectively). Similar to the air concentrations, these jobs are associated with powder handling. Interestingly, the Maintenance job at this facility had one of the highest GSDs (17), and this may be due to the nature of the work, which requires many tasks carried out during the shifts monitored. The lowest glove and surface wipe levels were observed in Metallizing (GM 4.0 μg/hr and 0.6 μg /100 cm2, respectively) and in Shipping/Receiving and Supervisors and Engineers (≤ 9.0 μg/hr and ≤ 0.7 μg/100 cm2, respectively).
Author Manuscript
At Facilities C and D, GSDs varied even though dermal and surface loadings were significantly lower than the primary production facilities (2 to 12 and 2 to 6 for glove and surface wipe samples, respectively). The highest measurements obtained from cotton gloves and surface wipes were in Slitting at both facilities, which were greater than each respective facility means. At Facility C, Rod and Wire also had glove measurements (GM 64 μg/hr) significantly greater than the facility mean. These jobs are associated with significant contact with the solid beryllium product. Administration (Office) and Supervisors and Engineers (Alloy) had glove and surface wipe measurements that were significantly lower (≤ 0.5 μg/hr and ≤ 0.1 μg/100 cm2, respectively). Exposure Pathways, Correlation, and Ranking Results
Author Manuscript
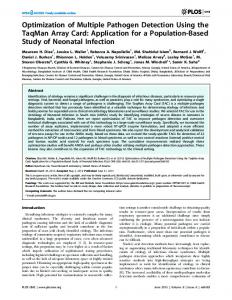
At these facilities, all three pathways—air, dermal, and surfaces—were strongly correlated, with the surface-air correlation being the strongest. At the facility level, all correlations were statistically significant (see Figures 2A–2C). The correlations among all sample types by each facility were strongest in Facility B (the oxide ceramics facility), followed by D (strip products distribution facility), A (primary production facility), and lastly C (rod, wire, and strip finishing facility)—where correlations were lowest overall (e.g., rp = 0.49 for gloveair). When we examined correlations by some specific jobs with sample sizes greater than 10, the strongest overall correlations for all pathways were observed in production jobs such as machining (High Be), oxide, and scrap reclamation.
J Occup Environ Hyg. Author manuscript; available in PMC 2016 August 29.
Armstrong et al.
Page 9
Author Manuscript
In Table II, the last column, (RTOT) ranks the combined GMs of air, glove, and surface exposures by specific jobs within each facility. Jobs with previously identified higher process-related risk for BeS and/or CBD are identified with a footnote.(1,15,18–21) At Facilities A and B, the jobs in beryllium metal and oxide processes had highest exposures and consequently the lowest RTOT values. However, it is clear that the highest exposed jobs did not always correspond with the higher process-related risk groups. Although jobs at Facilities C and D had lower exposures overall, the Wire Anneal/Pickle and Rod and Wire jobs at Facility C were previously identified as having higher risk for BeS and CBD.(21) In previous studies, very little risk has been identified in strip operations at Facility A, Facility C (the majority of this facility is production area) and at Facility D(1,15,21) or in processes involving professional support and administration.
Author Manuscript
DISCUSSION There were positive correlations between levels of beryllium in air, on gloves, and on surfaces. Although higher correlations were generally observed in jobs with higher measured exposures (see Table II), we observed that correlations rp > 0.60 were still observed in administration and facilities jobs. These correlations do not indicate directionality of the relationship between exposure pathways. However, such relationships imply that controls and improvements in one exposure pathway may help to improve another pathway.
Author Manuscript
A previous study was conducted at Facility A to assess airborne exposures using sizeselective personal impactor and total dust closed-face cassette samplers, using samples which were collected in the late 1990s.(2) The airborne concentrations measured in the present study are generally lower than the past measurements at the same facility, particularly in beryllium oxide production and reclamation areas. The reduction in exposures observed in the approximately eight years between the two studies may be the result of a comprehensive preventive program, begun in 2000–2001, to reduce the prevalence of BeS and CBD. The program included engineering and administrative controls which emphasized skin and respiratory protection, workplace cleanliness, and beryllium migration control.(22–24) However, the results reported in this article do not take into account differences in production volume or changes in the number of employees over time.
Author Manuscript
In 2003, a similar study of exposure pathways was conducted at Facility C that also reported strong correlations, rp = 0.79, 0.86, and 0.63 between surface-air, glove-surface, and gloveair, respectively.(3) In comparison, the correlations in the present study at Facility C were not as high (rp = 0.68, 0.69, and 0.49), but they followed a similar pattern. The reported air concentrations in this study are higher than in the 2003 study; the latter utilized general area samplers (for 24 hr) rather than personal air samples. We would expect personal samplers to be more variable than general area air samples. Stronger correlations might be expected between area air and surface wipe samples because both are stationary. There are some limitations to the use of cotton outer gloves as a sampling method, which was first presented as a surrogate skin technique used to estimate exposures to pesticides in the agricultural industry.(25) These include the dissimilar chemical retention characteristics
J Occup Environ Hyg. Author manuscript; available in PMC 2016 August 29.
Armstrong et al.
Page 10
Author Manuscript
of cotton versus skin,(26) the large volumes of solvent needed for extraction, and the possibility of multiple garment changes during a single work shift.(3,25) Although our rationale for using the cotton gloves instead of nitrile gloves was to learn more about past potential dermal exposures at these facilities, future studies could collect dermal samples from skin or clothing underneath the PPE such as gloves or coverall to examine skin exposure.(27,28) The surfaces that we sampled were chosen for their high potential for worker contact. We did not collect surface wipes from surfaces that were less frequently contacted, although future studies could do so to obtain information about surface levels attributable to settled dust. Exposure Ranking
Author Manuscript
The comparison of ranks using RTOT may help to identify the specific jobs with increased air, dermal, and surface exposures to guide health and safety management at the facility level. This is an improvement when compared to traditional methods, which explore only the air pathway. Jobs in which the air concentrations are low but glove and surface levels are high can be identified for further investigation of sources of exposure. For example, at Facility A, jobs like machining (High Be) (RTOT = 17) and oxide (RTOT = 22) had much higher glove surface levels than air levels. This was also the case at Facility C in jobs like slitting (RTOT = 8) and rod and wire (RTOT = 12), which had statistically significant higher levels for glove exposures and surface levels, but not for air levels. Without the incorporation of these other pathways, these jobs could have been considered less of a priority for exposure mitigation; however, it may be important to reinforce skin protection and surface cleaning. Implications for Epidemiology
Author Manuscript
Previous studies have reported higher prevalence of BeS and/or CBD in processes involving production of beryllium metal, oxide, and copper-beryllium master alloy (primary operations) at Facility A and beryllium oxide ceramics at Facility B.(1,18–20) Epidemiologic studies have historically reported inconsistent exposure-response relationships, although identification of process-related risks implied that underlying exposure-response relationships existed. The impetus behind our attempts to elucidate the relationships among the various pathways of exposure was to better understand the role of dermal exposure in risk of BeS. BeS is associated with inhalation or dermal exposure to soluble beryllium materials(29–31) and perhaps dermal contact with relatively insoluble forms of beryllium.(32,33)
Author Manuscript
Jobs with discrepant exposures (shown in Table II) might allow for increased understanding of risk for BeS by identifying those jobs with higher surface or glove exposures, despite low air exposures. In Table III, we grouped jobs by categories of high air/high dermal, high air/low dermal, low air/high dermal, and low air/low dermal to examine the distribution of higher-risk processes among these categories. All jobs with a previously identified higher process-related risk for BeS and/or CBD fell into high air/high dermal, high air/low dermal, and/or low air/high dermal categories. No higher risk process fell into the low air/dermal exposure group. For example, the Rod and Wire job at Facility C was noted as higher process-related risk, yet in this study we identified low air concentrations (range 0.01–0.04
J Occup Environ Hyg. Author manuscript; available in PMC 2016 August 29.
Armstrong et al.
Page 11
Author Manuscript
μg/m3) relative to higher dermal levels (range 13.3–1,328 μg/hr). This implies that both pathways are relevant, and that dermal exposures should be considered in addition to inhalation exposures. Interestingly, another job at Facility C, Wire Anneal/Pickle, was determined to be higherrisk,(21) but the similar job at Facility A was not(1) However, the measured exposure levels for Wire Anneal/Pickle at the different facilities were not dissimilar (GM air concentrations at Facility A was 0.20 μg/m3; Facility C was 0.18 μg/m3). Jobs with high variability (e.g., GSDs) may also be related to risk, as sensitization could be related to peak exposure.(34))
Author Manuscript
Given our understanding that BeS may result from dermal exposure, our findings show that a dermal metric may add value to future epidemiologic analysis when both exposure pathways are relevant. Since we have identified high correlations between pathways, it may be difficult to separate the independent effect of each. However, methods do exist to include correlated variables in epidemiologic models. Several approaches to assessing each metric’s contribution to risk exist, e.g., the categorical combinations of the predictor variable (e.g., low to high dermal/airborne exposure categories combinations(11)) or hierarchical modeling.(35) In Table III we have provided an example of how combinations of exposures can be categorized by job type to reflect the contribution of both air and dermal pathways. Alternatively, a dose metric obtained from models such as the International Commission of Radiologic Protection’s (ICRP) human respiratory and biokinetic models may provide biologically relevant metrics that incorporate particle size distribution, solubility, and exposure from air and dermal pathways.
Author Manuscript
The comparisons made in this study between exposures and health risks are not intended to provide any direct associations. A limitation of comparing the present exposure data to known process-related risks for BeS is that the epidemiologic studies were conducted eight or more years earlier, before implementation of the comprehensive preventive program at these facilities. Surface and cotton glove data are not available from this earlier period; thus we cannot be sure that relationships between pathways have not changed in the interim.
CONCLUSION
Author Manuscript
We have identified strong correlations among personal air, glove, and surface samples at multiple beryllium-using facilities among several different jobs. These correlations imply that one type of measurement (e.g., air sample, surface wipe) can be indicative of other pathways but should not serve as a substitute. For example, the beryllium particles collected on surface wipe samples will not represent the same types of particles that are inhaled. In addition, ANOM tests revealed that all facilities are not the same and exposure pathways cannot be generalized across different jobs. By ranking exposures we have begun to identify jobs with the highest air, glove, and/or surface exposures. Although ranked jobs did not always correspond well to groups with higher risk of beryllium sensitization and/or disease, rankings may help guide health and safety management at the facility level as it accounts for multiple pathways simultaneously. In addition we found that these high-risk jobs fell into high air/high dermal, high air/low dermal, low air/high dermal categories. This implies that
J Occup Environ Hyg. Author manuscript; available in PMC 2016 August 29.
Armstrong et al.
Page 12
Author Manuscript
both pathways are relevant, and that dermal exposures should considered in addition to inhalation exposures.
Author Manuscript
Although these correlations have provided insight on how beryllium moves throughout the workplace, they cannot identify the direction of the movement through pathways. Industrial hygienists should examine the nature of the specific jobs or processes by observing work practices and collecting relevant exposure data to mitigate pathways of exposure. Future studies will be able to utilize the measurements from this study to examine how determinants of exposure such as source type, ventilation, product, surface type, and job activities may affect exposure while accounting for between-and within- worker variability. This information will help to assess directionality of pathways and explain the major differences among jobs. The correlations reported in this study have demonstrated that future models will need to recognize potential interactions among all three measurements rather than treating the air, glove, and surfaces as separate analyses.
Supplementary Material Refer to Web version on PubMed Central for supplementary material.
Acknowledgments The authors would like to acknowledge Nicole Edwards for her support with figures and graphics, and Kay Kreiss and Marc Kolanz for their useful review and discussion of the manuscript. We also thank Richard Fenske at the University of Washington School of Public Health for his input with regard to cotton glove dermal sampling.
References Author Manuscript Author Manuscript
1. Schuler CR, Virji MA, Deubner DC, Stanton ML, et al. Sensitization and chronic beryllium disease at a primary manufacturing facility, part 3: Exposure response among short-term workers. Scand J Work Environ Health. 2012; 38:270–281. [PubMed: 21877099] 2. Virji MA, Stefaniak AB, Day GA, et al. Characteristics of beryllium exposure to small particles at a beryllium production facility. Ann Occup Hyg. 2011; 55:70–85. [PubMed: 20805261] 3. Day GA, Dufresne A, Stefaniak AB, et al. Exposure pathway assessment at a copper-beryllium alloy facility. Ann Occup Hyg. 2007; 51(1):67–80. [PubMed: 16844720] 4. Cummings KJ, Deubner DC, Day GA, et al. Enhanced preventive programme at a beryllium oxide ceramics facility reduces sensitisation among new workers. Occup Environ Med. 2007; 64(2):134– 140. [PubMed: 17043076] 5. Schneider T, Vermeulen R, Brouwer DH, Cherrie JW, Kromhout H, Fogh CL. Conceptual model for assessment of dermal exposure. Occup Environ Med. 1999; 56(11):765–773. [PubMed: 10658563] 6. Shay E, De Gandiaga E, Madl AK. Considerations for the development of health-based surface dust cleanup criteria for beryllium. Crit Rev Toxicol. 2013; 43:220–243. [PubMed: 23445217] 7. Hughson GW, Galea KS, Heim KE. Characterization and assessment of dermal and inhalable nickel exposures in nickel production and primary user industries. Ann Occup Hyg. 2010; 54(1):8–22. [PubMed: 19759172] 8. Du Plessis JL, Eloff FC, Badenhorst CJ, et al. Assessment of dermal exposure and skin condition of workers exposed to nickel at a South African base metal refinery. Ann Occup Hyg. 2010; 54(1):23– 30. [PubMed: 19948533] 9. Vermeulen R, Heideman J, Bos RP, Kromhout H. Identification of dermal exposure pathways in the rubber manufacturing industry. Ann Occup Hyg. 2000; 44(7):533–541. [PubMed: 11042256] 10. Vermeulen R, De Hartog J, Swuste P, Kromhout H. Trends in exposure to inhalable particulate and dermal contamination in the rubber manufacturing industry: Effectiveness of control measures
J Occup Environ Hyg. Author manuscript; available in PMC 2016 August 29.
Armstrong et al.
Page 13
Author Manuscript Author Manuscript Author Manuscript Author Manuscript
implemented over a nine-year period. Ann Occup Hyg. 2000; 44(5):343–354. [PubMed: 10930498] 11. Vermeulen R, Bos RP, Pertijs J, Kromhout H. Exposure related mutagens in orine of rubber workers associated with inhalable particulate and dermal exposure. Occup Environ Med. 2003; 60:97–103. [PubMed: 12554836] 12. Stefaniak AB, Hoover MD, Dickerson RM, et al. Surface area of respirable beryllium metal, oxide, and copper alloy aerosols and implications for assessment of exposure risk of chronic beryllium disease. Am Indus Hyg Assoc J. 2003; 64(3):297–305. 13. Stefaniak AB, Hoover MD, Day GA, et al. Characterization of physicochemical properties of beryllium aerosols associated with prevalence of chronic beryllium disease. J Environ Monit. 2004; 6(6):523–532. [PubMed: 15173904] 14. Stefaniak AB, Virji MA, Day GA. Dissolution of beryllium in artificial lung alveolar macrophage phagolysosomal fluid. Chemosphere. 2011; 83:1181–1187. [PubMed: 21251696] 15. Stanton ML, Henneberger PK, Kent MS, Deubner DC, Kreiss K, Schuler CR. Sensitization and chronic beryllium disease among workers in copper-beryllium distribution centers. J Occup Environ Med. 2006; 48:204–211. [PubMed: 16474270] 16. Jin Y, Hein MJ, Deddens JA, Hines CJ. Analysis of lognormally distributed exposure data with repeated measures and values below the limit of detection using SAS. Ann Occup Hyg. 2011; 55(1):97–112. [PubMed: 21177260] 17. Hewett P, Ganser GH. A comparison of several methods for analyzing censored data. Ann Occup Hyg. 2007; 51(7):611–632. [PubMed: 17940277] 18. Henneberger PK, Cumro DC, Deubner DC, Kent MK, McCawley M, Kreiss K. Beryllium sensitization and disease among long-term and short-term workers in a beryllium ceramics plant. Int Arch Occup Environ Health. 2001; 74:167–176. [PubMed: 11355290] 19. Kreiss K, Mroz MM, Newman LS, Martyny J, Zhen B. Machining risk of beryllium disease and sensitization with median exposures below 2 μg/m3. Am J Indus Med. 1996; 30:16–25. 20. Kreiss K, Mroz MM, Zhen B, Wiedemann H, Barna B. Risks of beryllium disease related to work processes at a metal, alloy, and oxide production plant. Occup Environ Med. 1997; 54:605–612. [PubMed: 9326165] 21. Schuler CR, Kent MS, Deubner DC, et al. Process-related risk of beryllium sensitization and disease in a copper-beryllium alloy facility. Am J Indus Med. 2005; 47:195–205. 22. Deubner D, Kent M. Keeping beryllium workers safe: An enhanced preventive model. J Occup Environ Hyg. 2007; 4:D23–30. [PubMed: 17237019] 23. Fenske RA. Dermal exposure assessment techniques. Ann Occup Hyg. 1993; 37:687–706. [PubMed: 8304685] 24. Bailey RL, Thomas CA, Deubner DC, Kent MS, Kreiss K, Schuler CR. Evaluation of a preventive program to reduce sensitization at a beryllium metal, oxide, and alloy production plant. J Occup Environ Med. 2010; 52:505–512. [PubMed: 20431418] 25. Thomas CA, Bailey RL, Kent MS, Deubner DC, Kreiss K, Schuler CR. Efficacy of a program to prevent beryllium sensitization among new employees at a copper-beryllium alloy processing facility. Pub Health Rep. 2009; 124:112–114. [PubMed: 19618813] 26. Stefaniak, AB.; Day, GA.; Virji, MA.; Geer, LA.; Bello, D. The Occupational Environment: Its Evaluation, Control, and Management. 3rd. Fairfax, Va.: AIHA Press; 2011. The Skin and the Work Environment; p. 537-560. 27. Liu Y, Sparer JS, Woskie R, et al. Qualitative assessment of isocyanate skin exposure in auto body shops: A pilot study. Am J Indus Med. 2000; 37:265–274. 28. Pronk A, Yu F, Vlaanderen J, Tielemans E, et al. Dermal, inhalation, and internal exposure to 1,6HDI and its oligomers in car body repair shop workers and industrial spray painters. Occup Environ Med. 2006; 63:624–631. [PubMed: 16728504] 29. Curtis GH. Cutaneous hypersensitivity due to beryllium: A study of thirteen cases. AMA Arch Derm Syphilol. 1951; 64:470–482. [PubMed: 14867858] 30. Day GA, Stefaniak AB, Weston A, Tinkle SS. Beryllium exposure: Dermal and immunological considerations. Int Arch Occup Environ Health. 2006; 79:161–164. [PubMed: 16231190]
J Occup Environ Hyg. Author manuscript; available in PMC 2016 August 29.
Armstrong et al.
Page 14
Author Manuscript
31. American Conference of Governmental Industrial Hygienists (ACGIH®). Beryllium and Compounds. Cincinnati, Ohio: ACGIH; 2009. p. 1-14. 32. Tinkle SS, Antonini JM, Rich BA, et al. Skin as a route of exposure and sensitization in chronic beryllium disease. Environ Health Perspect. 2003; 111:1202–1208. [PubMed: 12842774] 33. Stefaniak AB, Virji MA, Day GA. Release of beryllium from beryllium-containing materials in artificial skin surface film liquids. Ann Occup Hyg. 2011; 55(1):57–69. [PubMed: 20729394] 34. The National Academy of Sciences (NAS). Managing Health Effects of Beryllium Exposure. Washington, D.C.: The National Academies Press; 2008. 35. Greenland S. Hierarchical regression for epidemiologic analysis of multiple exposures. Environ Health Perspect. 1994; 102:33–39. [PubMed: 7851328]
Author Manuscript Author Manuscript Author Manuscript J Occup Environ Hyg. Author manuscript; available in PMC 2016 August 29.
Armstrong et al.
Page 15
Author Manuscript Author Manuscript FIGURE 1.
Summary of production, production support, and non-production jobs at four different beryllium facilities.
Author Manuscript Author Manuscript J Occup Environ Hyg. Author manuscript; available in PMC 2016 August 29.
Armstrong et al.
Page 16
Author Manuscript Author Manuscript Author Manuscript
FIGURE 2. A–C. Correlation patterns of beryllium in different pathways by facility
Pearson correlation coefficients (rp) reported by facility; all correlation coefficients were statistically significant (α ≤ 0.001).
Author Manuscript J Occup Environ Hyg. Author manuscript; available in PMC 2016 August 29.
Author Manuscript
Author Manuscript
44
59
Cotton glove
Surfaces
101
103
Cotton glove
Surfaces
A
85
62
Cotton glove
Surfaces
—
125 (84–234)
2064 (1516–2302)
—
109 (18–210)
1436 (355–1912)
—
124 (78–180)
534 (348–592)
—
119 (12–186)
661 (200–2208)
Average duration (Range) minutes
Modified NMAM 7300
NMAM 7704
NMAM 7300
Modified NMAM 7300
NMAM 7704
NMAM 7300
NMAM 7704
NMAM 7704
NMAM 7704
0.003
0.02 to 0.06
0.007
0.003
0.02 to 0.06
0.007
0.10
0.10
0.003
0.003
0.02 to 0.06
NMAM 7704B Modified NMAM 7300C
0.007
Method LOD (μg Be)
NMAM 7300A
Analytical method
4.8
2.4
9.1
1.0
0
6.8
0
0
2.3
0
0
1.9
J Occup Environ Hyg. Author manuscript; available in PMC 2016 August 29.
(—) = Duration not applicable; (LOD) = Limit of Detection; μg = micrograms.
C NMAM 7300 (modified): Each wipe was digested using 24 mL of aqua regia (3:1 HCl:HNO3) and 4 mL of 30% H2O2 on a hotplate and allowed to reflux with frequent swirling until a color change took place. The addition of 4 mL of aqua regia, 2 mL of 30% H2O2, and heat was repeated multiple times until each sample was a grainy solution with a final volume of less than 10 mL. Samples were diluted to 25 mL with ASTM Type II water and analyzed using a Perkin Elmer Optima 3000 DV ICP emission spectrometer.
NMAM 7704: MCE filters were extracted using a 1% ammonium bifluoride solution at 90 °C for 40 hr, allowed to cool, and analyzed using a Perkin Elmer Optima 3200 XL ICP spectrometer.
B
NMAM 7300: MCE filters were digested in 10 mL 1:1 (v/v) nitric acid at 116 °C for 40 min, allowed to cool, diluted to 25 mL final volumes with ASTM Type II water, shaken vigorously, and analyzed using a Perkin Elmer Optima 3000 DV inductively coupled plasma (ICP) emission spectrometer.
22
Air
Facility D
44
Air
Facility C
44
Air
Facility B
502
322
Cotton glove
Surfaces
325
n
Air
Facility A
Facility