Computer-Aided Diagnosis of Dementia based on structural ... sification we passed all the features to a C-Support Vector Classifier. (C-SVC) with a ..... Roche Ltd and its affiliated company Genentech, Inc.; GE Healthcare; Inno- genetics, N.V. ...
MIND-BA: Fully automated method for Computer-Aided Diagnosis of Dementia based on structural MRI data. S. Tangaro1 , P. Inglese1 , R. Maglietta2 , A. Tateo1 2
1 Istituto Nazionale di Fisica Nucleare, Sezione di Bari, Italy Istituto di Studi sui Sistemi Intelligenti per l’Automazione, CNR, Bari, Italy for the Alzheimers Disease Neuroimaging Initiative ??
Abstract. Neurodegenerative diseases are frequently associated with structural changes in the brain. Magnetic Resonance Imaging (MRI) scans can show these variations and therefore be used as a supportive feature for a number of neurodegenerative diseases. The hippocampus has been known to be a biomarker for Alzheimers disease and other neurological and psychiatric diseases. However, it requires accurate, robust and reproducible delineation of hippocampal structures. This work utilises a datasets consisting of MR images shared by EADC-ADNI working group . Hippocampus volume is a feature used in this analysis. For the other features we used publicly available brain segmentation package FreeSurfer v.5.1 (FS) (freesurfer.nmr.mgh.harvard.edu) [17] to process the structural brain MRI scans and compute morphological measurements. The FreeSurfer pipeline is fully automatic and provides 184 features per MRI scan in total. Volumes of cortical and sub-cortical structures such as the caudate and average thickness measurements within cortical regions, such as the precuneus. We use the FS features but for hippocampus volume we use the segmentation proposed in [16]. For the diagnosis classification we passed all the features to a C-Support Vector Classifier (C-SVC) with a linear kernel on a 5-fold cross validation. The goal is evaluating the performance of an algorithms for multi-class classification: AD, MCI and controls. Methods that are developed for binary classification can be used for three-way classification by using either a one-vs-one (ovo) or one-vs-all (ova) strategy. In this approach, three classifiers are trained for the three binary problems using the ovo methodology and thereafter their outputs are combined into three predictions.
??
Data used in preparation of this article were obtained from the Alzheimers Disease Neuroimaging Initiative (ADNI) database (adni.loni.usc.edu). As such, the investigators within the ADNI contributed to the design and implementation of ADNI and/or provided data but did not participate in analysis or writing of this report. A complete listing of ADNI investigators can be found at: http ://adni.loni.usc.edu/wp − content/uploads/how to apply/ADN I Acknowledgement List.pdf
1
Introduction
In the last few years the enormous development of neuroimaging has deeply altered the research and clinical prospects in the field of neurodegenerative disorders. This has been particularly relevant for Alzheimerss disease (AD), the most common dementia in the world, affecting currently over 36 millions of people (World Alzheimer Report 2011), a number destined to grow due to the increasing aging population. AD is characterised by the formation and deposition of abnormal proteins in the brain, with subsequent functional disruption, neuronal suffering and cell death (neurodegeneration), the latter ultimately translated into a loss of brain volume (atrophy). The cognitive decline is related to the degree of brain atrophy, which accelerates with the progression of the disease, as detected on MRI at a rate of 2% per year for the whole brain (versus 0.2 − 0.5% in normal aging), and at a rate of 5% per year for the hippocampus, a complex structure located in the medial temporal lobe with a primary role in memory and learning, thus making hippocampal atrophy the most important imaging biomarker of the condition [2]. It is not surprising, then, that the accurate measurement of hippocampal volume, is of crucial importance and has become the focus of an increasingly large body of work. Until recently the segmentation of the hippocampus, ie its identification and separation from surrounding brain structures, had been performed mainly manually or with semi-automated techniques, followed by manual editing. This is obviously time-consuming and subject to investigator variability, so a number of automated segmentation methods have been developed. These have relied so far mainly on image intensity-based methods, often adopting multi-atlas registration approaches, in order to minimize errors due to individual anatomical variation. More recently, though, a number of methods that exploit shape information have been developed, based on preliminary work carried out in the nineties with the Active Shape Models (ASM) [1] and the Active Appearance Models (AAM) [3]). ASM address the issue of identifying objects of a known shape in a digital image when the shape is characterized by a certain degree of variability, as in the case of anatomical structures. AAM combine grey-level information with shape information provided by a training set, but this may fail to capture the intrinsic variability of biological structures, a limit attempted to overcome by the use of the wavelet transform and the principal component analysis (PCA) [4]. Alternative methods have used deformable representations or deformable M-reps [5]. Also, algorithms that associate geometric information (obtained by expert priors or learning procedures in a Bayesian framework) to powerful statistical tools, such as region competition algorithms (Zhu and Yuille, 1996) have been combined with homotopic deformations in automated hippocampal segmentation methods[6]. Recent work has employed probabilistic tree frames for brain segmentation [7], at times adopting specific models such as Markovian random fields or graphical cuts [8]. The use of machine learning techniques enables the processing of high-dimensional feature vectors without time-consuming computations thanks to optimization procedures. Alternative approaches involve, for example, labeling strategies combined
with other methods such as multiple segmentations [9], longitudinal 4-D methods with graph cuts [10] and label fusion with template libraries [11].
2
Materials
This work utilises two datasets named DB − 1 and DB − 2. DB − 1 consists of 98 MR images and their corresponding expert manual labels. The dataset is shared by EADC-ADNI working group using a standard harmonized protocol (www.hippocampal-protocol.net). The most inclusive definition of the Harmonized protocol [12] may limit the inconsistencies due to the use of arbitrary lines and tissue exclusion of the currently available manual segmentation protocols. The second dataset used -DB − 2, is from ADNI screening images and cosists of 160 MR images. The two databases used are described with demographics given in table 1. Data Size Age M/F Subjects DB-1 98 60-90 56/44 29 NC - 32 MCI - 37 AD DB-2 160 28 - 96 76/84 68 NC -63 MCI - 29 AD Table 1. Description of database used. Group size, range age (years) and sex of the two clinical datasets, containing normal control (NC) subjects, Alzheimer’s Disease (AD) and mild cognitive impairment (MCI) patients.
As data for the evaluation framework, CADDementia project composes a multi-center data set consisting of 384 scans. The participating centers are: Erasmus MC (EMC), Rotterdam, the Netherlands; VU University Medical Center (VUmc), Amsterdam, the Netherlands; University of Porto / Hospital de So Joo (UP), Porto, Portugal This data set contains structural MRI (T1w) scans of subjects with the diagnosis of probable Alzheimers disease (AD), mild cognitive impairment (MCI) and participants without a dementia syndrome (controls). In addition to the MR scans, demographic information (age, gender) and information on which data are from the same institute is included. A large set is needed for comparison of the different methods. In addition, a large set increases the scientific value of our framework, as the data better represents a clinical population. Most of the data is used for evaluation of the methods: 354 MRIs for the test set. Additionally, a small training dataset is provided, which consists of 30 scans distributed over the diagnostic groups was added to our training set.
3
Methods
Statistical classification is an active area of pattern recognition and computer vision research in which scalar- or vector-valued observations are automatically
assigned to specific groups, often based on a training set of previously labeled examples. In medical imaging, different types of classification tasks are performed, e.g., classifying image voxels as belonging to a certain anatomical structure, or classifying an individual scanned into one of several diagnostic groups (disease versus normal, semantic dementia versus Alzheimers disease, for example). We use a fully automated method for voxel classification in a brain MRI scan as belonging to the hippocampus versus not. In this method a procedure of training dataset selection based on active learning machine is used during learning of voxel classification according to their Haar-like features, variables that describe complex images based on a statistical analysis of adjacent groups of voxels. The system consists of three processing levels: (a) linear registration of all brains to a standard template and automated method to capture the global shape of the hippocampus. (b) Feature extraction: all voxels included in the previously selected volume were characterized by 315 features computed from local information. (c) Voxel classification: a Random Forests algorithm was used to classify voxels as belonging or not belonging to the hippocampus. The procedure has been detailed in [13, 14, 15, 16]. Hippocampus volume is a feature used in this analysis. For the extraction of the other features we used publicly available brain segmentation package FreeSurfer v.5.1 (FS) (freesurfer.nmr.mgh.harvard.edu) [17], which aim is to process the structural brain MRI scans and compute morphological measurements. The FreeSurfer pipeline is fully automatic and provides 184 features per MRI scan in total. Volumes of cortical and sub-cortical structures such as the caudate and average thickness measurements within cortical regions, such as the precuneus. We use the FS features but for hippocampus volume we use the segmentation proposed in [16]. For the diagnosis classification we passed all the features to a C-Support Vector Classifier (C-SVC) with a linear kernel on a 5-fold cross validation. Specifically, CTRL vs MCI, CTRL vs AD, and MCI vs AD classifications were computed, after that the three probabilities were combined using the formula [20], Q p(Ci |φij ) j6=i P Q (1) P (Ci |x) = p(Ck |φkj ) k j6=k
where φij represents the output of the ovo classifiers. Since C-SVC does return only predicted class labels, we used the Platt scaling [23] to generate posteriors from the output of binary classifiers. The five-per-pair binary classifiers were then used to predict the diagnosis of the blind test set, by averaging the posteriors over all the cross validation rounds. Final classification is obtained with a max-wins-all rule on the three class posteriors. 3.1
Computational infrastructure
The method is developed in ITK and MATLAB framework for hippocampus segmentation and we use FS to brain feature extraction. The computational
resources required is about 13 hour per image. Therefore the availability of distributed computing software environments and adequate infrastructures was of fundamental importance. In this study, the LONI pipeline processing environment [21, 22] was used: a user-friendly and efficient software for complex data analyses, available at http://pipeline.loni.ucla.edu. The present study was carried out using the local computer farm BC2S 3 : a distributed computing infrastructure consisting of about 5000 CPU and allowing up to 1,8 PB storage. A further study for grid deployment was also performed, with the aim of creating a pipeline tool suitable for large clinical trials. It was carried out on the European Grid Infrastructure (EGI) which consists of about 300 geographically distributed sites around the world. In particular all the results presented in this study were obtained on the BC2S using the 484 MR images at our disposal. the run-time reduction with the grid implementation allowed to produce results in a reasonable time with respect to the application execution as a sequential process on limited resources. The advantages of the grid execution are evident since we obtained the 90% of the analysis of 484 images after less than 16 hours.
4
Results and Conclusion
We compute our estimates of the performance metrics (ACC, AUC) for 5-fold cross validation extracting random the test set. Results showed that our method performs very good in discriminating the three classes (CTRL, MCI, and AD), in line with those of literature, with an overall accuracy of 0.8090 on the entire dataset (DAll ), whereas for the 30 subjects downloaded from MICCAI (D30 ), we obtained an accuracy of 0.7333. In table 2 and table 3 we report the confusion matrices for both the datasets.
Pred. CTRL Pred. MCI Pred. AD CTRL
95
9
4
MCI
15
80
10
AD
5
12
58
Table 2. Confusion matrix for the classification of the entire dataset.
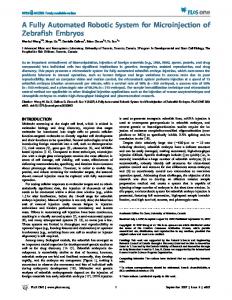
Moreover, in Fig.1, and Fig.2 are reported the ROC curves for the three classes, for both the datasets. Also AUC scores are reported. 3
http://www.recas-pon.ba.infn.it
DALL ROC 1 0.9 0.8 0.7
TPR
0.6 0.5 0.4 0.3 0.2 CTRL AUC: 0.9478 MCI AUC: 0.8770 AD AUC: 0.9083
0.1 0
0
0.2
0.4
0.6
0.8
FPR
Fig. 1. Roc curves on the entire dataset.
1
Pred. CTRL Pred. MCI Pred. AD CTRL
10
1
1
MCI
3
5
1
AD
0
2
7
Table 3. Confusion matrix for the classification of the dataset D30 .
D30 ROC 1 0.9 0.8 0.7
TPR
0.6 0.5 0.4 0.3 0.2 CTRL AUC: 0.8565 MCI AUC: 0.7090 AD AUC: 0.9471
0.1 0
0
0.2
0.4
0.6 FPR
Fig. 2. Roc curves on D30 .
0.8
1
The proposed fully automated approach may be suitable for large-scale research studies, in the first instance on Alzheimers disease, where the hippocampal volume and morphological changes are important biomarkers, potentially also on other brain disorders in which atrophy and structural brain changes plays a relevant pathogenetic role.
Acknowledgments Data used in preparation of this article were obtained from the Alzheimers Disease Neuroimaging Initiative (ADNI) database (adni.loni.usc.edu). As such, the investigators within the ADNI contributed to the design and implementation of ADNI and/or provided data but did not participate in analysis or writing of this report. The Principal Investigator of this initiative is Michael W. Weiner, MD, VA Medical Center and University of California San Francisco. ADNI is the result of efforts of many coinvestigators from a broad range of academic institutions and private corporations, and subjects have been recruited from over 50 sites across the U.S. and Canada. The initial goal of ADNI was to recruit 800 subjects but ADNI has been followed by ADNI-GO and ADNI-2. To date these three protocols have recruited over 1500 adults, ages 55 to 90, to participate in the research, consisting of cognitively normal older individuals, people with early or late MCI, and people with early AD. The follow up duration of each group is specified in the protocols for ADNI-1, ADNI-2 and ADNI-GO. Subjects originally recruited for ADNI-1 and ADNI-GO had the option to be followed in ADNI-2. For up-to-date information, see www.adni-info.org. Data collection and sharing for this project was funded by the Alzheimer’s Disease Neuroimaging Initiative (ADNI) (National Institutes of Health Grant U01 AG024904) and DOD ADNI (Department of Defense award number W81XWH12-2-0012). ADNI is funded by the National Institute on Aging, the National Institute of Biomedical Imaging and Bioengineering, and through generous contributions from the following: Alzheimers Association; Alzheimers Drug Discovery Foundation; BioClinica, Inc.; Biogen Idec Inc.; Bristol-Myers Squibb Company; Eisai Inc.; Elan Pharmaceuticals, Inc.; Eli Lilly and Company; F. Hoffmann-La Roche Ltd and its affiliated company Genentech, Inc.; GE Healthcare; Innogenetics, N.V.; IXICO Ltd.; Janssen Alzheimer Immunotherapy Research & Development, LLC.; Johnson & Johnson Pharmaceutical Research & Development LLC.; Medpace, Inc.; Merck & Co., Inc.; Meso Scale Diagnostics, LLC.; NeuroRx Research; Novartis Pharmaceuticals Corporation; Pfizer Inc.; Piramal Imaging; Servier; Synarc Inc.; and Takeda Pharmaceutical Company. The Canadian Institutes of Health Research is providing funds to support ADNI clinical sites in Canada. Private sector contributions are facilitated by the Foundation for the National Institutes of Health (www.fnih.org). The grantee organization is the Northern California Institute for Research and Education, and the study is coordinated by the Alzheimer’s Disease Cooperative Study at the University of California, San Diego. ADNI data are disseminated by the Laboratory for Neuro Imaging at the University of Southern California.
This research was supported by Istituto Nazionale di Fisica Nucleare (INFN), Italy. This research was also supported by grants from Universit`a degli Studi di Bari, Italy. All authors disclose any actual or potential conflicts of interest, including any financial, personal, or other relationships with other people or organizations that could inappropriately influence their work. All experiments were performed with the informed consent of each participant or caregiver in line with the Code of Ethics of the World Medical Association (Declaration of Helsinki). Local institutional ethics committees approved the study.
References [1] T. F. Cootes, C. J. Taylor, D. H. Cooper, and J. Graham. Active Shape ModelsTheir Training and Application. Computer Vision and Image Understunding Vol. 61, No. 1, January, pp. 38-59 (1995) [2] C. R. Jack, M. M. Shiung, J. L. Gunter, P. C. Obrien, S. D. Weigand, D. S. Knopman, B. F. Boeve, R. J. Ivnik, G. E. Smith, R. H. Cha, et al., Comparison of different mri brain atrophy rate measures with clinical disease progression in ad, Neurology 62 (4) (2004) 591600. [3] T. F. Cootes, G. J. Edwards, C. J. Taylor, Active appearance models, IEEE Transactions on Pattern Analysis and Machine Intelligence 23 (6), 681685, (2001). [4] C. Davatzikos, S. M. Resnick, X. Wu, P. Parmpi, C. M. Clark, Individual patient diagnosis of AD and FTD via high-dimensional pattern classification of MRI, NeuroImage 41 (4) 12201227, (2008). [5] S. M. Pizer, P. T. Fletcher, S. Joshi, A. Thall, J. Z. Chen, Y. Fridman, D. S. Fritsch, A. G. Gash, J. M. Glotzer, M. R. Jiroutek, C. Lu, K. E. Muller, G. Tracton, P. Yushkevich, E. L. Chaney, Deformable M-Reps for 3D Medical Image Segmentation, International Journal of Computer Vision 55 (2) 85106, (2003). [6] M. Chupin, E. Grardin, R. Cuingnet, C. Boutet, L. Lemieux, S. Lehricy, H. Benali, L. Garnero, O. Colliot, The Alzheimers Disease Neuroimaging Initiative, Fully automatic hippocampus segmentation and classification in Alzheimers disease and mild cognitive impairment applied on data from ADNI, Hippocampus 19 (6), 579587 (2009) . [7] Z. Tu, K. L. Narr, P. Dollar, I. Dinov, P. M. Thompson, A. W. Toga, Brain anatomical structure segmentation by Hyhrid discriminative /generative models, IEEE Trans. Med. Imaging 27 (4), 495508, (2008). [8] Y. Zhang, M. Brady, S. Smith, Segmentation of brain MR images through a hidden Markov random field model and the expectationmaximization algorithm, IEEE Trans. Med. Imaging 20 (1), 4557, (2001). [9] R. A. Heckemann, J. V. Hajnal, P. Aljabar, D. Rueckert, A. Hammers, Automatic anatomical brain MRI segmentation combining label propagation and decision fusion, NeuroImage 33 (1) (2006) 115126. [10] R. Wolz, P. Aljabar, J. V. Hajnal, A. Hammers, D. Rueckert, The Alzheimers Disease Neuroimaging Initiative, LEAP: learning embeddings for atlas propagation, NeuroImage 49 (2) (2010) 13161325. [11] D. L. Collins, J. C. Pruessner, Towards accurate, automatic segmentation of the hippocampus and amygdala from MRI by augmenting ANIMAL with a template library and label fusion, NeuroImage 52 (4) (2010) 13551366.
[12] M. Boccardi, M. Bocchetta, L. Apostolova, J. Barnes, G. Bartzokis, G. Corbetta, C. DeCarli, L. DeToledo-Morrell, M. Firbank, R. Ganzola, L. Gerritsen, W. Henneman, R. Killiany, N. Malykhin, P. Pasqualetti, J. Pruessner, A. Redolfi, N. Robitaille, H. Soininen, D. Tolomeo, L. Wang, H. Watson, S. Duchesne, C. Jack, G. B. Frisoni, DelphiDelphi Consensus on Landmarks for the Manual Segmentation of the Hippocampus on MRI: Preliminary Results from the EADC-ADNI Harmonized Protocol Working Group, Neurology 78 Suppl. 1, 171174, (2012). [13] Amoroso, N., et al.: Automated shape analysis landmarks detection for medical image processing. Computational Modelling of Objects Represented in Images III: Fundamentals, Methods and Applications, 139 (2012). [14] Tangaro, S., et al.: Active Learning Machines for Automatic Segmentation of Hippocampus in MRI. ICDM2013 proceedings, (2013). [15] Maglietta, R., et al.: Random Forest Classification for Hippocampal Segmentation in 3D MR Images. In Machine Learning and Applications (ICMLA), 2013 12th International Conference on IEEE 1, 264–267 (2013, December). [16] Tangaro, S., et al.: Automated voxel-by-voxel tissue classification for hippocampal segmentation: Methods and Validation. Physica Medica, in press. [17] Fischl, B.: FreeSurfer. Neuroimage 62, 774-781 (2012). [18] Dale, A.M., Fischl, B., Sereno, M.I.: Cortical surface-based analysis: I. Segmentation and surface reconstruction. Neuroimage 9, 179-194 (1999). [19] Fischl, B., Sereno, M.I., Dale, A.M.,: Cortical surface-based analysis: II: Inflation, flattening, and a surface-based coordinate system. Neuroimage 9, 195-207 (1999). [20] Hamamura, T.; Mizutani, H.; Irie, B., ”A multiclass classification method based on multiple pairwise classifiers,” Document Analysis and Recognition, 2003. Proceedings. Seventh International Conference on , vol., no., pp.809,813, 3-6 Aug. 2003 doi: 10.1109/ICDAR.2003.1227774 [21] I. D. Dinov, K. Lozev, P. Petrosyan, Z. Liu, P. Eggert, J. Pierce, A. Zamanyan, S. Chakrapani, J. D. Van Horn, D. S. Parker, R. Magsipoc, K. Leung, B. Gutman, R. P. Woods, A. W. Toga, Neuroimaging Study Designs, Computational Analyses and Data Provenance Using the LONI Pipeline, PLoS ONE 5 (9). [22] D. E. Rex, J. Q. Ma, A. W. Toga, The LONI Pipeline Processing Environment, NeuroImage 19 (3) (2003) 10331048. [23] John C. Platt, ”Probabilistic Outputs for Support Vector Machines and Comparisons to Regularized Likelihood Methods”, ADVANCES IN LARGE MARGIN CLASSIFIERS, 1999, 61–74, MIT Press