Sep 30, 1989 - This report was submitted by The Aerospace Corporation, El Segundo, CA. 90245, under Contract No. F04701-85-C-OO86-POO019 with the ...
REPORT SD-TR-89-73
Minimization of Intermodulation in GaAvs MESFET Small-Signal Amplifiers
Lg
A. M. CROSMUN and S. A. MAAS
Electronics Research Laboratory ___
C%
Laboratory Operations
The Aerospace Corporation El Segundo, CA 90245
30 September 1989
Prepared for SPACE SYSTEMS DIVISION AIR FORCE SYSTEMS COMMAND Los Angeles Air Force Base P.O. Bnx 92960 Los Angeles, CA 90009-2960
DTIC ELECTE APPROVED FOR PUBLIC RELEASE; DISTRIBUTION UNLIMITED
NOV 2419
150
'
This report was submitted by The Aerospace Corporation, El Segundo, CA 90245, under Contract No. F04701-85-C-OO86-POO019 with the Space Systems Division, P.O. Box 92960, Los Angeles, CA 90009-2960.
It was reviewed and
approved for The Aerospace Corporation by M. J. Daugherty, Director, Electronics Research Laboratory. Lt Boyle was the project officer for the Mission-Oriented Investigation and Experimentation (MOIE) Program. This technical report has been reviewed and is approved for publication.
Publication of this report does not constitute Air Force
approval of the report's findings or conclusions.
It is published only for
the exchange and stimulation of ideas.
RAYMD M. LEONG, MAJ. MOE Program Manager AFSTC/WCO OL-AB
STEVE BOYLE, LT, USAF MOlE Project Officer SSD/CWHB
..m nu .. Ill~nllmu --
nmm mnn
mmumn~
mn
USA
UNCLASSIFIED SECURrTY CLASSIFICATION OF THIS PAGE
REPORT DOCUMENTATION PAGE la. REPORT SECURITY CLASSIFICATION
lb. RESTRICTIVE MARKINGS
Unclassified 2a. SECURITY CLASSIFICATION AUTHORITY
3. DISTRIBUTION/AVAIABILITY OF REPORT
2b. DECLASSIFICATION/DOWNGRADING SCHEDULE
Approved for public release; distribution unlimited.
4. PERFORMING ORGANIZATION REPORT NUMBER(S)
5. MONITORING ORGANIZATION REPORT NUMBER(S)
TR-0089( 4925-02)-4
SD-TR-89-73
6a- NAME OF PERFORMING ORGANIZATION
6b. OFFICE SYMBOL
applicable) (If
The Aerospace Corporation Laboratory Operations
7a. NAME OF MONITORING ORGANIZATION
Space Systems Division
6c. ADDRESS (City State, and ZIP Code)
7b. ADDRESS (City State, and ZIP Code)
Los Angeles Air Force Base
El Segundo, CA 90245-469
Los Angeles, CA 90009-2960
Ba. NAME OF FUNDING/SPONSORING ORGAN1ATION
8b. OFFICE SYMBOL
(If applicable)
8c. ADDRESS (Cit, State, and ZIP Code)
9. PROCUREMENT INSTRUMENT IDENTIFICATION NUMBER
F04701-88-C-0089 10. SOURCE OF FUNDING NUMBERS PROGRAM PROJECT TASK NO. NO. ELEMENT NO.
I WORK UNIT ACCESSION NO.
11. TITLE (Include Security Classification)
Minimization of Intermodulation in GaAs MESFET Small-Signal Amplifiers 12. PERSONAL AUTHOR(S)
Crosmun, Andrea M.; Maas, Stephen A. 13a. TYPE OF REPORT
13b. TIME COVERED FROM
14. DATE OF REPORT (Year, Month, Day) TO
15. PAGE COUN
1989 September 30
30
16. SUPPLEMENTARY NOTATION.
COSATI CODES
17.
FIELD
GROUP
18. SUBJECT TERMS (Continue on reverse if necessary and identity by block number)
SUB-GROUP
FET amplifiers
)>Intermodulation distortion
Volterra series
Nonlinear distortion 19. ABSTRACT (Continue on reverse if necessary and identify by block number)
this report examines the dependence of third-order intermodulation distortion on the source reflection coefficient r
as a function of frequency,
in an amplifier designed according to
available-gain criteria. By means of a numerical formulation of the Volterra series, a complete equivalent circuit of the FET can be used, and intermodulation calculations include all feedback effects. We-show-t-hA the sensitivity of 1P 3 to r decreases with increasing frequency and can be related to the MESFET's stability.
20. DISTRIBUTION/AVAILABILITY OF ABSTRACT 5;
UNCLASSIFIED/UNLIMITED
[3
SAME AS RPT
22a. NAME OF RESPONSIBLE INDIVIDUAL
DD FORM 1473, 84 MAR
21. ABSTRACT SECURITY CLASSIFICATION [:] OTIC USERS
Unclassified 22b. TELEPHONE (Include Area Code)
83 APR edition may be used until exhausted. All other editions are obsolete
22c. OFFICE SYMBOL
SECURITY CLASSIFICATION OF THIS PAGE
UNCLASSIFIED
PREFACE
The authors thank G. Stout and W. Yamada for assisting with the S-parameter measurements, R. Gowin for assisting with the fabrication of the test fixtures, W. Garber for making some of the dc device measurements, and M. Meyer for reviewing the manuscript.
Accesior.?'
GRA&I DTI^ TAB INTIS Unajnnounced
El El
Just ritatlon
By
Distribution/ Ava1lsb11tty CodeS Avail and/or
Dist
Special
CONTENTS
PREFACE..............................................................
1
I.
INTRODUCTION ...................................................
5
11.
MODELING THE MESFET ............................................
7
III.
CALCULATIONS................................................... 15
IV.
RESULTS ....................................................... 21
V.
CONCLUSIONS.................................................... 27
REFERENCES .......................................................... 29
FIGURES
1.
2.
3. 4.
5.
Linear Lumped Equivalent-Circuit Model of the Packaged AT 10650-5 MESFET ...............................................
9
Measured S Parameters of the AT10650-5 MESFET at a 3-V, 20-mA Bias over the 2 to 14-Gliz Range ..........................
10
Nonlinear Equivalent Circuit of the MESFET in the Vicinity of the 3-V, 20-mA Bias PoinL ..........................
11
Gain and Stability Circles and Calculated Third-Order Intercept Points of the MESFET at 2 GHz ........................
16
Gain and Stability Circles and Calculated Third-Order
Intercept Points of the MESFET at 5 GHz ........................
11
Gain and Stability Circles and Calculated Third-Order Intercept Points of the MESFET at 10 GHz .......................
18
Gain and St3bility Circles and Third-Order Intercept Points of tho MESFET at 5 GHz ..................................
23
8.
Sensitivity of IP3 to Z. at 5 GHz ..............................
25
9.
Sensitivity of IP3 to ZL at 5 GHz ..............................
26
6. 7.
S
.. . . ...
.. . ....
. . .... -
. . .
ni4
I.
INTRODUCTION
Microwave GaAs MESFET devices are used as amplifiers in a variety of linear applications.
However, when two or more signals are applied to a
MESFET simultaneously, the nonlinear properties of this device can result in intermodulation (IM) distortion.
This distortion has important effects
on system performance, particularly ii,broadband communication systems. Thus, the minimization of IM distortion in GaAs MESFETs is often a critical requirement. In this report we show how the IM performance of a small-signal amplifier can be optimized when the amplifier is designed according to available-gain criteria.
In this process, the MESFET's output is
conjugate-matched and its input is mismatched to obtain a specified value of gain.
We choose this method because it generally results in better
dynamic range than other options; these options are (1) matching the input and mismatching the output, or (2) simultaneously matching both the input and output (which is, in many cases, impossible).
In available-gain design
the value of source impedance that provides the desired gain is not unique, and can be selected to optimize IM levels. In many cases the IM intercept point I is a valid figure of merit for IM performance.
To obtain the intercept point one must first be able to
predict third-order intermodulation products, which result from the nonlinearities in the circuit.
In the past, several attempts have been made
to model nonlinearities in GaAs FETs by using the harmonic-balance technique 2 -4 or specialized, approximate techniques. 5
The Volterra series
has also been used to model nonlinear distortion in MESFETs; 6 - 9 however, much of this work employs simplifying assumptions that inevitably reduce accuracy.
For example, in the work by Gupta et al. 6 the second-degree
terms in the Volterra-series expansions were set to zero.
However, these
second-order products have an effect on the third-order products and therefore must be taken into account.
Minasian 7 and Lambrianou et al. 8 employ
simplified, unilateral equivalent circuits of the MESFET.
5
These simplifying assumptions are employed to ease the painfully
difficult task of generating Volterra kernels in algebraic form.
In this work, however, we circumvent such limitations by calculating the kernels numerically; thus, no such simplifying assumptions are necessary, and we can use a complete equivalent circuit of the MESFET.
Furthermore, we
include the effects of all of the MESFET's feedback elements; these effects have not been examined previously.
Because Volterra-series analysis
operates entirely in the frequency domain, is noniterative, and requires no convergence process, it is highly efficient and thus is a practical 10 technique for circuit optimization.
.a -- anilnim N lmnl
li
I •i
H
n
an
I
!6
I.
MODELING THE MESFET
This work is based on the packaged Avantek AT10650-5 MESFET, a 0.5 x 250-um device that is similar in structure and performance to many commercial Ku-band MESFETs.
The MESFET chip and its package are modeled by
a lumped-element equivalent circuit, in which some of the elements are nonlinear.
The modeling is performed in two steps:
first, the equivalent
circuit's linear elements are determined, then the characteristics of the nonlinear elements are measured.
The dependence of the nonlinear elements
on voltage are expressed via Taylor-series expansions of their current/ voltage (I/V) or charge/voltage (Q/V) characteristics in the vicinity of their bias points. The FETs used in this work were taken from a common fabrication lot. S-parameter data were measured from 45 MHz to 17 GHz, and several FETs having nearly identical S parameters and I/V characteristics were selected.
The high-frequency data covering the range from 2 to 17 GHz were
measured with the transistor biased at a drain voltage of 3.0 V and a drain current of 20 mA.
The low-frequency S parameters were used primarily to
model the drain-to-source conductance Gds; therefore, these were obtained at several bias points near this operating point. The equivalent-circuit elements were derived from a combination of dc and rf 6-ptdutLei
ua.rLAmenrz.
L.w-freqeney v parameters were used to
obtain initial values for some of the elewents, and the transconductance was derived from dc measurements.
The resistances of the source and drain
ohmic contacts were also derived from dc measurements by means of a method similar to that of Yang and Long 1 1 and modified by Fukai et al.
12
The
small-signal linear circuit was then optimized to fit the measured highfrequency S parameters.
When an adequate fit to the S parameters was
obtained, techniques to model the nonlinear elements were employed.
The
complete model was simply a superposition of the nonlinear elements onto the linear model.
The final circuit topology chosen to model the packaged
7
device is shown in Fig. 1, and the measured S parameters are compared in Fig. 2 to those of the model. Modeling the nonlinear transconductance and drain-to-source resistance These two elements are derived from a single
involves some subtleties.
nonlinear drain-current source, Id(VgVd), that is controlled by two voltages. In the small-signal case, this current source must be represented The small-signal incremental drain
by a two-dimensional Taylor series. current *d(VgpVd) is
id(VgVd) : id(Vg Vd)
a2 Id v2
ad
ad 3-g + 6
Id(VgoVdo)
-
gV
d
-
+2
a~
a2 d
+2 2
vv
d
g d gV ~
g
3
gV
V
3
*
aV vg3V
gv v
dd
2
2 Vd
- aV
3
33 d
1 (1)
where Vg, and Vdo are the bias voltages and Vg and vd are the incremental
gate and drain voltages, respectively, as shown in Fig. 3. In the linear equivalent circuit, the drain current is expressed by the linear terms in Eq. (1); thus
al d id(vg'Vd) d v + a d d d~~~ )=T 9 g +av dvd al
d
-
(2)
or
id(Vg'Vd) = gm (V g o^'v d-
8
)
- g + Gds(Vgo'Vdo)Vg
(3)
0.0064 pF
Ii
3.01
3350
o~
{
0.176 pF
11
017 pF2.94
0,037 pF
0.133 nH{ 0.052 nH
S
Fig. 1. Linear Lumped Equivalent-Circuit Model of the Packaged AT10650-5 MESFET
9
xS22 OS 2113
AS 12
Fig. 2.
Measured S Parameters of the AT10650-5 MESFET at a 3-V, 20-mA Bias over the 2 to 14-GHz Range. The solid line represents measured data; the dotted line shows the S parameters calculated from the model in Fig. 1.
10
G
0.545 nH
3.15 0
0.031 pF +D
0.53 nH 0.423 nH
2.94 Q2
Fig. 3. Nonlinear Equivalent Circuit of the MESFET in the Vicinity of 0.0141, the 3-V, 20-mA Bias Point. id g coefficients are a, a2 =0.0171, a3 = -0.01145; 1d~d coefficients are b, 0.0030, b= 3.09 -10O 4 b 3 = 3.99 x 10 5 ; Vg
=
0.54 v.
and the small-signal drain current can be modeled by means of a pair of separate elements, the controlled source gm and the controlled conductance GdsIn the nonlinear case the controlled source and conductance are traditionally modeled as two separate nonlinear elements, each controlled by a single voltage; thus
id(VgVd)
id,g(Vg) + id,d(Vd)
(4)
a v
(5)
where (v
d,g
g
1ig
+ a3 2
2g
a3
3g9
and i(V) d,d d
bV d + b2v + b3V 3 b1vd 2vd 3d
The an and bn coefficents are the and /3 Vgn and
(6)
n d/aVdn terms in
Eq. (1); from Eqs. (1) through (3), a, = gm and b, = Gds.
Although it is
clear that the cross terms are usually much smaller than the terms involving Vg, they are sometimes not small compared to those involving Vd.
The
terms involving Vd are rarely dominant, but they may still be significant; thus, these cross terms may also be significant. The modeling of id,g is further complicated by its weak nonlinearity, especially near the bias points that would normally be used for highdynamic-range amplifiers.
Because this nonlinearity is so weak, even small
uncertainties in measurement and low levels of quantization noise may obscure tte curvature in id,g*
Even when the noise level is low, the
direct differentiation of id,g to obtain the derivatives in Eq. (1) increases the noise level and makes unreliable the derivatives beyond the second.
Furthermore, least-square fitting to a polynomial, a commonly used
alternative, often fails because the ill-conditioned nature of the normal
12
equation makes the process overly sensitive to small changes in the measured I/V data. Another problem is t-ie well-known frequency dependence of Gds, which is often attributed to traps in the MESFET's channel.
These traps cause
the value of Gds measured above 1 MHz to be one-fifth to one-half the dc value, and they have effects on the higher derivatives al /3V that are d d difficult to characterize. Because of these effects, it is usually not possible to determine the derivatives in Eq. (1) by dc measurements.
The cross terms are even more
difficult to measure than the others, so there is little choice but to neglect them and to model id(vg,vd) as two separate, singly controlled nonlinear elements.
The consequences of this approach are acceptable in
circuits in which id,g(vg) is the dominant nonlinearity; this is the case in virtually all modern MESFETs. These considerations are not unique to Volterra-series analysis.
They
apply to any form of analysis used to calculate small-signal nonlinear effects in FET amplifiers, particularly harmonic-balance analysis.
Because
harmonic-balance analysis is applied primarily to large-signal circuits, the models are usually designed to describe the MESFET over the entire range of drain-to-source and gate-to-source voltages.
However, these
models may not accurately express the derivatives in Eq. (1) in the vicinity of a specific bias point, and their use may result in incorrect results when applied to small-signal distortion problems. The an terms in Eq. (5), which represent a nonlinear controlled current source, were determined by the method described in Ref. 13.
This
method involves extracting the source's Taylor-series coefficients from harmonic measurements at low frequencies. sent a nonlinear conductance.
The bn terms in Eq. (6) repre-
These were found by numerically differentia-
ting values of Gds obtained from low-frequency Y parameters over a range of values of vd; because the curvature of Gds(Vd) was much greater than the uncertainties in the data, and only two derivatives need be taken, a
13
multipoint derivative formula gave good results.
Because it is based
partly on dc measurements, this process only partially compensates for the frequency sensitivity of Gds' The value of gate capacitance Cgs varies with Vg, the voltage across the capacitor's terminals.
Cgs behaves as a uniformly doped Schottky-
barrier diode capacitance having the controlling voltage vg, and was modeled as such.
The nonlinear MESFET model was established by including
the nonlinearity of Cgs, Gds, and gm in the linear equivalent circuit of Fig. 1. The nonlinear equivalent circuit is shown in Fig. 3.
14
III.
CALCULATIONS
The available gain of a two-port is a function solely of the source reflection coefficient rs; the locus of rs values that provide a specific value of gain lie on a circle in the r plane. The available-gain and stability circles of the GaAs FET were plotted on a Smith chart for three cases:
2, 5, and 10 Gz.
Intermodulation (IM) products were calculated at
points chosen periodically along the gain circles to find values that would maximize the amplifier's third-order intercept point, IP3 .
The stability
circles and the corresponding intercept points are snown in Figs. 4, 5, and
6. In order to calculate the 1P 3 values, it was necessary to modify the FET model to account for differences between the coaxial transistor test fixture (TTF) and microstrip amplifier environments.
The TTF measurements
included the inductance of a short section of gate and drain leads, and these excess lengths do not exist in the amplifier.
The model was there-
fore modified by the removal of these added inductances, and the data shown in Figs. 4 through 6 do not include them. The process of calculating the intercept points is implemented numerically, and thus is straightforward.
In practice, it is necessary only to
create a data file that describes the circuit elements and their nodal interconnections, along with ancillary information such as frequencies and the mixing product of interest (the appearance of the data file is similar to that of nodal-entry linear circuit-analysis programs.)
The element
catalog includes both lumped and distributed elements, including a microstrip model that accounts for loss and dispersion.
It is necessary, in the
case of nonlinear elements, to include the Taylor-series coefficients, although the program can generate them for elements having well-established nonlinear characteristics (e.g. diode-junction conductance and capacitance). file.
Arbitrary source- or load-impedance data are entered via a disk The program requires only a few seconds per data point when run on
an 8-MHz IBM PC-AT desktop computer.
15
17.2
G,
Fig.
1
.
ma10m
dB
12~m dB
i
4
STABILITY CIRCLE
d
Gain and Stability Circles and Calculated Third-Order Intercept Points of the MESFET at 2 GHz
16
STABILITY CIRCLE
18.8
2\ .
\\
Fig. 5.
722.
22.3
,dB112.23.4
23. C,261 dB,.s/
Gain and Stability Circles and Calculated Third-Order Intercept Points of the MESFET at 5 GHz
17
23.60
0
12.28 dB ~
Fig.
6.
G 11 ~dB2.8B2.
Gain and Stability Circles and Calculated Third-Order Intercept 3
"~3.
Points of the
at 10 GHz dESFET
18
The program is based on an implementation of the Volterra series called the method of nonlinear currents.1
This method converts the weakly
nonlinear circuit into a linear circuit and a set of current sources whose currents are, at each order, a function of all lower-order node
l.Itages.
The program operates by first determining the linear, or first-order, voltages at each of the circuit's nodes.
It then uses these voltages to
generate excitation-current sources at the second-order mixing frequencies; each nonlinear element is replaced by one such source.
The remainder of
the circuit is linear, and can be solved to obtain second-order voltages by conventional nodal methods.
Similarly, the third-order mixing products are
found from the first- and second-order products.
The method includes the
effect of all lower-order mixing products on each higher-order mixing product.
19
IV.
RESULTS
The intercept points calculated for the 10- and 5-GHz amplifier gain
circles were verified experimentally by measuring the IM levels of several amplifiers designed for these frequencies. Because the IM levels were relatively independent of rs at 10 GHz, only the point r. = 0 was tested, with the load reflection coefficient rL equal to zero and a conjugate match. For the 5-GHz case, however, several configurations were built and tested in an attempt to cover the range of values of r that displayed 5 significant variation in IM level. For the first 10-GHz case an amplifier was built with rs, rL = 0. The measured gain of this amplifier was 4.5 dB, and the intercept point was found to bE 22.4 dBm. respectively.
The calculated values were 5.0 dB and 20.9 dBm, With the output conjugately matched, the gain improved to
6.8 dB and the output intercept point was 23.5 dBm. Calculated values under these conditions were 6.1 dB and 24.1 dBm, respectively. To verify the 5-GHz theoretical results, several points in the r s
plane were tested experimentally.
These tests required an amplifier whose input matching circuit could present a range of r5 values (from the worst to the optimum intercept-point locations) on various gain circles. This input circuit consisted of a quarter-wave transformer and a length of 50-ohm line.
rs was varied by trimming the width. of the microstrip transformer; thus its impedance increased each time it was cut. The output was conjugate matched in each case by means of a tuner, and internept points were measured via a two-tone test.
In this way, the intercept
points for eight r5 values were obtained. The transformer's step-discontinuity reactances are an important component of rs . Unfortunately, attempts to model these reactances via closed-form quasistatic approximations were not successful, because of the limited accuracy of such formulations. To determine these values, we note that the dominant effect of the transformer is to change the magnitude
21
of rs, while the discontinuities primarily affect the phase.
Thus, one can
find IrsI from the transformec impedance, and z rs as the point where the Irs I curve intersects the gain circle.
Thi
the FET's measured S parameters as a standard.
heuristic approach treats This is reasonable, because
the FET's S parameters -- measured by an accurately calibrated automatic
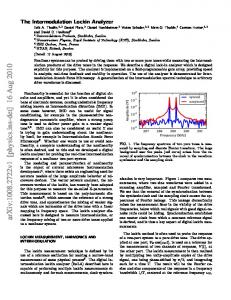
network analyzer -- are known more accurately than the discontinuity reactances. The experimental intercept points and the calculated data are plotted on a Smith chart in Fig. 7; the gain and IP3 values are corrected for the loss in the output tuner (0.7 dB).
The difference between the calculated
and measured IP3 values in most cases is less than 1 dB. At 10 GHz the MESFET is unconditionally stahle.
It is evident from
Fig. 6 that the intercept points in this case do not vary much along the gain circles, or even from one gain circle to another; the distortion levels are already minimal for unconditionally stable conditions. insensitivity of IP3 to r
This
is a characteristic of unilateral circuits. 1
We
believe that the reason for the insensitivity of IP3 to rs is a manifestation of the fact that feedback effects are minimal in an unconditionally stable circuit.
Thus, in terms of its IP3 characteristics, the amplifier
behaves much like a unilateral circuit. At 5 GHz the MESFET is conditionally stable and has optimum values of rs for minimizing third-order intermodulation distortion. Figure 5 shows that the intercept points are highest near the counter-clockwise extreme of the gain circles, and are nearly independent of gain. At the clockwise extreme, the intercepts are lower and are much more zcnsitive to gain; the IP3 values increase as gain decreases.
In general, the intercept
points are lower in regions near the stability circle. The same conclusions can be deduced from the 2-GHz case shown in Fig. 4, except that the effects are more pronounced. The best performance is obtained near the counter-clockwise end of the gain circle, and the worst performance -- a 12-dB reduction in IP3 -- occurs near the clockwise
end.
22
STABILITY CIRCLE
20.8
22.
Fig.
7.
23.
9
dB
Gain and Stability Circles and Third-Order Intercept Points of" the MESFET at 5 GHz. Calculated IP3 values are indicated by filled rircles, measured values by open circles.
23
Figures 8 and 9 show the sensitivity of IP3 to source and load impedance when no gain constraint is imposed.
It is clear from these
figures that the intrinsic sensitivity of IP3 to load impedance is much greater than the sensitivity to source impedance (however, if IP3 were defined in terms of available input power, a definition that sometimes is more relevant, the sensitivity to rS would be greater).
This sensitivity
to load impedance is reflected in the data of the earlier figures:
at 10
GHz, where the FET is unconditionally stable and thus feedback effects are
minimal, mL the value of rL that results in a conjugate match is close to S2, 2 and does not vary much as r is varied. Consequently, the IP3 does not vary significantly with r . However, at 5 GHz the FET is conditionally S stable and rL varies more strongly with rs especially severe at 2 GHz.
the sensitivity of rL to rS is '
It is interesting to note that the worst
values of IP3 are strongly associated with highly reactive values of rL. These results art consistent with an experimental study of IM in MESFETs that identified rL maximized IP3 14
$2 ,2 S
as a good estimate of the load impedance that
Fortunately, the values of r s that optimize the intercept point are generally in the same region of the input plane as those that optimize the noise figure.
Thus, at a given bias level the trade-off between noise and
linearity in a FET amplifier may not be very severe.
However, the bias
conditions that optimize noise figure (Id = 0.15 !dss ) and those that optimize IP3 (1d = 0.5 01 dss
)
present a substantial trade-off.
24
' I
25 -Re
23 22
-150
-100
-50
0 ImJ~
50
Fig. 8. Sensitivity of IP to Z. at 5 GHz.
optimum value of
Lwhen
25
Z
50
+
ZL
1)
100
j86 (this is the
150
24
23-
5
~22-
21
3
20 -100'
-50
50
0
100
'M [ZLI Fig. 9.
Sensitivity of IP3 to ZL at 5 GHz.
26
Zs
50 +JO.
150
V.
CONCLUSIONS
These results show that this approach to optimizing intercept points is practical and accurate.
The measured and predicted intercept points
fall within approximately 1.5 dB of each other, which is little more than the uncertainty in the measurements themselves.
The use of a complete
MESFET model makes the results particularly meaningful, because no significant effects related to the circuit topology (e.g. feedback phenomena) are ignored. Under available-gain constraints, the MESFET's output IP3 is sensitive to rs .
At low frequencies, where the MESFET is conditionally stable, the
MESFET's IP3 is most sensitive to rs . However, as frequency is increased, that sensitivity decreases and essentially disappears at the point where the MESFET becomes unconditionally stable.
This sensitivity is the result
of feedback effects that cause the conjugate-match rL to be highly reactive.
When gain constraints are removed, the sensitivity of output IP3
to rL is greater than its sensitivity to rs . Conventional methods of modeling the drain-current nonlinearity do not include potentially significant effects in the device. needed to develop more accurate modeling techniquetp.
27
Further research is
REFERENCES
1.
S. Maas, Nonlinear Microwave Circuits (Artech House, Norwood, Mass.,
1988). 2.
R. Gilmore, "Nonlinear Circuit Design Using the Modified HarmonicBalance Algorithm," IEEE Trans. Microwave Theory Tech. MTT-34, 1294
(1986). 3.
W. R. Curtice, "Nonlinear Analysis of GaAs MESFET Amplifiers, Mixers, and Distributed Amplifiers Using the Harmonic Balance Technique," IEEE
Trans. Microwave Theory Tech. MTT-35, 441 (1987). 4.
V. Rizzoli, C. Cachetti, and A. Lipparini, "A General-Purpose Program for the Analysis of Nonlinear Microwave Circuits under Periodic Excitation by Multidimensional Fourier Transform," Proc. 17th European
Microwave Conf., 1987, p. 635. 5.
R. S. Tucker, "Third-Order Intermodulation Distortion and Gain Compression in GaAs FETs," IEEE Trans. Microwave Theory Tech. MTT-27, 400 (1979).
6.
R. K. Gupta, L. G. Englefield, and P. A. Goud, "intermodulation Distortion in Microwave MESFET Amplifiers," IEEE MTT-S Int. Microwave Symp. Digest (1978), p. 405.
7.
R. A. Minasian, "Intermodulation Distortion Analysis of MESFET Amplifiers Using the Volterra Series Representation," IEEE Trans. Microwave Theory Tech. MTT-28, 1 (1980).
8.
G. M. Lambrianou and C. S. Aitchison, "Optimization of Third-Order Intermodulation Product and Output Power from an X-Band MESFET Amplifier using Volterra Series Analysis," IEEE Trans. Microwave Theory Tech. MTT-33, 1395 (1985).
9.
A. M. Crosmun, "Use of Volterra Series Analysis for Optimizing the Intercept Point of GaAs MESFET Small-Signal Amplifiers," M. S. Thesis, University of California, Los Angeles, 1988.
10.
S. A. Maas, "A General-Purpose Computer Program for the VolterraSeries Analysis of Nonlinear Microwave Circuits," IEEE MTT-S Int. Microwave Symp. Digest (1988), p. 311.
11.
L. Yang and S. I. Long, "New Method to Measure the Source and Drain Resistance of the GaAs MESFET," IEEE Trans. Electron Devices EDL-7, 75 (1986).
29
REFERENCES (Continued)
12.
A. Fukai et al., private communication, The Aerospace Corporation.
13.
S. A. Maas and A. M. Crosmun, "Modeling the Gate I/V Characteristics of a GaAs MESFET for Volterra-Series Analysis," submitted to IEEE Trans. Microwave Theory Tech., 1988.
14.
C. Y. Ho and D. Burgess, "Practical Design of 2-4 GHz Low InterModulation Distortion GaAs FET Amplifiers with Flat Gain Response and Low Noise Figure," Microwave J. 26, 91 (February 1983).
LDC-Maas/1-1268-TR
30
LABORATORY OPERATIONS
The Aerospace Corporation
functions as an "architect-engineer" for
national security projects, specializing in advanced military space systems. Providing research support, the
corporation's Laboratory Operations conducts
experimental and theoretical investigations that focus on the application of scientific and technical advances to such systems.
Vital to the success of
these investigations is the technical staff's wide-ranging expertise and its ability to stay current with new developments.
This expertise is enhanced by
a research program aimed at dealing with the many problems associated with rapidly evolving space systems.
Contributing their capabilities to the
research effort are these individual laboratories: Aerophysics Laboratory: Launch vehicle and reentry fluid mechanics, heat transfer and flight dynamics; chemical and electric propulsion, propellant chemistry, chemical dynamics, environmental chemistry, trace detection; spacecraft structural mechanics, contamination, thermal and structural control; high temperature thermomechanics, gas kinetics and radiation; cw and pulsed chemical and excimer laser development
including chemical kinetics,
spectroscopy, optical resonators, beam control, atmospheric propagation, laser effects and countermeasures. Chemistry and Physics Laboratory: Atmospheric chemical reactions, atmospheric optics, light scattering, state-specific chemical reactions and radiative signatures of missile plumes, sensor out-of-field-of-view rejection, applied laser spectroscopy, laser chemistry, laser optoelectronics, solar cell physics, battery electrochemistry, space vacuum and radiation effects on materials, lubrication and surface phenomena, thermionic emission, photosensitive materials and detectors, atomic frequency standards, and environmental chemistry. Computer Science Labocatory:
Program verification, program translation,
performance-sensitive system design, distributed architectures for spaceborne
computers, fault-tolerant computer systems, artificial intelligence, microelectronics applications, communication protocols, and computer security. Electronics Research Laboratory: Microelectronics, solid-state device physics, compound semiconductors, radiation hardening; electro-optics, quantum electronics, solid-state lasers, optical propagation and communications; microwave semiconductor devices, microwave/millimeter wave measurements, diagnostics and radiometry, microwave/millimeter wave thermionic devices; atomic time and frequency standards; antennas, rf systems, electromagnetic ptopagation phenomena, space communication systems.
Materials Sciences Laboratory: Development of new materials: metals, alloys, ceramics, polymers and their composites, and new forms of carbon; nondestructive evaluation, component failure analysis and reliability; fracture mechanics and stress corrosion; analysis and evaluation of materials at cryogenic and elevated temperatures as well as in space and enemy-induced environments.
Space Sciences Laboratory: Magnetospheric, auroral and cosmic ray physics, wave-particle interactions, magnetospheric plasma waves; atmospheric and ionospheric physics, density and composition of the upper atmosphere, remote sensing using atmospheric radiation; solar physics, infrared astronomy, infrared signature analysis; effects of solar activity, magnetic storms and nuclear explosions on the earth's atmosphere, ionosphere and magnetosphere; effects of electromagnetic and particulate radiations on space systems; space instrumentation.