represent a "clustered" discussion of terms frequently mentioned together. ... The Brand Association Map⢠(BAM) tool maps and visualizes associations ...
Mining and Visualizing Online Web Content Using BAM: Brand Association Map TM Navot Akiva
Eliyahu Greitzer
Yakir Krichman
Jonathan Schler
Nielsen Online Inc 4 Shenkar St., Herzliya, Israel {navot.akiva, eliyahu.greitzer, yakir.krichman, jonathan.schler}@nielsen.com
info about the topic as well as the clusters of the related discussion areas.
Abstract In this paper, we describe our Brand Association Map™ (BAM) tool which maps and visualizes the way consumers naturally think and talk about brands across billions of unaided conversations online. BAM is a semi-supervised tool that leverages text-mining algorithms to identify key correlated phrases, terms and issues out of millions of candidate terms which were derived from billions of online conversations. The most correlated phrases with a given brand are then projected and plotted onto visual bull's eye representation. BAM's visualization illustrates both the correlation level between a brand (appears in the center of the visualization) and each of the highly correlated terms as well as the inner correlations among all presented terms, where terms on the same radial angel represent a "clustered" discussion of terms frequently mentioned together. We found BAM useful for extracting various intuitions and beliefs that are highly correlated with brands to better grasp how consumers really contextualize them, out of massive consumer generated media (CGM) documents.
Brand Associations Mapping BAM Introduction The Brand Association Map™ (BAM) tool maps and visualizes associations between a given term and other terms, words and phrases that tend to appear with it in a given Consumer Generated Media (CGM) data collection. The purpose of BAM is to offer the end user a meaningful visual representation of the brand he'd like to explore over a large mass of CGM data. BAM uses several text analysis capabilities based on TrendMine (Akiva N., Schler J. 2006) system, to provide efficient indexing, scanning and analyzing of billions of CGM text messages.
The BAM Work Process Feeding Initial Leading Term. The first step for the user is to select one or more terms to analyze, and automatically find correlated terms for it. Such term is usually in a form of an entity like: company, product, category, name, etc. This concept would be at the center of the analysis and can either be a single word, phrase or a complex concept. TrendMine enables the use of complex structures to define these entities by providing a sophisticated rule based mechanism.
Introduction Over the recent years, there has been a major contribution to the web's content volume from the Social Media field, or as we refer to as CGM–Consumer Generated Media. CGM resources include Weblogs, boards, Wiki etc. Due to the massive growth of CGM data in the web, there is an increasing need for analyzing the large data mass efficiently in order to extract marketing, social and educational insights out of it. The challenge as we see it is doubled: quick and useful extraction of related entities out of a large CGM corpus, and visualization of the results in a clear and meaningful way that would provide insights into these discussions. The main contribution of this work is a single and comprehensive visualization for millions of messages in the blogosephere discussing a specific topic. Sometimes (especially in the CGM space) it's hard to read and grasp all the information about a topic that is around, and picture is worth more than thousand words. While there are many other methods that try to summarize\extract key info\sentiment this is another yet very useful way of displaying and summarizing the key
Correlating Terms. Once we have fed the system with the term we are interested in, along with specifying the desired data sources and date range, the engine quickly searches the entire data set and applies a set of propriety correlation methodologies. These methodologies, in an unsupervised manner, rise up terms and phrases that are highly correlated to the analyzed term, considering relative and absolute frequency (in addition to other factors as well).
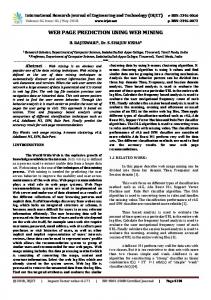
Projection and Plotting. Having the top correlated terms (which can be labeled into categories using clustering algorithm), BAM enters the phase of plotting the results. We then use a propriety algorithmic sequence to project a meaningful representation of the brand association map. BAM's visualization (see Figure 1) describes the distance between the displayed terms in two ways: the Radial Distance and the Angular Distance. The radial distance between the leading term (located at the bulls-eye center)
Copyright © 2008, Association for the Advancement of Artificial Intelligence (www.aaai.org). All rights reserved. 1
170
and each surrounding term reflects the logical conjunction of that term with the leading one over the examined data. The angular distance between terms intends to gives an overall estimation about the relationships between the selected terms. The smaller the angular distance between two concepts, the higher the correlation is. Because of this there is a high probability that they would appear together in the same sentences. Words that always appear together will show up on the same ray from the center.
progression of disease (at 10 o'clock position), 4) terms talking about early diagnosis that can prevent the disease (at 11 o'clock position), and 5) breast cancer related charities and funds (12 o'clock position). It can be noticed from figure 2, BAM's visual plot has meaningful terms grouping on top of the radial and angular distances that represents issues being discussed related to breast cancer as well as the relationships amongst them.
Fig. 1: The Radial and the Angular Distance between each two correlated terms, over the bull's-eye plot.
Fig. 2: BAM's final plot: "Breast Cancer" (in the middle) and it's highly correlated terms, labeled by categories.
Additional Features. BAM provides additional visual features for betterment of the visualization, including: presenting/eliminating specific category visualization on the map, cyclically rotating the mapped terms around the leading term, saving an XML representation of the plotted map apart from its data, and exporting the map to JPG or PNG files format.
Summary As shown, BAM is a powerful tool that combines sophisticated text analysis along with clear meaningful visualization which provides insights extracted out of massive CGM data in a clear and efficient way. BAM can be used to track and analyze discussions around specific topics and concepts. It also identifies key correlated terms groups which enables users to understand its correlation to the analyzed term and to each other in a visual user friendly way.
BAM in action In Figure 2 we show an example of using BAM for visual analysis of breast cancer discussions in CGM data. The "Breast Cancer" term is located at the bull’s-eye center surrounded by the most correlated terms.
References Akiva, N., and Schler, J. 2006. TrendMine: Utilizing authorship profiling and tone analysis in context. In Proceedings of the ACM SIGIR Workshop on Stylistics for Text Retrieval (SIGIR’06). Seattle, WA.
One can easily observe the five highly connected termcategories that are plotted: 1) terms relating to the research on connection between IGF hormones and breast\prostate cancers (at 3 o'clock position on the figure), 2) hormonal therapy for postmenopausal woman and correlation to breast cancer (at 6 o'clock position), 3) terms that discuss the increasing level of therapies with
171