Mar 1, 2003 - Keywords: Sport mining, clustering, science of success ... formance of the rider and data from training session to define the intensity of.
Mining efficient training patterns of non-professional cyclists Discussion Paper - Original paper in [1] Paolo Cintia, Luca Pappalardo, and Dino Pedreschi University of Pisa, L.go B. Pontecorvo 3, Pisa, Italy {cintia,lpappalardo,pedre}@springer.com http://www.di.unipi.it
Abstract. The recent emergence of the so called online social fitness open up new scenarios for fascinating challenges in the field of data science. Through these platforms, users can collect, monitor and share with friends their sport performance, with interesting details about heartrate, watt consumption and calories burned. The availability of this data, collected among a large number of users, gives us the possibility to explore new data mining applications. In the current work, we present the results of a study conducted on a sample of 29, 284 cyclists downloaded via APIs from the social fitness platform Strava.com. We defined two basic metrics: a measure of training effort, that is how much a cyclist struggled during the workout; and a measure of training performance indicating the results achieved during the training. Although the average effort is weakly correlated with the average performance, by deeply investigating workouts time evolution and cyclists’ training characteristics interesting findings came out. We found that athletes that better improve their performance follow precise training patterns usually referred as overcompensation theory, with alternation of stress peaks and rest periods. Studies and experiments related to such theory, up to now, have always been conducted by sports doctors on a few dozen professionals athletes. To the best of our knowledge, our study is the first corroboration on large scale of this theory. Keywords: Sport mining, clustering, science of success
1
Introduction
Data science is becoming always more popular across many disciplines. Sports science, of course, could not be missing. From simple statistical analysis to physiologic test, data in sport are fascinating and fundamental at the same time. Nowadays, the perspective of securing a competitive advantage versus their peers is driving major sports organization to collect and analyze more and more data on their athletes: individual player performance, coaching or managerial decisions, game-based events, and the list goes on. Obviously, since such data rep-
2
Mining efficient training patterns of non-professional cyclists
resent a great wealth in terms of competitiveness for sport organizations, they are rarely made public. In the current work, already published in [1], we present the results of a study conducted on a sample of 29, 284 cyclists downloaded via APIs from the social fitness platform Strava.com. This platform makes fitness a social experience: cyclists and runners all over the world can share, compare and compete with each other’s personal fitness data via mobile and online apps. By using the available information about cycling workouts (such as average speed, duration of ride, cyclists’ heart bit rate and power), we derived two basic metrics: a measure of training effort, that is how much a cyclist struggled during the workout; and a measure of training performance indicating the results achieved during the training. Analyzing the relationship between these two metrics, no correlation between effort and performance emerge. This means that, in general, employing greater effort does not necessarily produce better results. However, by clustering the evolution of training sessions we discovered that athletes that better improve their performance follow a precise training patterns usually referred as the overcompensation theory [7], the main medical sports theory applied to aerobic sports. Studies and experiments related to such theory, up to now, have always been conducted by sports doctors, in specialized (and expensive) laboratories on a few dozen professionals athletes. To the best of our knowledge, our study is the first corroboration on large scale of this theory.
2
Data description
Strava.com1 is a social fitness platform where cyclists and runners all over the world can share, compare and compete with each other’s personal fitness data via mobile and online apps. By the app, a user is able to find popular and competitive segments nearby the place where she is located, and participate in virtual rides or races with other users. Using Strava.com APIs, we downloaded a set of features regarding a sample of the 29, 284 users from around the world (Table 1). We selected a subset of 1, 868 users with the following characteristics: i) they have more than 30 training sessions in the period November 2012 - May 2013 (25 total weeks), in order to select users that are active throughout the period of observation; ii) they perform workouts in the northern hemisphere, in order to obtain similar seasonal weather conditions. The number of training sessions per week is law in cold seasons (from November to February) and grows as the weather conditions start to improve. For each training session of each rider we have the following information: moving time, traveled distance, elevation gain, heart rate stream with a sample rate of 3 seconds, estimated average watts produced. Furthermore, for each session we have the crossed competitive segments. In particular, every segment has its elapsed time, elevation gain, VAM (mean ascent velocity), and estimated average watts (Table 1, right). We use data from segments to evaluate the per1
http://www.strava.com/
Mining efficient training patterns of non-professional cyclists
3
formance of the rider and data from training session to define the intensity of the workouts. Total users
29,284
Users in period Nov 2012 - May 2013
1,868
Total Km traveled
4.8023 ∗ 109 km
Total elevation gained
4.58612 ∗ 107 m
Total training time
195,625h 53m 43s
Estimated power production
11.796472 MW
Total training session analyzed
88,632
Average training session per user per week
1.89
Available information moving time traveled distance Training sessions elevation gain heart rate stream estimated average watts elapsed time Crossed segments elevation gain mean ascent velocity (VAM) estimated average watts
Table 1. Description of the Strava dataset
3
Metrics
Science of training defines the fitness performance as a combination of aerobic capacity, lactate threshold and economy. The aerobic capacity V O2 max indicates the amount of oxygen the body can process to produce movement. It is measured in terms of milliliters of oxygen per kilogram of body weight per minute [6]. A world-class male rider usually produces numbers in the 70 to 90 ml/kg/min range. A normal non-professional rider typically tests in the range of 40 to 50 ml/kg/min. Although it is trainable to a certain extent, aerobic capacity is largely determined by genetics and limited by physiological factors. The lactate threshold (or “anaerobic capacity”) is the level of effort intensity above which lactate begins to rapidly accumulate in the blood [6]. At this point, in the production of energy metabolism rapidly shifts from dependence on the combustion of fat to dependence on glycogen, that is the storage form of carbohydrates. The higher this threshold as percentage of aerobic capacity, the faster the athlete is able to ride for an extended period of time. In contrast to aerobic capacity, lactate threshold is a highly trainable characteristic, to such an extent that in general the goal of a training period is mainly intended to elevate the lactate threshold. Economy can be viewed as the capacity of the rider to use less energy to produce the same amount of power. It is given by a combination of genetic and physiological factors, like the percentage of slow-twitch muscle fibers, the body mass or the psychological stress and the aerodynamic of the bike-rider system [6]. Aerobic capacity, lactate threshold and economy depict together a clear picture of the state of fitness of an individual, describing both effort and performance performed by the athlete. Unfortunately, Strava.com does not provide enough information to compute the complete set of fitness indexes. So, how to extract from our data reliable estimations of training effort and performance? Modern sports science suggests that power is an adequate value to concisely summarize the fitness behavior of an individual. Expressed in watt as the ratio
4
Mining efficient training patterns of non-professional cyclists
between workload and time, it is the more accurate index to evaluate both workout intensity and performance. Chris Froome, for example, based his training method on the monitoring of power values, who presumably played a key role in his victory of 2013 edition of Tour de France. The Training Stress Score (TSS) measure is a power-based effort measure, as defined in [9]. For each athlete, five different power zones are identified and the score of each zone is obtained with the following formula: X TSS = ti ∗ ci (1) i∈Z
where Z is the set of zones; ti is the time spent running in zone i; and ci is a score directly proportional to the watts range and, subsequently, to the physics stress amount of the zone. Since power meters are expensive and not yet widely diffused, only a few users in our dataset have reliable information about watts produced during the workouts. Conversely, heart rate monitors are largely diffused between non-professional cyclists. For this reason, we approximated TSS using HeartTSS, that is the training stress score measured using heart rate based zones. Although it is a little less precise parameter, Coggan [9] showed a direct correlation between watts and heart pace. For each cyclist in the dataset, we computed the corresponding HeartTSS measure, by considering her heart rate extension through the minimum and maximum values, referred respectively as HRmin and HRmax . Then, according to Table 2 and equation 1, we computed the scores in the corresponding zones.
Zone
Heartrate interval
Score
Z1
< HRmin + (HRmax − HRmin ) ∗ 0.6
30
Z2
≥ Z1and < HRmin + (HRmax − HRmin ) ∗ 0.7
60
Z3
≥ Z2and < HRmin + (HRmax − HRmin ) ∗ 0.8
80
Z4
≥ Z3and < HRmin + (HRmax − HRmin ) ∗ 0.9 100
Z5
≥ Z4
120
Table 2. HeartTSS zones
Once defined a reliable index of training effort, we need a measure of training performance. To this purpose, we used the Mean Ascent Velocity (VAM), defined by Ferrari (former trainer of Lance Armstrong) as the elevation gain over time: VAM = (M ∗ 3600)/T (2) where M indicates the meters ascended and T the time (in seconds) it took to ascend. This value, calculated in meters/hour, is used to compare cyclists’ performance across different uphills climbing, in order to have a capability estimation of riders not influenced by other factors such as wind or aerodynamics. Although climbing is usually done at low speed, it is considered the hardest and most important part of a cycling race: “When road goes up”, said great cyclist
Mining efficient training patterns of non-professional cyclists 0.0045
0.0025 µ =269.00 σ2 =122.72
0.0040
1600 µ =563.13 σ2 =208.31
p(mean TSS)
p(mean VAM)
0.0030 0.0025
0.0020
1200 1000
0.0015
mean VAM
0.0035
0.0010
0.0015 0.0010
ρ =0.16
1400
0.0020
5
800 600 400
0.0005
200
0.0005 0.00000
100
200
300
400 500 mean TSS
600
700
800
900
0.00000
200
400
600
800 1000 mean VAM
1200
1400
1600
00
100
200
300
400 500 mean TSS
600
700
800
900
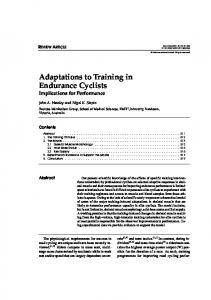
Fig. 1. (Left) Probability distributions of mean TSS and (Center) mean VAM for users in our dataset. µ and σ 2 indicates respectively mean and variance of the fitted curve. (Right) Correlation between mean TSS and mean VAM. ρ indicates the Pearson’s correlation coefficient.
Eddy Merckx, “you can’t hide yourself”. In addition to VAM, we also evaluated performance by an estimation of watts produced in workouts, calculated via software by Strava through the physics formulae explained in [2]. Although this measure is only an approximation we use it to have another clue about the quality of the patterns we extract from our dataset.
4
Experiments
The first interesting aspect we investigated in our study is the distribution of efforts and results accomplished by the amateur cyclists in the dataset. To do this, we computed for each user the mean values of TSS and VAM she performed in her workouts during the period of observation. As Figure 1 (left and center plots) shows, the distributions are very well fitted by Gaussians, with mean and variance values of µ = 269, σ 2 = 122.72 (TSS) and µ = 563.13, σ 2 = 208.31 (VAM). In the world of amateur bikers a typical cyclist emerges, showing performance considerably lower than the ones accomplished by professional cyclists. Included in the distribution, those cycling champions would appear as outliers, with performance about three times our average Strava users. As the scatter plot in Figure 1 (right) suggests, the average TSS and the average and VAM of users are weakly correlated, presenting a very low Pearson’s correlation coefficient ρ = 0.16. While some users seem to achieve very good average results with very little average effort, others fail to achieve good performance, independently from the effort employed. Such results, however, concern the aggregated behavior of users. As the overcompensation theory suggests [7], the time evolution of workouts strongly influences the performance improvement: the intensity of your workouts and the way you distribute them over time will determine your future sports performance. In order to study the workouts time evolution and detect those producing the best benefits, we used the following metrics: – Sum of TSS of every training session performed during the week; – VAM variation achieved in the week, computed as the difference between the average VAM of a week and the average VAM of the previous one;
Mining efficient training patterns of non-professional cyclists 450 400 350
TSS clustering
450
cluster T1 cluster T2 cluster T3
400 350
150
300 250
TSS
250
200
150
100
100
50
50 5
10
week
15
20
25
00
Watts variation clustering cluster W1 cluster W2 cluster W3
100
200
150
00
200
VAM variation
300
VAM variation clustering cluster V1 cluster V2 cluster V3
Watts variation
6
50
5
10
week
15
20
25
00
5
10
week
15
20
25
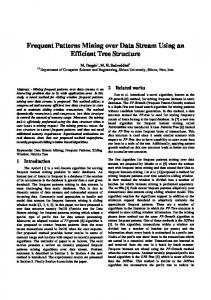
Fig. 2. Values performed by cyclists in the clusters during the period of observation for TSS clustering (left), VAM variation clustering (center) and Watts variation clustering (right).
– Estimated Watts variation achieved in the week, calculated using the average estimated watts for all the segments faced during the week. We considered a period of observation of 25 weeks, from November 2012 to the end of April 2013, because the chosen period is the first and important half part of a cycling season, which usually starts with the winter initial workouts and it is oriented to the first days of May, when the most important amateur races take place. Once we characterized each athlete with her weekly TSS, VAM variation and Watts variation, we split the whole population in clusters of similar users with respect to each single metric. To perform this task, we used the KMEANS clustering algorithm [11] with k = 3. The three behaviors highlighted by the TSS based clustering (Figure 2, left) are easy to find across the “peloton”, as the population of bike riders is called between the domain experts. Cluster T1 (blue dashed curve) identifies the “low trained” rider, who does not have so much time (or will) to perform long training sessions; Cluster T3 (green dashed curve) represents the opposite “would-be professional” rider, which dedicates a big part of her life to cycling. Between them, in cluster T2 (red solid curve) there is the “wise” rider, with training workload increasing as well as spring arises and weather conditions improve. VAM and Watts variation clustering (Figure 2) show similar trends and seem to be coherent with the previous results. In the plots, the three clusters show an initial striking difference: a starting condition where riders’ “engines” seem to have different “capacity”. Going forward in time, the values almost start to converge, indicating us the efficiency of the three different approaches to training. With respect to the VAM variation clustering (Figure 2, center), the most interesting is the behavior shown by cyclists in cluster V2 : even though in the beginning the average increment is lower than cluster V3 , it finally reaches the highest peaks during the important part of the season. In a virtual battle of the clusters, cluster V2 would win, highlighting how fundamental are quality of training and workout planning for a training season. In an individual aerobic sports like cycling, where the focus is on the individual physiological parameters, not only the “engine” matters, but type and quality of the training plan play a fundamental role.
Mining efficient training patterns of non-professional cyclists 350
600
user V2 user V3
300
500
250
3.0
user V2 user V3
400
2.0 TSS/VAM
200 TSS
VAM
300
150
200
100
00
5
10
week
15
20
25
00
1.5
1.0 0.5
100
50
user V2 user V3
µV2 =1.00 µV3 =0.60
2.5
7
5
10
week
15
20
25
0.00
5
10
week
15
20
25
Fig. 3. Comparison of two users from clusters V2 and V3 in terms of TSS (left), VAM (center) and TSS/VAM ratio (right).
In Figure 3 (left) we show the TSS time evolution of two users extracted from the most interesting and competitive clusters V2 and V3 (VAM variation clustering). Such users are the closest to the centroid of the respective clusters, and present very different training characteristics: while the V3 user starts with high intensity since the beginning of the winter, user V2 seems to adopt a more focused periodization of the training. Indeed, she starts with a low-stress winter preparation and increases the intensity during the season, with two resting periods where the intensity decreases (red solid curve in Figure 3 left). This allows the user to tolerate harder training when needed, that is in spring season, as we mentioned before. The benefits of such kind of “periodized” training plan are evident from Figure 3 (center), where the VAMs of the athletes are shown. Figure 3 (right) shows the ratio between TSS and VAM for the clusters, introducing a refined “intensity-of-training” index. In fact, the ratio TSS/VAM could be viewed as a measure of energy consumption, a way to enrich the information about the intensity of training given by TSS. The V3 user has a lower average consumption (µV3 = 0.60) than the V2 user (µV 2 = 1), highlighting the trend of the V2 user to train harder. The TSS/VAM curve of V2 user has the highest peak around the 15th week, followed by a low-consumption period. Looking at the VAM plot of V2 (Figure 3, center), user’s performance starts to significantly grow just around the same period. High stress peak, resting, performance increasing: this is the exact physiological process known as overcompensation.
5
References
Sports data mining is a recent but rapidly growing field. In [3], authors define the sports data mining process and the methods involved in a framework for sports data mining. An example of this kind of approach is depicted in [5], where a pattern discovery exploration has been made to find common winning tactics in tennis matches. Authors of [4] propose a Bayesian classifier for predicting baseball awards, prizes assigned to the best pitchers in the Major League Baseball, reaching predictions correct in the 80% of the cases. Cycling is an individual sports where tactics are not so important among nonprofessional athletes, since the athlete’s performance mainly depends on phys-
8
Mining efficient training patterns of non-professional cyclists
iological characteristics. An interesting introduction to the measures used in cycling training sciences, such as VO2max, is given in [6]. Another important metric we use in this paper is Training Stress Score (TSS), introduced in [9]: based on watts expressed by the athlete, it gives a measure of the intensity of the workout. The Mean Ascent Velocity (VAM) [10], defined as the elevation gain over time, is used to compare cyclists’ performance across different uphills climbing. The importance of the Heart rate parameter is explained in [8], where authors show how heartrate is a good index for expressing the lactate threshold. As stated in [7], periodization is the base for building a correct training plan. Athletes aim to reach one or more performance peaks across the season: in order to do this, the training year is sub-divided in more cycles, alternating high and low intensity training sessions.
6
Conclusion and future works
In this paper, we proposed a first large scale study on sports performance by analyzing a big dataset of cyclists’ training sessions. Average training effort and average training performance of users are weakly correlated, meaning that greater efforts do not necessarily produce better results. However, clustering techniques applied on the training session evolution uncovered that in cycling not only “the engine matters”, but type and quality of training also play a key role. Only users following the well known overcompensation theory reach good training performance.
References 1. P. Cintia, L. Pappalardo and D.Pedreschi, Engine matters: a first large scale data driven study on cyclists’ performance,DMCS 2013, Dallas, TX, US 2. www.strava.com 3. R. Schumaker, O.Solieman, H. Chen, Sports Data Mining, Springer, 2010. 4. L. Smith, B. Lipcomb, A. Smikins, Data Mining in Sports: Predicting CY Young Award Winners, Journal of Computing Sciences in Colleges archive, Volume 22 Issue 4, April 2007. 5. A.Terroba, W.A. Kosters, J.K. Vis, Tactical Analysis Modeling Through Data Mining, Proceedings of the International Conference on Knowledge Discovery and Information Retrieval, 2010. 6. J. Friel, The cyclists’ training bible, Velopress, 2003. 7. Boris Blumenstein, Ronnie Lidor, Gershon Tenenbaum, Psychology of Sport Training, Meyer & Meyer Verlag, 2007 8. A. Luca, J. Hoyos, M. Perez, J.L. Chicharro, Heart rate and performance parameters in elite cyclists: a longitudinal study, Medicine & Science in Sports & Exercise, 2000 9. A.R.Coggan, Training and racing with a power meter: an introduction, Revised 25 March 2003 [online]. Available from URL: http://www.midweekclub.ca/articles/coggan.pdf 10. M. Ferrari, The riders’ performance: how to measure it?, Published 1 mar 2003. Available form URL: http://www.53x12.com/do/show?page=article&id=21 11. Pang-Ning Tan, M. Steinbach, V. Kumar, Introduction to Data Mining, AddisonWesley Longman Publishing Co., Inc. Boston, MA, USA, 2005.