analyze network performance and aid in long term ... 2) Monitor GSM network element statistics. ... control and monitor the other network entities (i.e. base.
IEEE Int'l Conference on Fuzzy Systems and Knowledge Discovery, November 18-22, 2002, Orchid Country Club, Singapore.
MINING OPERATIONAL DATA FOR IMPROVING GSM NETWORK PERFORMANCE Antonio Leong, Simon Fong
Edison Lai
Department of Electrical and Electronic Engineering University of Macau , Macau
Radio Planning Networks Division Hutchison Telephone Limited Macau
ABSTRACT
OMS is that the thresholds are fixed and predefined values which do not adapt to the actual situation. Likewise for GOS, it is calculated from a single cell instead of an aggregate value or a set of values representing the whole network. In essence, the standard queries that select data from cells site used by OMS nowadays are not enough to give an idea or any predicting indicator to the network engineers.
Operation and maintenance system (OMS) is an important part of network management in GSM networks. A large amount of operational data is generated daily in a mobile communication system, which contains hidden valuable information about the system behavior. The knowledge discovered from mining on such data can be used to analyze network performance and aid in long term planning. In this paper, we devise a solution procedure for mining correlated patterns from the operational data of a GSM system that come in a variety of formats. The results will be exploited for finding the critical factors that will affect the network quality and performance. Furthermore, it is believed that when a set of threshold values (that are used in OMS) are predicted in real-time by using a fuzzy classifier system from the rules generated from the past cases, the grade-of-service could be improved while maintaining a minimum number of cells.
2. PROPOSED SOLUTION In this paper, data mining techniques will be applied to explore the critical factors that will affect the network quality and performance. A set of threshold values from any outstanding cells will be analyzed in real time using a fuzzy classifier system. The objective is to optimize the current network performance by increasing the GOS offered to customers while maintaining a minimum number of cells. In particular, we will try to discover abnormal patterns that will directly affect the GOS. We start by analyzing current network performance and try to predict useful results by performing inference on the current data. The results collected can be used to optimize the current configuration. In section 3, we will briefly describe the technological background of the network performance measurement equipment. In section 4, we develop our solution for mining useful knowledge from a large set of raw data. Then we will elaborate on how we mine the operational data.
1. INTRODUCTION Telecommunications has a tremendous growth over the past decade. In this competitive market the robustness of the system, the network coverage, and the quality of service have become the key elements in retaining customers. It is important that the network performance is constantly monitored in order to ensure a high quality service being offered to the customers. In most mobile service industries, the benchmark of GSM network performance is mainly based on the following factors: Grade of Service (GOS), Drop Call Rate (DCR), Call Setup Failure Rate (CSFR) and the traffic statistics. Specifically, for monitoring a GSM system, a tool called Operation and Maintenance Control System (OMS) in OMC is used to probe the data of the above-mentioned performance criteria by using standard query data retrieval methods. The OMS compares the collected data against some threshold values, checks for any violation and proceeds to some recovery steps if needed. A drawback of
3. TECHNICAL BACKGROUND The operations and maintenance system (OMS) provides the capability to manage a GSM network remotely. The OMS comprises of two parts: Network Management Center (NMC) & Operations and Maintenance Center (OMC). The NMC has a view on the entire PLMN (Public Land Mobile Network) and is responsible for the management of the network as a whole. The NMC resides at the top of the hierarchy and provides global network
1
IEEE Int'l Conference on Fuzzy Systems and Knowledge Discovery, November 18-22, 2002, Orchid Country Club, Singapore.
management. The NMC offers the ability to provide hierarchical regionalized network management of a complete GSM system. It is responsible for operations and maintenance at the network level, supported by the OMCs which are responsible for regional network management. The NMC is therefore a single logical facility at the top of the network management hierarchy. The functionality of the NMC can be as follows: 1) Monitor nodes on the network. 2) Monitor GSM network element statistics. 3) Monitors OMC regions & provides information to OMC staff. 4) Passes on statistical information from one OMC region to another to improve problem solving strategies. 5) Enables long term planning for the entire network.
Figure 3 shows a functional representation of performance management data flow. Performance data is generated at the BSS and the RXCDR, and stored as a performance measurement (PM) data file. Performance measurements include traffic measurements within the telecommunications system (both user and signaling traffic), quality of service measurements (delays in call setup) and availability measurements (the beginning and end times of service unavailability). At 30 or 60 minute intervals (defined by the user), the PM files are sent to the OMC. The OMC processing software (known as the parser) then converts the data in the files into raw statistics suitable for storing in the INFORMIX database at the OMC.
Figure 3 - Performance management Figure 1 - Operations and Maintenance System
Measurement results generated in Network Elements (NEs) are sent to the OMC as raw data via an X.25 network. The collected data files are processed into raw statistics and stored in the OMC database. The data files collected are processed into raw statistics. These raw statistics are used for creation of key, network health or custom statistics. These statistics might include call processing, interface, and processor utilization measurements. Key statistics are generated at the OMC by processing raw statistics generated by the Base Station System (BSS) using some predefined algorithms. These statistics are designed to give an overall indication of the condition of the system and allow comparisons of similar time periods over a span of time, to help detect congestion trends and possible performance degradation. Key statistics also provide means to facilitate the monitoring the most important network parameters. For example, various handover failure statistics may be combined and averaged over the total number of calls, to produce a handover failure rate key statistic. Network health statistics are calculated at the OMC using a combination of raw and key statistics. These
The OMC provides a central point from which to control and monitor the other network entities (i.e. base stations, switches, database, etc.) as well as monitor the quality of service being provided by the network. The role of the OMC within the GSM network management hierarchy is shown in Figure 2.
Figure 2 - Network Management Architecture
2
IEEE Int'l Conference on Fuzzy Systems and Knowledge Discovery, November 18-22, 2002, Orchid Country Club, Singapore.
statistics are used to create BSS network performance reports. These reports provide an indication of the networks health from the subscriber’s perspective. Traditionally, key and network health statistics are analyzed manually by a technical group to discover irregular patterns in order to measure current network performance. In this paper, we will try to analyze key statistics data using data mining techniques in order to obtain useful patterns for measuring network quality. Specifically, we wish to see some sequential and correlated information among all the parameters. The results should be able to give some new insights of network performance, and can be further analyzed to provide operators information needed for network management functions, such as quality-of-service analysis or planning the evolution of the Public Land Mobile Network (PLMN). Next we will describe briefly the key statistics factors affecting the network performance.
Consequently we have defined several categories for the data mining results that are obtained from different data mining methods in order to discover interesting knowledge from our data. They include visualization, clustering, association rule and association rule for classification. We use map visualization to maintain daily base station performance to see if any abnormal event occurs. The following mining result based on historical data can search some useful and interesting pattern, trend, information etc. This knowledge can help in dimensioning the network loading and maintain the network performance. 4.1. Traffic Analysis by Visualization Since the radio coverage of GSM networks are constructed by different base stations, it is needed to monitor the performance of each cell site daily. In this section, we have mapped parameters such as Traffic, Tch Gos, Csfr and Dcr by geographical means, i.e., it distribution along Macao. Also, we can assign other attributes for displaying the result on a geographical map. For traffic, it shows the distribution of traffic density in different areas. For the Tch Gos, it shows which area has higher Tch Gos. These visualization results (shown in Figure 5) can be used for traffic dimensioning and resources management, and it can easily alert traffic problems and aid in shifting some high traffic area to other area (from Red to Green) in order to balance traffic loading. For the Csfr and Dcr, those areas with red or orange spots are areas with high call setup failure and drop call rate. By alerting this, network operators can design a better network and ensure good quality and performance for the base stations.
4. DATA-MINING ENVIRONMENT
High Traffic
Figure 4 – Flow of data for data mining in OMC The following figure shows the relevant key statistical data collected and processed by OMC. Data are collected in hourly and daily basis at regional level or cell level. Technicians will first analyze system-wide data in order to discover unusual patterns. They will have to discover the cause of irregular pattern by investigating the origin of unusual network behavior. Once the search region is reduced, cell level data are analyzed to discover unusual pattern affecting the overall network performance. We have been applying a data-miner called Castaneda and fine-tuning the appropriate data-mining algorithms for identifying patterns that have impact on GSM network performance.
Figure 5 - Busy_Tch_Mean distribution on a visual map.
3
IEEE Int'l Conference on Fuzzy Systems and Knowledge Discovery, November 18-22, 2002, Orchid Country Club, Singapore.
find out cells within this range to detect the problematic cells causing high DCR. A sample of such cluster is given in the appendix.
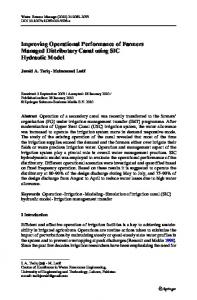
4.2. Traffic Analysis by Classification We start by aggregating weekly data on weekday basis and try to find the distribution of several parameters over each day of the week. Castaneda classifies each parameter into five groups with simplified visualization process. In particular we try to analyse the traffic, Tch blocking, and Sdcch blocking over each day of week in order to gain a deeper understanding of high traffic and blocking dates. By gaining access to this type of information, we can better allocate our resources and equipments in keys dates such as days of week with high traffic.
4.3. Association Rule & Association Rule for classification In our experience it is not wise to mine with association rule without a target attribute because it will give a lot of different combination of association rules. Using association rule is suitable when the data source does not contain more than 10 columns. In our project, we try to find useful rules that control the network performance. We try to guarantee the main attributes Call setup failure Rate (Csfr), Drop Call Rate (Dcr), Handover Drop Call Rate (Dcr Ho), Handover Failure Lose (Ho Fail Los), Handover Failure and Recover (Hof) and Traffic channel Grade of Service (Tch Gos) under a threshold value. Using Association Rule for classification, it can give some general rules on how to maintain the network performance.
Weekday vs t r af f ic
100% 80% x