Clustering, Stability, Cluster Analysis, Log Analysis, Web Mining, User Interest,
..... on Web Mining, SIAM Conference on Data Mining (Chicago IL, April 2001),.
Mining the Structure of User Activity using Cluster Stability Jeffrey Heer, Ed H. Chi PARC (Palo Alto Research Center) Palo Alto, CA 94304, USA {jheer, echi}@parc.com Abstract Recent research has explored web user session clustering as a means of understanding user activity and interests on the World Wide Web. Though the proposed techniques have proven to be useful and effective, they require that one either specify the number of clusters in advance or browse a large hierarchy of clusters to find the optimal depth at which to describe user activity. In this paper, we examine the utility of a stability-based technique for automatically determining the optimal number of clusters in the context of web user session clustering. We present two case studies evaluating the technique’s effectiveness. Keywords Clustering, Stability, Cluster Analysis, Log Analysis, Web Mining, User Interest, User Sessions 1 INTRODUCTION As the Web continues to evolve and expand, engraining itself into the fabric of our everyday lives, it becomes increasingly important to get accurate pictures of web usage and activity. Nearly every aspect of the web experience can be improved by understanding the composition of goals and activities on a web site. This includes an array of topics ranging from server performance, to page caching and prefetching, to content and navigation design. Determining the composition of user interests on the Web is a daunting task. Given the massive size of the Web, along with the time and resource costs involved in traditional techniques such as contextual inquiry and user surveys, it becomes clear that accurate, automated techniques are necessary for acquiring this information. One promising automated approach is user session clustering, which, using web usage logs, attempts to group site visits into common activities such as product catalog browsing, job seeking, and article browsing. While a number of session clustering approaches have been proposed, with varying degrees of complexity and accuracy [8], they all share a common setback: none of the proposed methods currently discover the optimal structure of the data to be clustered. That is, they are unable to determine the number of clusters which best represent the high level composition of user activity on a site. This leaves web analysts with the need to browse through large categorization hierarchies or try a number of cluster counts until a seemingly acceptable choice is reached. In this paper, we build upon our previous work in user session clustering, incorporating a recently proposed method for automatically determining the optimal number of clusters. We then evaluate this method to test its effectiveness for user session clustering. The remainder of the paper is organized as follows: First, we discuss related work in user session clustering and automatic cluster count determination. Next, we present our session clustering method in greater detail and describe a stability-based method for determining the structure of clustered data. We then evaluate this method, performing case studies on a pair of web sites, and present the results. Finally, we offer some concluding remarks. 2 RELATED WORK 2.1 Web User Session Clustering A number of web mining analysis tools have emerged which offer basic summarization of web activity by grouping user actions into activities such as reading bulletin board messages, finding product information, or searching for technical support. A number of clustering approaches have been proposed, all of which use web server logs to generate a model of user actions that is then grouped with a clustering algorithm. Shahabi et. al. describe a prototype system that uses viewing time as the primary feature to describe a user session and then clusters the sessions using K-Means clustering [16].
Fu et. al. suggested a technique called ‘Generalization-based Clustering’ which uses page URLs to construct a hierarchy which is then used to categorize the pages [6]. The page accesses in each user session are described using these page categorizations and are then clustered using the BIRCH algorithm [20]. Banerjee et. al. utilized the combination of time spent on a page and Longest Common Subsequences (LCS) to cluster the user sessions [1]. The LCS algorithm is first applied on all pairs of user sessions. Then each LCS path is reduced using page hierarchy in a generalization-based approach called ‘Concept-based Clustering’. This is basically a simplified form of Generalization-based Clustering, using only the top most level of the page hierarchy. Similarities between LCS paths are then computed as a function of page viewing time, creating a similarity graph that is then partitioned using the Metis algorithm [11]. Finally, Heer and Chi proposed a technique that utilizes a number of information sources to create a model of user profiles, which can then be grouped using standard clustering algorithms [8, 9]. This method utilizes data features from content and structure, in addition to the URLs, sequence ordering, and timing data already contained in logs. A user study on www.xerox.com found that the method accurately grouped users by their surfing goals [9]. We will revisit both this method and its evaluation later in this paper. One common drawback to these clustering techniques is that they contain no measure of the structure of the data being clustered. For the partitioning approaches, no means for determining the appropriate number of clusters is provided. For hierarchical clustering approaches, the analyst must probe the entire hierarchy and manually search for the right levels at which to describe the sessions. To ease the burden of web analysts who wish to apply these techniques, it is necessary to augment these methods such that they also find the structure (or lack thereof) in the usage data. Optimally, this would include finding structure at multiple levels of granularity, determining both high-level groupings such as Product Browsing or Job Searching, and more specific groupings such as Engineering Positions and Sales and Marketing Jobs. In our experience [8], this can be achieved with a human supervisor making the decisions on the optimal clustering structure, merging and reclustering groups as necessary. We now examine proposed techniques for automating this process. 2.2 Determining Cluster Counts A number of methods for automatically determining the structure of clustered data have been proposed, including statistical modeling methods, cluster dispersion measures, and analyses of cluster stability. Fraley & Raftery [4] describe the use of an approximated Bayes factor, computed with the EM (Expectation-Maximization) algorithm, to compare statistical models of cluster data and simultaneously choose both the desired number of clusters and clustering technique. Calinski & Harabasz [3] proposed maximizing a normalized ratio of between and within cluster distances as a means of choosing the optimal number of clusters. A 1985 study by Milligan and Cooper [13] determined this to be the best metric among those considered in the study. A number of methods based on cluster dispersion, or the within cluster sum squared distances, have been proposed, including approaches by Hartigan [7], Krzanowski and Lai [12], and Tibshirani et. al. [18]. Of recent interest is the work of Tibshirani et. al., who proposed the ‘Gap statistic’ for determining the optimal number of clusters. The method computes the within cluster dispersion for increasing values of k, and compares the change in these values against a reference null distribution. Tibshirani et. al. explored using both a uniform reference distribution over the range of each feature, and a uniform reference in the principal component orientation. Cluster stability has also been proposed as a criterion for determining the structure of data. Building off of previous work in stability measurement [17] and cluster comparison [5], Ben-Hur et. al. proposed a stability-based method for finding the optimal number of clusters [2]. Their technique samples a space of clusterings for each choice of k, and uses a clustering similarity metric to generate a distribution of stability values. This distribution is then used to choose the most stable clustering. For the purposes of our research, we decided to investigate the stability-based measure as formulated by Ben-Hur et al. Not only does this approach match most closely with our own preliminary formulations, the technique also showed the best results in an evaluation across an array of different data sets [2]. Additionally, as Ben-Hur et. al. discussed, stability-based methods are independent of model and technique, and furthermore do not make any assumptions as to cluster shape or density as some other methods do.
3 METHODS In this section, we first describe our method for clustering web user sessions. We then describe Ben-Hur et al’s stability based measure for determining the structure of clustered data. 3.1 Multi-Modal Clustering of User Sessions Multi-Modal Clustering (MMC) is a technique which utilizes multiple information data features (modalities) to produce clusters. Here we summarize how this technique can be applied to cluster user sessions as described in [8]. We first collect the Content, Usage, and Topology (CUT) data of the Web site to be analyzed. We obtain the usage logs and sessionize them using the techniques described in [14]. We obtain the Content and Topology (linkage structure) via a Web crawler. This data is used to construct a vector-space model of user profiles, first by creating models of both the Web site and the user sessions, and then combining them to generate the user profiles. We then define a similarity metric for comparing these profiles and use it to generate the resulting clusters. Among the techniques we employ to create these vector space models is the Term Frequency by Inverse Document Frequency (TF.IDF) weighting scheme. A common technique in the information retrieval field, TF.IDF provides a numerical value for each term in a document, indicating the relative importance of that term in the document. This weighting is roughly equal to a term's frequency in a given document divided by the frequency of the term occurring in all documents [15, p. 542]. Formally, TF.IDF can be expressed as TF.IDF = log(1 + tf) * log(N / df), where tf indicates the number of times a term occurs on a given document, df indicates the number of documents in which the term appears, and N indicates the total number of documents. We model the content and structure of the Web site using a number of information sources. Each source of information (or modality) for a page is expressed as a feature vector. The modality vectors are: • Content: The content of all pages is processed using the TF.IDF weighting scheme to find the importance of each word. The Content vector of a page is the TF.IDF weighted keyword vector containing all of the words on that page. • URL: Each URL is tokenized using ‘/’, ‘&’, ‘?’ and other appropriate delimiters, and then the tokens are weighted using TF.IDF. The URL vector of a page is the corresponding URL token keyword vector of the URL of that page. • Inlink/Outlink: The Outlink vector of a page describes which pages are reachable from this page, while the Inlink vector describes which pages link to this page. Representing the topology of a site using an adjacency matrix, the Outlink vector of a page is the corresponding row of the matrix, while the Inlink vector is the corresponding column. The next phase of our method consists of modeling the user sessions. We represent each session as a vector that describes the session's sequence of transactions. For example, if a Web site consists of 5 pages labeled A through E, a session consisting of page views A B D could obtain a vector (1,1,0,1,0) corresponding to the space (A,B,C,D,E).
→→
We have explored a number of possibilities for assigning the actual vector values. These Path Weightings consist of several combinations of schemes:
→→
(a) Uniform: Each page receives equal weighting in the session, e.g. A B D = (1,1,0,1,0). (b) TF.IDF: Treating each session as a document and the accessed pages as the document terms, each page receives a TF.IDF weighting. (c) Linear Order (or Position): The order of page accesses in the session is used to weight the pages, e.g. (1,2,0,3,0). (d) View Time: Each page in the session is weighted by the amount of viewing time spent on that page during the session, e.g. A(10sec) B(20s) D(15s) = (10,20,0,15,0). (e) Various Combined Weighting: Each page in the session is weighted with various combinations of the TF.IDF, Linear Order, and/or View Time path weighting. Here is an example with both Linear B(20s) D(15s) = (10,40,0,45,0). Order+View Time: A(10sec)
→
→
→
→
Next we create a representation (or profile) of user interests based on the pages that lie on each user’s surfing session. We assume implicitly that each page a user sees is a part of that user’s information interest. To represent this profile, we build up a feature vector of each page, and then construct the profile as a linear combination (weighted vector sum) of the feature vectors, using the user sessions to formulate the weightings. To do this, we first construct a vector S to describe each session as described previously. Then each page is described using a multi-modal vector P, which is a concatenation of the Content, URL token, Inlink, and Outlink modality vectors. A user profile UP is then constructed as linear combinations of the page vectors P using the weights in S. Each user profile then undergoes normalization, with each modality subvector being normalized to unit length. We then define a similarity metric D() for the user profile vectors. To do this, each modality subvector from one vector is compared to the corresponding modality subvector in the other vector using the cosine similarity function, which measures the cosine of the angle between two vectors [15]. The values of these comparisons are then linearly combined to obtain a single similarity value between [0,1]. Modality Weightings are used to help define the relative contribution of each modality in the similarity function. For example, we might specify that the Content modality vector should contribute 75%, while Inlink should contribute only 25% to the value of the similarity. So,
D(UP1,UP2) = .75*cos(UP1content,UP2content) + .25*cos(UP1Inlink,UP2 Inlink). Using this similarity function, we can then apply traditional clustering algorithms to the user profile vectors. In our studies we used a bisection-based variant of the traditional K-Means algorithm, described in [10, 21]. The algorithm starts with one cluster consisting of all sessions, and uses K-Means to repeatedly bisect clusters until a site-dependent, user-specified number of clusters is achieved.
3.1.1 Previous Evaluation of Multi-Modal Clustering Method To evaluate how well the groupings generated by the Multi-Modal Clustering method reflect the actual goals and interests of web users, we previously conducted a user study in which participants were asked to perform tasks selected from an a priori task categorization structure (15 tasks in 5 major groups) on the live www.xerox.com website [9]. We then clustered the captured user session traces and compared the results against our a priori task grouping. The results of the study were quite encouraging; by choosing the correct data modalities and weighting schemes we were able to achieve categorization accuracies as high as 99%! We also showed that the use of page content and page viewing time significantly contributes to clustering accuracy and robustness. For the purposes of this paper, we used the viewing time session weighting scheme in conjunction with the Content and Inlink modalities, weighted 0.75 and 0.25, respectively. As discussed in [9], we believe this parameterization to be a good compromise between accuracy and robustness. 3.2 Stability Measures for Choosing Cluster Count We hope to augment the clustering method described above to determine the number of clusters automatically. Ben-Hur et al proposed a novel technique for determining the optimal number of clusters [2]. This technique works with both partitioning and hierarchical clustering algorithms, finding the optimal choice of clusters in partitioning applications and finding the depth at which the most stable clustering occurs in hierarchical applications. Ben-Hur et al begin by describing a cluster similarity metric introduced by Fowlkes and Mallows [5]. First, for a given clustering of a data set X, a matrix C is constructed where Cij = 1 iff xi and xj belong to the same cluster and i ≠ j. Otherwise Cij = 0. We can then define a similarity measure between two clusterings of the same data set using the dot product of these matrices C. Formally, this dot product can be expressed as
C 1 , C 2 = ∑ Cij1 Cij2 i, j
Normalizing this dot product, we can achieve a correlation or cosine similarity metric, defined by
cor (C , C ) = 1
2
C1, C 2 C1 , C1 C 2 , C 2
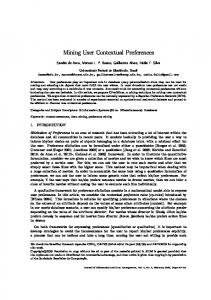
By using this metric to compare two k-way partitions generated by the same clustering algorithm, we can get an idea of how stable the clustering is for that value of k. The higher the value of this metric, the more items that were assigned to the same clusters, and hence the more stable the clustering is. To make this measurement reliable, it is best if used over a sample of clustering trials. To determine the optimal number of clusters, two different subsamples of the data set are first created (Ben-Hur et. al. recommend a sampling ratio of 0.8) and then clustered into k clusters1. The intersection of these clusterings is then computed, i.e. those items which appear in both subsamples are found, and the intersected clusterings are compared using the metric described above. This is repeated for a specified number of iterations (Ben-Hur et. al. used 100), generating a distribution of similarity values for the current value of k. This analysis is duplicated for each value of k ranging from 2 up to a specified maximum. By analyzing the resulting distributions, one can discern the optimal number of clusters. To actually find this optimal number, a number of different possibilities arise. Ben-Hur et. al. plotted the cumulative distribution of similarity values for each k and found that there were clearly visible ‘phase transitions’ in the distribution, indicating a transition from a more stable clustering to a less stable one (as in Figure 1, between k = 4 and k = 5). This transition can be quantified in any number of ways, such as analyzing the changes of the area beneath the distributions or by calculating the probability that the similarity values are greater than some threshold.
3.2.1 Previous Evaluation of Stability Method for Choosing Cluster Count Ben-Hur et. al. evaluated this method on 3 different data sets: a mixture of four Gaussians, a set of DNA microarray data, and a set of uniformly distributed points on the unit cube. The resulting distribution from the case of four Gaussians is depicted in Figure 1. The stability method correctly detected the number of clusters for each data set, even capturing the lack of structure in the unit cube data set. Ben-Hur et. al. compared the performance of their method with a host of other techniques, including Calinski and Harabasz’s index and Tibshirani et. al.’s Gap statistic, and found that the stability-based method was the only method able to determine the correct number of clusters in all cases.
Figure 1 Cumulative similarity distribution for analysis of four Gaussians
3.2.2 Issues Although this stability technique shows great utility, its current formulation requires a great deal of running time. As Ben-Hur et. al. point out, this can be partially resolved by using a hierarchical clustering algorithm; by computing the hierarchical clustering once, you can then just cut the resulting cluster tree to get partitions for each value of k, limiting the number of clusterings to be performed. As the clustering technique we are using to group web user sessions operates by bisection, it is fortunately quite easy to generate a hierarchy as the algorithm progresses. 3.3 Integration In an effort to automatically determine the structure of web user activity, we have integrated the stability method into our own session clustering suite. The combined method generates a collection of user profiles 1
Equivalently, one can compute a hierarchical clustering and cut the resulting tree such that there are k clusters.
as described previously, and then uses the stability technique to identify the (hopefully) optimal number of clusters. The method then returns a complete clustering of the data set for the selected value of k. We now focus on the evaluation of this combined system, investigating the system’s effectiveness for creating optimal groupings of web user activity. 4 EVALUATION To investigate the utility of the stability-based method in the context of web usage data, we applied our combined clustering and evaluation system on two different web usage data sets. First we examine the www.xerox.com data set we used in our previous evaluation of our session clustering technique. The advantage of this data set is that we have designed into the user experiment the a priori groupings that we can use to evaluate the outcome of our analysis. Thus we already know the optimal number of clusters that reflect the actual goals of site visitors. Next we look at real world web logs from the UC Berkeley Group for User Interface Research, and investigate the results of the stability-based method. 4.1 www.xerox.com We first evaluated the stability-based technique using www.xerox.com usage data collected as part of the user study described in [9]. The usage data is made up of 104 unique surfing paths for which an a priori grouping is already known. This structure consists of 15 unique tasks, grouped into 5 task categories: Products, Support, Supplies, Jobs, and Company Information. The individual tasks were selected by consulting with www.xerox.com e-mail feedback. We ran the evaluation using 15 subsamples of the data set, resulting in 105 total comparisons for each value of k, ranging k from 2 to 10. We used a sampling ratio of 0.8. The cumulative distribution of cluster similarity values is pictured in Figure 2. One immediately striking feature of the distribution is that there is no single dominant separation in similarity values as was seen in the case studies of Ben-Hur et. al (e.g. Figure 1). This is not too surprising, for as we will discuss later, we expect web usage data to be noisier and more subjective than data sets from more traditional domains. 1 0.9 0.8
cumulative
0.7 0.6 0.5 0.4 0.3 0.2 0.1 0 0.5
0.55
0.6
0.65
0.7
0.75 0.8 similarity
0.85
0.9
0.95
1
Figure 2 Cumulative similarity distribution for www.xerox.com.
Examining the distribution, we see the most dramatic shifts in stability values around the values of k = 4 (‘x’-points) and k = 5 (‘+’-points). For k > 5, we see that the distributions become highly similar, making k = 5 a good choice for the number of clusters. We note that 5 clusters is also the number of categories in our experiment’s a priori grouping. Thus the stability method has shown some promise for revealing the structure of user activity on the web. It should be noted, however, that this data set is not necessarily representative of real world web log patterns, as all user sessions collected expressed a specific, known task. While this allows us to know the desired number of clusters and thus easily evaluate the stability metric, we suspect this data set to be less noisy than sessions extracted from actual web logs.
4.2 guir.berkeley.edu Next, we applied our system to over 2 weeks of web logs from the UC Berkeley Group for User Interface Research website (guir.berkeley.edu). Web logs from November 1-16, 2001 were obtained and sessionized, and all sessions from web crawlers were removed. The resulting data set consists of 7700 unique user sessions. Again using a sampling ratio of 0.8, we clustered 30 subsamples of the data set and performed pairwise comparisons of the clusterings, resulting in 435 total trials for each value of k. We varied k from 2 to 15. The initial cluster analysis, illustrated in Figure 3, shows little in the way of discernible trends. There is no readily obvious transition in cluster stability to indicate the optimal structure of the data. One possible interpretation is that the data is actually displaying a lack of structure, and thus a single cluster would be the most appropriate. However, this interpretation does little to improve our understanding of web user activity, and so we instead investigate the data for more subtle trends that may help shed light on the situation.
1 0.9 0.8
cumulative
0.7 0.6 0.5 0.4 0.3 0.2 0.1 0 0.5
0.6
0.7 similarity
0.8
0.9
1
Figure 3 Cumulative similarity distribution for guir.berkeley.edu.
1 0.9 0.8 0.7 0.6 0.5 0.4 0.3 0.2 0.1 0 0.5
0.55
0.6
0.65
0.7
0.75
0.8
0.85
0.9
0.95
Figure 4 Cumulative distribution for guir.berkeley.edu. k = 3 to 7
1
Isolating the distributions for k = 3 to k = 7, shown in Figure 4, more interesting interactions become visible. The distribution for k = 3 (‘O’-points) shows a surprising lack of stability (the closer the curve gravitates toward the bottom right corner of the graph, the more stable the clustering). This stability increases through k = 4 (‘x’-points) and k = 5 (‘+’-points) and then decreases through k = 6 (‘*’-points) and k = 7 (‘ ’-points). Thus the data suggest that, while there might not be much structure to the data set, k = 5 might provide a good high-level description of the data. Looking at the actual session clusters at k = 5, we find three well-defined clusters: one concerning the DENIM Web Design Tool, another focusing on general research and publication pages, and another involving a Quiz-Bowl competition site hosted on the GUIR server. A fourth cluster is centered around computer-supported collaborative work (CSCW), including a CSCW course and a collaborative scheduling project. The fifth cluster is less well defined, consisting mainly of accesses to selected publications on web design practices and the Java documentation pages for the group’s research tools. While this information is useful for characterizing user activity on the GUIR web site, it is certainly less than optimal. Inspecting the clustering results for higher values of k revealed that other, smaller groups emerge. For example the Java documentation will separate into its own cluster(s) at higher values of k and a group encompassing the personal pages for researchers and students eventually surfaces. It is likely that there is no single value of k that captures all the features of site activity an analyst might be interested in while still maintaining a level of generality.
�
5 DISCUSSION In the case studies above, the stability algorithm for choosing the number of clusters shows some promise in the domain of user session clustering. In the first experiment, we were able to directly tease out the correct value for k, but in the second case, we were only able to discern a potential high-level grouping that may or may not make sense. In our experience, there are factors that affect the performance of this method. The web site being analyzed may have a large impact on the success of the method. In applying the stability method for determining the correct the number of clusters, we discovered that the resulting distributions for each value of k were not as well separated as we would have liked, especially when compared to the case studies of Ben-Hur et. al. While unfortunately this can make it difficult to isolate an appropriate value of k for summarizing user activities, this is not particularly surprising. In many websites, the surfing paths for qualitatively different tasks have overlapping segments. Moreover, the pages themselves may have significant content similarities. If a site is poorly designed and/or has a large degree of page overlap, the clustering will be less effective. This, in turn, will cause the stability analysis to perceive a lack of structure in the resulting clusters. Given that user interests and goals are largely subjective, a site design in which many subjectively different tasks share common paths through the site will either not cluster well or cluster in misleading ways. Because of these design issues, the correlation between user sessions could result in clusterings that are not particularly stable. Furthermore, task groupings are inherently hierarchical, impacting the result of the method. We have observed [8] that many web usage data sets display a hierarchical structure of user activities, with higherlevel activities breaking up into more specific tasks as the number of clusters increases. For example, a high-level activity such as product catalog browsing might appear within a clustering, but as the number of clusters increases, the most popular items in the catalog may begin to form their own clusters. What’s interesting about this observation is that each cluster within themselves has different levels of stability. So, for example, the product catalog may be partially split up for some k, while a grouping of job searchers may not have begun to separate at all. The uneven distribution of stability to each cluster will affect the global stability metric in unpredictable ways. Couched as an optimization problem, this means being stuck in a local minimum is more likely when the clusters have different levels of stability. If the stability method was integrated with the clustering algorithm, we may be able to more easily avoid these local minimums. Along these lines, we might adjust our stability criterion to be more responsive to local stability values within a cluster hierarchy. It is often the case within clustering analyses that not all clusters are equally interesting. For example, in our studies we have regularly seen large clusters grouped around a site’s splash page, often with many sessions consisting of only one or two hits. We have also seen clusters populated by many seemingly unrelated sessions, likely representing varying interests that are not expressed in large enough numbers to warrant individual clusters. For many analyses these clusters are of less interest than other, more concentrated groupings indicative of specific surfing behaviors. Thus what might produce
results more useful to a web analyst is a criterion of stability that favors highly stable subtrees of a hierarchical clustering in exchange for a possible drop in global stability. 6 CONCLUSION As web user session clustering techniques gain acceptance as a means for understanding web user activity and goals, it is important that these techniques are made easy and effective for web masters and web analysts to use. Accordingly, automated tools for determining the structure of the clustered data would be of great benefit to those trying to understand user’s interactions with the Web, directing the analyst immediately to the desired level of presentation and allowing web designers to understand the high-level structure of user activities on their site. In this paper, we described the use of a recently proposed technique for determining the structure of clustered data, and coupled it with a web session clustering solution. We found that the technique showed some promise for identifying stable high-level groupings of user activities, but that research over more websites and possibly adjustments to the method are necessary to settle on a satisfying, conclusive result. Applying the method to usage data from www.xerox.com revealed that the method determined the correct number of clusters according to an a priori grouping structure of the data. The results were not so clear on usage data from guir.berkeley.edu, but the stability method still showed some potential for isolating interesting groupings within somewhat unstructured data. As the performance of these methods across a large cross-section of web sites is yet to be determined, we think a hybrid model combining both automated structure determination and human oversight would be the most reliable. To this purpose, we imagine employing a hierarchical clustering algorithm and using the stability method to select varying number of clusters at each level of the cluster tree. By combining this approach with a well-designed user interface for browsing the cluster hierarchy, we believe that we can offer web analysts tools that are both efficient and accurate. Additionally, we plan on carrying out more studies across more sites to better understand the benefits and limitations of user session clustering. The continued success of the Web requires understanding the various user activities being performed and the goals that motivate them. A component of this understanding is determining the structure of the activity being analyzed. Though it is unlikely that a perfect solution can be found, the applications presented here suggest that in many cases the structure of user activity may be inferred automatically, and in those cases that an optimal structure can not be reliably determined, the resulting data can still facilitate the work of human analysts. ACKNOWLEDGMENTS We would like to thank George Karypis for providing an implementation of the Bisecting-Kmeans algorithm and directing us to references on cluster analysis. We are grateful to both the www.xerox.com web development team and the UC Berkeley Group for User Interface Research for sharing their web usage data. We would also like to thank the participants in our evaluations. This work was supported in part by Office of Naval Research grant No. N00014-96-C-0097 to Peter Pirolli and Stuart Card. REFERENCES [1] Banerjee, A. and Ghosh, J. Clickstream Clustering using Weighted Longest Common Subsequences, in Proc. of the Workshop on Web Mining, SIAM Conference on Data Mining (Chicago IL, April 2001), 33-40. [2] Ben-Hur, A., Elisseeff, A., and Guyon, I. A Stability Based Method for Discovering Structure in Clustered Data, in Proceedings of the Pacific Symposium on Biocomputing (PSB2002), January 2002, Kaua’i, HI. [3] Calinski, T. and Harabasz, J. A Dendrite Method for Cluster Analysis. Communications in Statistics, 3:1-27, 1974. [4] Fraley, C. and Raftery, A.E. How many clusters? Which clustering method? Answers via model-based cluster analysis, in Computer Journal, 41:548–588, 1998. [5] Fowlkes, E.B. and Mallows, C.L. A Method for Comparing Two Hierarchical Clusterings, in Journal of the American Statistical Association, 78(383), September 1983. [6] Fu, Y., Sandhu, K., Shih, M. Asho Generalization-Based Approach to Clustering of Web Usage Sessions, in Proc. of WEBKDD 1999 (San Diego CA, August 1999), 21-38.
[7] Hartigan, J. Clustering Algorithms, Wiley, New York (1975). [8] Heer, J. and Chi, E.H. Identification of Web User Traffic Composition using Multi-Modal Clustering and Information Scent, in Proc. of the Workshop on Web Mining, SIAM Conference on Data Mining, April 2001, Chicago, IL. pp. 51-58 [9] Heer, J. and Chi, E.H. Separating the Swarm: Categorization Methods for User Access Sessions on the Web, to appear in Proceedings of ACM CHI 2002 Conference on Human Factors in Computing Systems, ACM Press, April 2002. Minneapolis, MN. [10] Karypis, G. and Han, E. Concept indexing: A fast dimensionality reduction algorithm with applications to document retrieval and categorization. Technical Report TR-00-016, University of Minnesota, 2000. [11] Karypis, G. METIS: Family of Multilevel Partitioning Algorithms. http://wwwusers.cs.umn.edu/~karypis/metis/ [12] Krzanowski, W.J. and Lai, Y.T. A Criterion for Determining the Number of Groups in a Data Set using Sum of Squares Clustering, in Biometrics, 44 (1985), 23-44. [13] Milligan, G.W. and Cooper, M.C. An Examination of Procedures for Determining the Number of Clusters in a Data Set. Psychometrika, 50:159-179, 1985. [14] Pirolli, P. and Pitkow, J.E. Distributions of Surfers' Paths Through the World Wide Web: Empirical Characterization. World Wide Web, 2(1-2), 1999. 29-45. [15] Schuetze, H. and Manning, C. Foundations of Statistical Natural Language Processing. MIT Press, Cambridge MA, 1999. [16] Shahabi, C., Zarkesh, A.M., Adibi, J., and Shah, V. Knowledge Discovery from User’s Web-page Navigation, in Proc. 7th IEEE Intl. Conf. On Research Issues in Data Engineering (1997), 20-29. [17] Smith, S.P. and Dubes, R. Stability of a Hierarchical Clustering, in Pattern Recognition, 12:177-187, 1980. [18] Tibshirani, R., Walther, G., and Hastie, T. Estimating the number of clusters in a dataset via the Gap statistic, in JRSSB (2000). Available at http://www-stat.stanford.edu/~tibs/ftp/gap.pdf. [19] Zaiane, O.R., Xin, M., and Han, J. Discovering Web Access Patterns and Trends by Applying OLAP and Data Mining Technology on Web Logs, in Proc. Advances in Digital Libraries ADL'98 (Santa Barbara CA, April 1998), 19-29. [20] Zhang, T., Ramakrishnan, R., and Livny, M. BIRCH: A New Data Clustering Algorithm and Its Applications. Data Mining and Knowledge Discovery, 1(2), 1997. 141-182. [21] Zhao, Y. and Karypis, G. Criterion Functions for Document Clustering. Technical Report TR-01-40, University of Minnesota, 2001