JOURNAL OF NEUROTRAUMA Volume 19, Number 1, 2002 Mary Ann Liebert, Inc.
Misclassification and Treatment Effect on Primary Outcome Measures in Clinical Trials of Severe Neurotrauma SUNG C. CHOI,1 GUY L. CLIFTON,2 ANTHONY MARMAROU,1,3 and EMMY R. MILLER2
ABSTRACT The power of clinical trials depends mainly on the choice of the primary outcome measure, the statistical test, and the sample size. The most widely used outcome measure has been the five-category Glasgow Outcome Scale (GOS). Contrary to intuition, we show that more categories do not necessarily increase the power of a trial and actually can decrease power. This is so for two reasons. The more categories of outcome measure used, the more the likelihood for misclassifications. The effect of 0%, 10%, and 20% misclassification rate upon power is illustrated. Misclassification rates in two completed trials are examined based on comparative overlap in GOS and Disability Rating Scale (DRS) categories. The outcome results of the “National Acute Brain Injury Study: Hypothermia” indicate that the ideal number of categories also depends upon the effect of study treatment. In the recently completed hypothermia trial, the use of a dichotomized GOS (good recovery/moderate disability versus severe disability/vegetative/dead) is shown to be more sensitive than use of three or more categories of the GOS. The results point to the importance of training study investigators who will collect the outcome data. The results also indicate that the number of categories should be carefully determined using the pilot data or the data from phase II trials. Key words: clinical trials; interobserver variability; misclassifications; number of outcome categories; power; primary outcome measures severe disability (SD), vegetative (V), and dead (D). Some investigators have advocated the use of the Disability Rating Scales (DRS) or the Functional Independence Measure (FIM; Gouvier et al., 1987; Hall et al., 1992, 1993). For a categorical outcome measure, two adjacent categories could be combined into one category or one outcome category can be divided into two or more categories. The possible number of categories based on the GOS ranges from two to five. The number of categories in the GOS can be further increased as in the Extended
INTRODUCTION
T
of many clinical trials, including trials of neurotrauma, depends among other factors on the choice of the primary outcome measure. For clinical trials of severe head injury, although many outcome measures have been proposed, the most widely used primary outcome measure has been the Glasgow Outcome Scale (GOS). The GOS is an example of a categorical outcome measure. It is made up of five categories: good recovery (GR), moderate disability (MD), HE SENSITIVITY AND POWER
1 Department
of Biostatistics, Medical College of Virginia, Virginia Commonwealth University, Richmond, Virginia. of Neurosurgery, University of Texas Health Sciences Center, Houston, Texas. 3 Division of Neurosurgery, Medical College of Virginia, Virginia Commonwealth University, Richmond, Virginia. 2 Department
17
CHOI ET AL. GOS (GOSE) with eight categories. For many trials in the recent years conducted on both sides of the Atlantic, the five category GOS has been dichotomized into Good (GR/MD) and Poor (SD/V/D) outcomes. It would seem that the power and sensitivity would increase with the increasing number of categories. We found the opposite in the recently completed hypothermia trial and investigated the outcome from two trials to determine the reasons that fewer categories could yield more power.
the GOS was examined using the Wilcoxon Rank-Sum Test, which is appropriate for testing categorical outcome measures (e.g., Lehmann, 1975). It is noted that the Wilcoxan Rank-Sum Test is equivalent to the simple x2 test in case of dichotomized categories. Box plots of the DRS were used to compare apparent quality of the data and possible misclassifications in the “National Acute Brain Injury Study: Hypothermia” and the study designated as trial A (Choi et al., 1998). A box plot was constructed by drawing a box between the lower and upper quartiles with a line drawn within the box to indicate the median. Thus, the box contains the middle 50% of the values. Two straight lines are then drawn connecting the box to the largest value and the smallest value of the data. The side-by-side box plots are effective way to compare the distribution of the data from two or more trials.
MATERIALS AND METHODS The term “misclassification” can be defined as incorrect categorization of subjects. The definition inherently assumes that there is a gold standard for correct classification. Of course, this is not the case in case of outcome measures, such as GOS or DRS, proposed for severe head trauma. For this reason, many investigators use the term “interobserver variability” instead of misclassification. Although the two terms are directly related, we prefer to use the term “misclassification” in this paper to simply facilitate the statistical discussion. For misclassifications of patients, it was assumed that patients in two adjacent outcome categories had an equal and random chance of being misclassified. That is, for example, we assumed that a patient with good recovery (GR) and a patient with moderate disability (MD) had the same chance of being misclassified to MD and GR, respectively. The data used to illustrate the effect of misclassification and treatment include the results of the recently conducted hypothermia study in the United States (Clifton et al., 2001). In the trial, 392 patients aged 16–65 years with severe head trauma were randomized into hypothermia at 33°C for 48 h or normothermia following the Guideline for Management of Severe Brain Injury (Bullock et al., 2000). The primary outcome measure was the dichotomized GOS at 6 months postinjury. The power and sensitivity of using different number of categories of TABLE 1. EFFECT
OF
RESULTS Effect of Misclassifications Table 1 presents hypothetical clinical trial outcomes without misclassification, with 10% misclassification, and with 20% misclassification using the dichotomized GOS (GR/ MD versus SD/V/D). For the treatment group, 10% misclassification would misclassify 19 patients (i.e., 19 out of 190) with good outcomes as poor outcomes, while 21 patients (i.e., 21 out of 210) with poor outcomes would be misclassified to the good outcome category. Most likely, this exchange would occur between the “upper levels of severe” and “lower levels of moderate.” Consequently, the observed results would be 192 patients (190 2 19 1 21 5 192) in the treatment group with good outcomes. Similarly, in the control group the observed number of good outcomes would increase from 160 to 168 (160 2 16 1 24 5 168). Thus, without misclassification, the difference in good outcomes between the treatment and control is 7.5% (47.5–40.0%), whereas the difference with misclassification is 6% (48–42%). If the misclassification rate increases to 20%, the difference can
MISCLASSIFICATIONS Without misclassification
Group Treatment Control Difference (%) a (190/400) 2
n 400 400
Good
IN
D ICHOTOMOUS OUTCOMES : EXAMPLE With 10% misclassification
Poor
190 210 160 240 7.5a (p 5 0.039)
Good
Poor
192 208 168 232 6.0 (p 5 0.102)
(160/400) 5 0.075.
18
With 20% misclassification Good
Poor
194 206 176 224 4.5 (p 5 0.228)
OUTCOME MEASURES IN CLINICAL TRIALS OF NEUROTRAUMA TABLE 2. EFFECT
OF
MISCLASSIFICATIONS
IN
TRICHOTOMOUS O UTCOMES : EXAMPLE
Without misclassification
With 10% misclassification
Group
Best
Middle
Poor
n
Best
Treatment Control Difference
180 149
70 80
150 171
400 400
169 142
p 5 0.041
be easily shown to be 4.5%. The difference without misclassification is significant (p 5 0.039), while the difference with 10% misclassification is not (p 5 0.102). When the misclassification rate is 20%, the p value is 0.228. Next, consider expected scenarios when the outcome measure consists of three categories. It is assumed that 400 patients each were randomized to treatment and control groups. The possible effect of misclassifications for trichotomous outcomes is illustrated in Table 2. Three categories are represented by “best,” “middle,” and “poor.” The 10% misclassification, for example, would mean 18 of 180 patients in the treatment group with the best outcome would be misclassified as the middle outcome. Likewise, 7 patients out of 70 with the middle outcome would be misclassified to the best outcome. Hence, the number of patients with the best outcome in the treatment group would be reduced from 180 to 169 (180 2 18 1 7 5 169). The number of patients in the middle outcome in the treatment group would be reduced by 7 patients each to the best and poor outcome categories while gaining 18 from the best and 15 from the poor outcome categories. Hence, the observed number of patients in the middle outcome category in the treatment group becomes 89 (70 2 14 1 18 1 15 5 89). The observed number of patients based on similar computations for all other categories for both treatment and control groups is summarized in Table 2. The differences between the two groups
Middle 89 96 p 5 0.058
Poor
n
142 162
400 400
without misclassification would be significant (p 5 0.041), but not significant with 10% misclassification (p 5 0.058). The number of misclassified patients would expect to increase with the number of categories. For example, if good outcomes in the GOS are divided to GR and MD, misclassifications between the two categories could affect the difference whereas the difference would have no effect when the two are combined. Further, as illustrated in Table 1, the difference decreases with an increasing misclassification rate. Therefore,the power of a test would decrease as the misclassification rate increases.
Effect of Treatment The ideal number of categories depends on the effect of treatment as illustrated by data from the hypothermia trial. The primary outcome measure in the study was the dichotomous GOS at 6 months postinjury. Outcomes were obtained for 385 patients. There were no differences between the two study groups: 57% of patients in both hypothermia and normothermic groups had poor outcome. However, there was a subgroup in which the data indicated that hypothermia might be beneficial. The subgroup consisted of 81 patients with age # 45 years and admission temperature #35°C. In the subgroup, 52% of those in the hypothermia group had poor outcomes as compared with 76% in the normothermia group. The dif-
TABLE 3. EFFECT OF HYPOTHERMIA IN SUBGROUP (AGE # 45 AND ADMISSION TEMPERATURE # 35°C; n 5 81 Outcome measures
p value
Dichotomous GOS (good, poor)a Trichotomous GOS [(GR and MD), SD, (V and D)]b Four-category GOS [GR, MD, SD, (V and D)] Five-category GOS DRS
0.031 0.103 0.188 0.176 0.196
aPercentages of poor outcomes were hypothermia 52.0% and normothermia 75.8%. b GR (good recovery), MD (moderate disability), SD (severe disability), V (vegetated), and D (death).
19
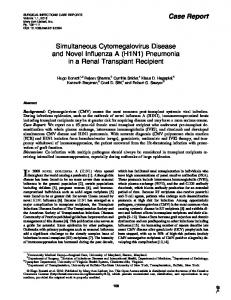
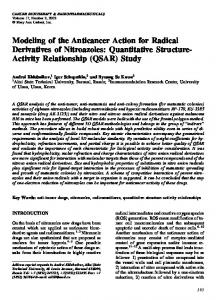
CHOI ET AL. ference adjusted for age and Glasgow Coma Score as covariables was significant at p , 0.02. It might seem that the difference would be even more significant (i.e., smaller p values) if more categories were used instead only two in the analysis. The same Wilcoxon rank-sum test without covariables was applied to two-, three-, four-, and five-category GOS. The three categories were defined by combining GR and MD as the first group and combining V and D as the third group. The four category GOS were defined by combining only V and D as the fourth category. The test was also applied to the DRS data. The test results comparing the two study treatment groups are presented in Table 3. The results showed that the power was highest for the differences using the dichotomous outcomes and became less powerful as the number of categories in the GOS increased. It was surprising to see that the test was least powerful for the DRS. The results were unexpected. We examined the distribution of the five category GOS in the subgroup. The results indicated that apart from a small insignificant effect in reducing mortality, the primary effect of hypothermia was improving a large proportion of SD patients to MD category (Fig. 1). Therefore, the other three categories (GR, V, and D) were just statistical noise in the analysis. The noise level probably was higher in the DRS in the analysis of this particular subgroup of patients. Note that the DRS is made up of the sum of scores in several subcategories, each subject to interobserver variability, so that the misclassification rate becomes additive. The box plots of the DRS for the hypothermia trial and another trial of severe brain injury (Choi et al., 1998) conducted several years ago are presented in Figure 2. Note that overlaps in the DRS among the five GOS are less
FIG. 1. Outcome distribution (GOS) of hypothermia and normothermia treatment at 6 months postinjury for a subgroup defined by patients with age # 45 and the admission temperature # 35°C.
20
FIG. 2. Side-by-side box plots of the Disability Rating Scales for the hypothermria trial and trial A.
pronounced in the hypothermia data than in the other trial. In particular, there was no overlap between V and SD in the hypothermia study but considerable overlap in the other trial. A significant overlap for the two categories is illogical. In addition, the overlap in the DRS between GR and SD in the hypothermia data is much less than that in the other study. Among GR, MD, and SD, one would expect some overlap among categories because DRS, unlike GOS, include some other measures such as the communication ability, toileting, and feeding. However, the comparison of the degree of overlap in the DRS in the two studies, suggests differences in the misclassification rate between the two studies.
DISCUSSION Outcome categories of the widely used GOS or GOSE are described in detail. Nevertheless, the outcome of each patient is often determined by an individual investigator based on his or her observations and impression rather than precise scientific measurement tools. Consequently, misclassifications of patients in clinical trials using categorical outcome measures are unavoidable even in a very carefully conducted study. The patients whose outcomes lie in the proximity of the borderline of the two adjacent categories are more likely to be misclassified. In case of the GOS, for example, our experience suggests that misclassifications are more pronounced between GR and MD, followed by MD and SD. The misclassification between SD and V is rare. It was stated that interobserver variability is directly related to misclassifications. Although the exact misclassification rate cannot be determined in practice, it can be estimated. Suppose R denotes a disagreement rate of two observers in a study. For the outcome, in which the two disagreed, at least one observer must be incorrect.
OUTCOME MEASURES IN CLINICAL TRIALS OF NEUROTRAUMA Therefore, the misclassification rate can be approximated by R, although, to be precise, it is $R since both observers could be wrong. Clearly, misclassification rate depends not only on investigators but also on the interview method used. Misclassification and interobserver variability of patients with severe head trauma were studied by several investigators (e.g., Maas et al., 1983; Anderson et al., 1993, Wilson et al., 1998, Marmarou et al., 2001). Wilson et al., (1998), in particular, proposed a structured approach for the GOS in order to reduce the interobserver variability. Although such an approach could significantly reduce misclassification, it is not likely to eliminate it completely. Marmarou et al. (2001) estimated that the misclassification rate for the five-category GOS was 31%. A simple structured check list used in outcome assessment decreased the rate to 18%. In any event, the result of the study presented here indicates that any reduction in misclassification is important for increasing the power of the trial. The hypothetical examples demonstrate that misclassifications can dramatically reduce the differences in outcomes between two study groups and the power of the trial. That is, whether the treatment is better or worse than the control, observed differences would likely to be less than the true differences. The implication is that when the true effect of treatment is just significant at p 5 0.05 level then the observed differences would be no longer significant due to the effect of misclassifications. Increasing number of categories would increase the misclassification rate. For example, the misclassification rate using the widely used dichotomous GOS would be less than that using three or more categories. It should be remarked that in the illustration, it was assumed that patients in adjacent categories have an equal and random chance of being misclassified. In practice, of course, misclassification rate may not be equal. For example, some investigators are more likely to misclassify MD patients to GR rather than the other way around. In fact, the study by Marmarou et al. (2001) suggested that observers tend to rate patients at better GOS categories than indicated by the information. The only consequence on the power would be an even larger or smaller reduction than when the misclassification is symmetric. The point is that misclassifications are likely to reduce the power. It is important to point out that the effect of interobserver variability is likely to be different between treatment and control groups. First, the number of patients misclassified would depend on outcome distributions of the two study groups. Thus, the more the treatment group differs from the control, the greater the number of patients affected by misclassification. Second, the pattern of treatment effect on the shape of the outcome distrib-
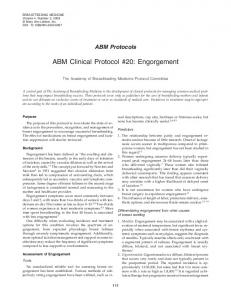
utions is also relevant, as misclassification depends on the distribution. Therefore, it cannot be assumed that the study is unbiased even when the interobserver variability is similar in both treatment and control groups in a trial It may be possible to enhance inter-observer consistency and reduce misclassifications (Fig. 2). Reducing the number of categories and intensive training of investigators responsible for collecting outcome data are two means of reducing misclassification. In the hypothermia trial, for example, all investigators responsible for the outcome data were rigorously trained in a workshop including the use of a structured interview. In addition, the data were audited monthly and about 5% of assessment interviews conducted at each center were observed by the Data Monitor of the trial. In trial A, in contrast, the training of investigators was considered adequate, but the outcome data were not monitored centrally. A simple factor, which determines the optimum number of categories, is the effect of treatment. If the effect of study treatment is restricted to only two categories, increasing the number of categories in the outcome measure could actually decrease the power. As illustrated, if the treatment effect were only in MD and SD categories in the GOS, then the best outcome measure would be dichotomous GOS, dichotomizing between MD and SD. On the other hand, if the treatment effect were in more than two outcome categories, then using more categories could yield more power. For example, in stead of the outcome distribution shown in Figure 1, suppose a new treatment affects all five categories as depicted in Figure 3. In this case, the GOS based on four or five categories could yield a greater power than the dichotomous GOS would. It may be conjectured that the optimum number of categories is more or less equal to the number of out-
FIG. 3. Hypothetical outcome distribution when four or five categories could provide greater power than two categories.
21
CHOI ET AL. come categories affected by the treatment. The question is how to determine the number of categories that are likely to be affected by the treatment. We believe that the answer lies in the results of phase II trials. Investigators need to examine the results of phase II trials to determine the effect of the study treatment. As illustrated, for the subgroup in the hypothermia study, the dichotomous GOS can be a better primary outcome measure than the five-category GOS in terms of the power at 6 months. That does not mean the dichotomous GOS is always better. For example, significant proportions of MD and SD patients are likely to improve to GR and MD, respectively, from 6 to 12 months (Choi et al., 1994). Thus, the dichotomous GOS may not necessarily provide more power at 12 months postinjury. It should be also noted that the five-category GOS and other measures such as the DRS are clearly more informative than the dichotomous GOS for purposes other than the power of the trial. It should be noted that the subgroup used in our illustration was not defined a priori, nor were patients stratified by the admission temperature and age. Therefore, the significant hypothermia effect based on the post-hoc test for this subgroup lacks credibility, and a new trial is needed to confirm the benefit of hypothermia in the subgroup. We conclude that it would be naive to say that one primary outcome measure is superior to another measure or that a measure with more categories is better than one with fewer categories. It all depends on the effect of the study treatment and the misclassification rate among other factors.
CHOI, S.C., MARMAROU, A., and BULLOCK, R. (1998). Primary endpoints in phase III clinical trials of severe head trauma: DRS versus GOS. J. Neurotrauma 15, 771–776. ClLIFTON, G.L., MILLER, E.R., CHOI, S.C, et al. (2001). Lack of effect of hypothermia in acute brain injury. N. Engl. J. Med. 344, 556–563. GOUVIER, W.D., BLANTON, P.D., LA PONTE, K.K., et al. (1987). Reliability and validity of the Disability Rating Scale and the level of cognitive functioning scale in monitoring recovery from severe head injury. Arch. Phys. Med. Rehabil. 68, 94–97. HALL, K.M. (1992). Overview of functional assessment scales in brain injury rehabilitation. NeroRehabil. 2, 98–113. HALL, K., COPE, D.N., and RAPPAPORT, M. (1985). Glasgow Outcome Scale and Disability Rating Scale: comparative usefulness in following recovery in traumatic head injury. Arch. Phys. Med. Rehabil. 66, 35–37. JENNET, B., and BOND, M. (1975). Assesment of outcome after severe brain injury. Lancet 75, 480–484. LEHMAN, E.L. (1976). Nonparametrics: Statistical Methods Based on Ranks. Holden-Day: San Francisco. MAAS, A.I.R., BRAAKMAN, R., SCH0UTEN, H.J.A., et al. (1983). Agreement between physicians and assessment of outcome following severe head injury. J. Neurosurg. 58, 321–325. MARMAROU, A. (2001). The American Brain Injury Consortium, in: Head Trauma: Basic, Preclinical, Clinical Direction. L. Miller and R. Hayes (eds), Wiley: New York, pps. 371-–384. WILSON, J.T.L., PETTIGREW, L.E.L, and TEASDALE, G.M. (1998). Structured interviews for the Glasgow Outcome Scale and the Extended Glasgow Outcome Scale: guidelines for their use. J. Neurotrauma 15, 573–580.
REFERENCES
Address reprint requests to: Sung C. Choi, Ph.D. Department of Biostatistics Medical College of Virginia Virginia Commonwealth University Box 980032 Richmond, VA 23298-0032
ANDERSON, S.I,, HOUSLEY, A.M., JONES, P.A., et al. (1993). Glasgow Outcome Scale: an inter-rater reliability study. Brain Inj. 7, 309–317. BULLOCK, R., CHESTNUT, R.M., CLIFTON, G.L., et al. (2000). Guideline for the management of severe head injury. J. Neurotruama 17, 451–549. CHOI, S.C., BARNES, Y.T., BULLOCK, R., et al. (1994). Temporal profile of outcomes in severe head injury. J. Neurosurg. 81, 169–173.
E-mail:
[email protected]
22