The incidence of misconceptions of decimal notation ... multiple choice list of five decimals (data held at the Australian Council for ..... common amongst adults.
The incidence of misconceptions of decimal notation amongst students in Grades 5 to 10. Vicki Steinle and Kaye Stacey University of Melbourne This paper reports the results of a test of decimal understanding based on choosing the larger number from pairs of decimals. Ten incorrect ways of thinking about decimal notation are described. The testing of 2517 students from Grade 5 to Year 10 enables reporting of the incidence of misconceptions according to both a primary and a refined classification. Some variations from previously reported results are noted.
It is now well documented that many students throughout schooling and indeed many adults have difficulty understanding the notation used for decimal fractions. The recent Third International Mathematics and Science Study showed that internationally about a half of 13 year old students could select the smallest decimal number from a multiple choice list of five decimals (data held at the Australian Council for Educational Research). Similar results have been known for many years in several countries (Bell, Costello and Kuchemann, 1983; Carpenter, Corbitt, Kepner, Lindquist and Reys, 1981). There are various ways of classifying the erroneous rules which students may apply when deciding which of two decimals is the larger. The coarsest classification is that some students select “longer is larger” (e.g., deciding 0.125 is larger than 0.3) whilst others select “shorter is larger” (e.g., deciding 0.3 is larger than 0.496). SackurGrisvard & Leonard (1985), Nesher and Peled (1986) and Resnick, Nesher, Leonard, Magone, Omanson and Peled (1989) refined this classification to three erroneous rules. Sackur-Grisvard and Leonard (1985) had identified erroneous rule use principally from a test where students had to place three decimals in order of size. Resnick et al (1989) modified this to comparison of size of pairs of decimals, and in some cases of a vulgar fraction and a decimal. Moloney and Stacey (1996, 1997) modified the Resnick et al test to exclude fractions as these seemed to cause extraneous problems. Stacey and Steinle (1998) reported on interview data and an item by item analysis of an extended test of 25 decimal pair comparisons which lead to identifying further misconceptions about decimal notation. In total, ten patterns of thinking were identified. In the first section of this paper, we outline these patterns of thinking. Then we describe a new decimal comparison test which will classify students according to this new scheme. The distribution of a sample of students from Grade 5 to 10 according to this classification is presented. An indication of the variability of students’ thinking patterns by school is presented which provides preliminary evidence that sometimes students misconceptions about decimals are a direct result of instruction. In other cases, misconceptions arise when ideas interfere with each other. Thinking About The Size Of Decimal Numbers. Stacey and Steinle (1998) used interview and test data to identify the following possible ways of thinking about decimal notation. The numbers of students found to be using each of these are reported in a later section. The detailed types of thinking have been grouped according to a coarse primary classification of students who make choices based on length (longer-is-larger and shorter-is-larger) compared with those who make more sensible choices.
Longer-is-larger Misconceptions Students in this primary misconception category generally believe that a longer decimal is larger than a shorter decimal. It includes both “whole number rule” and “zero rule” as described by Resnick et al (1989). String length thinking: These students judge only on length, effectively treating the decimal part as a whole number. They interpret the decimal as two whole numbers separated by a marker, with longer numbers being larger. Hence, they choose 4.63 as larger than 4.8 because it is longer and likewise 4.03 as larger than 4.3. This judgement is based on the successful strategy for whole numbers, where zeros contribute both to the length and size of a number. Numerator focussed thinking: This is similar behaviour to String length thinking with one variation. Just as the whole number 38 is not changed by the addition of a preceding zero (038), the zeros after the decimal point are likewise disregarded. Hence, 6.3 and 6.03 would be seen as the same number; 6 wholes and 3 more parts. The disregarding of the size of the parts (first tenths and then hundredths in the above numbers) and concentration on the number of parts (here 3) has suggested the name for this type of thinker. Reverse thinking: A student who has not heard the th in the place value names (or who has heard it but disregards it as it has no meaning for them) may believe that the decimal columns represent more whole numbers but written in the reverse order: i.e., (point) tens, hundreds, thousands etc. Evidence for this confusion was obtained in an interview with Val in Grade 5. When asked to read 0.163 from a card she replied “one hundred and sixty three....because when we do that in class we had a tens column and a hundreds column and a thousands column....I’m not sure if its just one hundred and sixty three or its 1 ten, 6 hundreds and 3 thousands”. Zero makes small thinking: This is a slight improvement on the Numerator focussed thinking above. The extra information these students have learnt is that a decimal with a zero or zeros in the first column(s) after the point is “small” and so they are able to make a correct decision on the comparison test for items like 4.08 and 4.5. Otherwise, they choose the longer decimal as larger. This is one thinking pattern behind the “zero rule” of Resnick et al (1989). Right hand overflow thinking: This thinking pattern also results in “zero rule” behaviour of Resnick et al (1989). These students have created their own decimal version of column overflow. Whilst overflow to the left occurs in whole numbers, for example 120 is 12 tens, such students think 0.12 is twelve tenths . In effect the number 12 is being squashed into the tenths column. Similarly, both 0.06 and 0.067 would be read as hundredths, first 6 then 67. Note that Right hand overflow thinkers cannot be reliably distinguished from Zero makes small thinkers by a decimal comparison test. Shorter-is-larger Misconceptions Denominator focussed thinking: These students have been identified by previous researchers (eg Resnick et al). They use the place value column names to decide on the size of the decimals. They know that one tenth is larger than one hundredth and they incorrectly generalise that any number of tenths is greater than any number of hundredths. While they may or may not have an image of the equivalent fraction, the consideration of the size of the parts (in isolation) has determined their choice and is reflected in the name of this group. As they demonstrate reasonable understanding of place value names and make sensible decisions with decimals of equal length, it would be easy for their wrong thinking to go undetected in the classroom. Reciprocal thinking: These students have attempted to connect decimals with fractions but have difficulty as the decimal form does not explicitly indicate the denominator.
Hence, when faced with the notation 0.3 they perceive that there are 3 parts rather than 10 equal parts of which 3 are chosen. For such thinkers 0.3 is larger than 0.4 as 1/3 is larger than 1/4, whether they actually write these symbols or not. Evidence for confusion between decimals and reciprocals was obtained in the interviews when Jack (a tertiary student) discussed how he had been thinking. He explained that just as “1 over 25 a fraction is a smaller number than 1 over 5”. When he saw “oh point large number I immediately assumed in the same way that 1 over 25 is smaller ..thus that decimal was in fact smaller”. Negative thinking: These students are confusing notation for decimals with that for negative numbers. Amanda, a tertiary student, incorrectly compared 0.35 / 0.20 and then wrote: “I was thinking along a number line and considering decimal numbers to be equivalent to negative numbers. Therefore -20 was larger than -35”. This leads to the same behaviour as Reciprocal thinkers on all the decimal comparison tests. Comparison items with one of the numbers being zero are required to separate them. Apparent-expert Behaviour Students who are able to correctly compare most pairs of decimals are grouped together here. Some of them are indeed experts, having a solid understanding of decimal notation. Others may not have a good understanding, but correctly follow rules to order decimals. For example, they may annexe zeros on the shorter decimal and then compare the resulting integers after the decimal point, or they may follow the procedure of comparing digits from left to right but have little understanding why this rule works. A written test cannot distinguish between these various forms of thinking, but it may be straightforward in an interview situation. In order to stress that students who do well may not have a good understanding of decimal notation, we use the term Task expert, rather than expert, to describe those who answer all types of questions correctly. Item-by-item analysis of the decimal comparison test by Stacey and Steinle (1998) uncovered other groups of students who could generally compare decimals but who had very little appreciation of the place value basis of decimals. Truncation thinking (2dp): Students (and adults) who think this way may use the contexts of money or length (m, cm) in order to make sense of decimal notation. Hence they focus on the first two decimal places and ignore the rest of decimal number. Rather than understand that they are actually making an approximation, sensible as it may be, they have no idea what these extra digits mean. So 15.348 may be seen as $15 and 34c or 15m and 34 cm; the 8 is some error or variation but they are unclear of what effect it has on the size of the number. Just as a sequence of house numbers can be written as 134, 135A, 135B, 137... it is understood that there is more than one house at 135, but ordering 135 and 135B may be difficult. Nancy, a university student, wrote about her uncertainty on some items of the decimal comparison test. Some items presented no difficulty (eg 4.08 / 4.7 became $4.08c / $4.70c) but “when the numbers are same (eg 4.4502 / 4.45) in the same spot I get very confused...Does the number get bigger or smaller with more numbers on the end?” Rounding thinking (2dp): This is an improvement on truncation thinking as the size of the discarded digit is taken into account. So, 15.348 would be interpreted as analogous to $15 and 35c or 15m and 35 cm. Again, the additional digits after two places (or sometimes 1) have little or no meaning to such a student. While this is a sensible approach to quoting a result after a calculation is made, it demonstrates that the underlying decimal notation is not understood. Students who think like this (Truncate/Round) may appear, in the classroom, to be experts. We have seen evidence of students who truncate to only one decimal place but truncation to two decimal places (probably deriving from money analogies) is more common.
Unclassified behaviour Some students consistently use one interpretation of decimals, thereby being readily classified by a test using simple items such as decimal pair comparison. Other students may not have any of the above mentioned thinking patterns. Still others will have a mixture of several of these ideas, which they use inconsistently. Such students are labelled as Unclassified. There is some evidence (Moloney and Stacey, 1997) that students who are beginning to develop more sophisticated ideas about decimals will answer most inconsistently. The description of patterns of interpreting decimal notation above is extensive, but not comprehensive. For example, there are further combinations of these patterns possible. In the rest of this paper, we examine which of the categories above can be easily identified in school populations. Method, Data and Procedures Development of the new test In order to find the incidence of the misconceptions and thinking patterns described above, a new decimal comparison test consisting of 30 items was developed. As in previous tests, each item presents a pair of decimal numbers with the instruction to select the larger. Even with 30 items, the practical limit of such a test for children, some categories of decimals (e.g., those with final zeros, decimals with same integer part) are not adequately represented. The decimal comparison items are in six groups of comparison items. The first two groups are used for the primary classification as shown in Table 1. In Group I test items, the five decimal comparisons have been selected so that the shorter decimal is the larger. For ease of reference, the larger decimal is listed first throughout this paper, although they are randomly presented in the test. As shown in the table, students using one of the Longer-is-larger misconceptions (String length, Numerator focussed, Reverse, Right hand overflow or Zero makes small) will score poorly on this group of items, whereas those using one of the Shorter-islarger misconceptions (Denominator focussed, Reciprocal or Negative) will score well. Apparent-expert students (Truncate, Round or Task expert) will also score well. The five items in Group II have been selected so that the longer decimal is the larger, and the responses by the three primary classifications are listed in the table; only the students using one of the Shorter-is-larger misconceptions will have difficulty here. Low and High indicate performance within each group of items; Low indicates at most 1 correct while High indicates at most 1 incorrect. Hence, students were allowed to make one deviation from their expected responses within each group and still be classified. Students not following any of these patterns are unclassified. Hence, a medium score of 2 or 3 out of 5 in either of the two groups of items will result in a student being unclassified, as will the score of Low in both groups. Table 1: Definition of Primary Classification Group I Group II Primary classification 5 items 5 items eg 4.8 / 4.63 eg 5.736 / 5.62 Longer-is-larger misconceptions Low High Shorter-is-larger misconceptions High Low Apparent-expert behaviour High High Unclassified Any Medium, or combination of Low and Low Once the primary classification has been made, the results of the next four groups of decimal comparisons are considered. For example, a student using String length
thinking will have exhibited Longer-is-larger behaviour and would then (see Table 2) score Low in Group III, and High in Groups IV, V and VI. It can now be seen that it is not possible, using these six groups of decimal comparisons, to distinguish between some of the thinking patterns. For example, Right hand overflow and Zero makes small thinking cannot be separated; the same is true of Reciprocal and Negative thinking (this would need a comparison of a decimal with zero, an item that has not been included). As String length and Numerator focussed thinking present the same responses to the six groups of test items, an additional item (0.53 / 0.006) has been included. Ideally, there would be at least three such items in a group, in order that a student’s way of thinking is not determined by their choice on a single item, but space limitations prevented this. Table 2: Definition of Refined Classification Group III Group IV Group V Group VI Refined Classification of thinking 4 items 4 items 3 items 3 items eg 4.7/4.08 4.4502/4.45 0.4/0.3 0.42/0.35 Longer-is-larger misconceptions: String length (*) Low High High High Numerator focussed (*) Low High High High Reverse Low High High Low Right hand overflow High High High High Zero makes small High High High High Shorter-is-larger misconceptions: Denominator focussed High Low High High Reciprocal High Low Low Low Negative High Low Low Low Apparent-expert behaviour: Truncate/Round (guess shorter) High Low High High Truncate/Round (guess longer) High High High High Expert (various understandings) High High High High (*) These two ways of thinking are split using one additional item Data collection and method The 30 question test was given to 2517 students at 6 primary and 7 secondary schools across Melbourne during 1997. Table 3 shows the number of students tested at each year level. The items were presented in their groups, with some extra items at the beginning of the test. These ‘warm-up’ items were included because the results of our last data analysis (Stacey & Steinle, 1998) suggested that the earliest items were more likely to be answered inconsistently. The test was presented to all students on a single sheet with the larger decimal in each pair to be circled. Our previous investigation showed that this was a good arrangement to maximise the chances that students would respond in a consistent manner. Students were classified using the scheme shown in Tables 1 and 2. Table 3: Numbers of students tested at each year level. Year level 5 6 7 8 Number of students
294
319
814
457
9
10
Total
350
283
2517
Results and Discussion Table 4 shows the resulting distribution of students across the whole sample. The three primary classifications account for about 85% of the students. It is surprising to see the identical numbers (13.1% each) within the two length-based misconceptions.
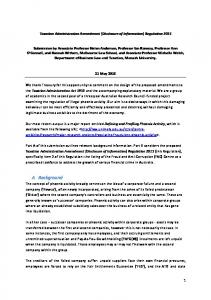
We believe this is an accident of the age composition of the sample (see Table 3 and Figure 1). Most of the students in the Longer-is-larger misconception category (11.1% out of 13.1%) were able to be further classified, as were 9.5% out of 13.1% in the Shorter-is-larger misconception category, and 54.1% out of 58.2% in the Apparentexpert behaviour category. This is evidence that the identified thinking patterns explain most students’ behaviour. Table 4: Results of Primary and Refined Classifications Primary and Refined Classifications Number Percentage Longer-is-larger (including) 329 13.1% String length 48 1.9% Numerator focussed 156 6.2% RH overflow / Zero makes small 69 2.7% Reverse 7 0.3% Shorter-is-larger (including) 329 13.1% Denominator focussed 72 2.9% Reciprocal / Negative 167 6.6% Apparent-expert (including) 1464 58.2% Task expert 1269 50.4% Truncate /Round(shorter) 94 3.7% Unclassified 395 15.7% TOTAL 2517 100.1% The refined classification shows that String length and Numerator focussed thinking dominate the Longer-is-larger misconception as suggested by earlier studies. An additional item in the test (0.53/0.006) allows the separation of the String length thinking and Numerator focussed thinking. This gives an estimate of one student using String length thinking to every three using Numerator Focussed thinking. The number of students showing Right hand overflow or Zero makes small thinking is about 3%. This is consistent with the proportion reported by Moloney and Stacey (1997). Identifying students demonstrating Reverse thinking has not been attempted before. The number of students in this category is rather small, and somewhat disappointing as the Group VI items were included specifically to detect this way of thinking. This thinking has been voiced in one of a small number of interviews with Grade 5/6 students and elsewhere. It is still possible that there are more students who think in this way (or with a variation of it) but the decimal comparison test format does not elicit this response. Just as interviews with task experts showed that the students may have other conflicting ideas, the procedures taught for ordering decimals may override students “reverse” ideas when they are faced with this task. The results for the Shorter-is-larger misconception category are unexpected; the number of students using Reciprocal/Negative thinking is twice that of the Denominator focussed thinking. Earlier authors have assumed that Denominator focussed thinking was the main reason for Shorter-is-larger misconceptions. The possibility of Reciprocal or Negative thinking was not investigated previously because items where the decimal pairs are of equal length have not been included in earlier studies. This finding will alter the priorities for assistance to students in the Shorter-is-larger category. Within the Apparent-expert behaviour category about 4% of the overall sample were classified as using Truncate/Round (shorter) thinking. These students have been identified by their incorrect choices to the Group IV items. The existence of this thinking was identified by Stacey and Steinle (1998) but without any idea of the number of students involved. Such thinking will be hard to detect in the classroom as the student will make sensible decisions on almost every occasion; only when the decimals involved start with the same digits (eg 0.56 and 0.561) will their understanding show up to be inadequate. Interviews with such students suggests their understanding of decimal notation is quite superficial. They are in fact using a system of two whole numbers
separated by a dot, appreciating that the largest 2-digit number after the dot is 99. Because students using this thinking can only guess the answers to the four Group IV items, the number using such thinking may actually be about twice this size, the rest of the Truncate/Round thinkers happening to guess the correct (longer) answer and hence fall into the Task expert group. In a group of 40 tertiary graduate students (non-maths majors) who completed the comparison test, four students expressed difficulty on the Group IV items, suggesting that this way of thinking about decimals may be even more common amongst adults. 100% 80%
0%
Longer-is-larger Yr10
Shorter-is-larger
Yr 9
20%
Yr 8
Other
Yr 7
40%
Gr 6
Task expert
Gr 5
60%
Year level
Figure 1: Distribution of classification by grade/year level The distribution of the primary classifications within each grade/year level is presented graphically in Figure 1. The results confirm the age distribution reported by Moloney and Stacey (1997). The Longer-is-larger category decreases from Grade 5 to Year 10, the trend suggesting that it is unlikely to be common in adult life. The Shorteris-larger category plateaus at about 10% which suggests that this general belief may continue into adulthood. The percentage of Task experts also plateaus to about 60% in Year 10, which suggests that there are many adults as well as students who have difficulty understanding decimal notation. Table 5: Average percentage of students by grade/year level and by classification Longer-is-larger Shorter-is-larger Task expert misconceptions misconceptions min% av% max% min% av% max% min% av% max% Gr 5 14 32 52 7 15 30 9 23 30 Gr 6 7 17 48 0 12 37 0 52 82 Yr 7 2 13 21 2 14 28 31 54 85 Yr 8 1 9 23 12 16 18 30 49 70 Yr 9 5 6 7 6 10 14 54 58 63 Yr 10 4 5 10 8 11 14 52 58 69 Table 5 gives the average percentage of each grade/year level who are Longer-islarger, Shorter-is-larger or Task experts. The table also gives the maximum and minimum percentage of students in a given category at any school. For example, the percentage of all the Grade 5 students in the sample choosing the shorter decimal as the larger is 15%, but at one school there were 30% and at another there were only 7%. All other schools fell between these extremes. Likewise, 52% of the Grade 6 sample were Task experts, but the results by school varied from 0% to 82%.
Conclusion The purpose of this paper was to report on the incidence of the newly identified ways of thinking about decimal notation as revealed by the new test. The new test was not able to separate all types of thinking, because of logical and practical limitations. Ways of thinking that could not be split by the test (e.g., Right hand overflow and Zero makes small, Reciprocal and Negative) accounted for small total percentages, making their separation a low priority. One way of thinking which interview evidence had caused us to believe may be quite prevalent (Reverse thinking) was not prevalent in the results, either because it is indeed rare or because students bring different ideas to bear in the items that the test involves. In hindsight, it would have been better to omit the Group VI items (designed to separate the Reverse thinking) and replace them with more items such as 0.53/0.006 to allow a more accurate division of String length and Numerator focussed thinking. The group of students who have knowledge of only the first one or two decimal places was found to be at least 3.7% and probably twice this size. This is an important finding. The variability of the results by school can in part be explained by socio-economic factors. However, there also seems to be clear evidence that certain misconceptions are learned from school instruction. Some of the peaks may be temporary effects, so that students may be more likely, for example, to show a shorter-is-larger misconception immediately after a unit on fractions. The number of Task experts in a class is likely to be temporarily high if testing takes place immediately after instruction on decimal comparison. Further analysis of our data will investigate questions such as this and identify effects at the class rather than the school level. Note: This work was carried out with a grant to Kaye Stacey from the Australian Research Council. We wish to thank the teachers and students who have participated in this project. References Bell, A. W., Costello, J., & Kuchemann, D.E. (1983). A Review of Research in Mathematical Education, Part A. Windsor, Berks.: NFER-Nelson. Carpenter, T., Corbitt, M., Kepner, H., Lindquist, M., & Reys, R. (1981). Decimals: Results and Implications from National Assessment. Arithmetic Teacher, 21(8), 34-37. Moloney, K. & Stacey, K. (1996). Understanding Decimals. The Australian Mathematics Teacher, 52(1), 4-8. Moloney, K. & Stacey, K. (1997). Changes with Age in Students’ Conceptions of Decimal Notation. Mathematics Education Research Journal, 9(1), 25-38. Nesher, P. & Peled, I. (1986). Shifts In Reasoning: The Case of Extending Number Concepts. Educational Studies In Mathematics, 17, 67-79. Resnick, L. B., Nesher, P., Leonard, F., Magone, M., Omanson, S., Peled, I. (1989). Conceptual Bases of Arithmetic Errors: The Case of Decimal Fractions. Journal for Research in Mathematics Education, 20(1), 8-27. Sackur-Grisvard, C. & Leonard, F. (1985). Intermediate cognitive organization in the process of learning a mathematical concept: The order of positive decimal numbers. Cognition and Instruction, 2, 157-174. Stacey, K. & Steinle, V. (1998). Refining the Classification of Students’ Interpretations of Decimal Notation. Hiroshima Journal of Mathematics Education, 6, 1-21.


![Atrium - Melbourne School of Design - University of Melbourne [PDF]](https://m.moam.info/img/260x300/atrium-melbourne-school-of-design-university-of-me_647dd31b098a9e89398b45ba.jpg)

