www.nature.com/scientificreports
OPEN
Received: 23 May 2017 Accepted: 20 October 2017 Published: xx xx xxxx
MiSNPDb: a web-based genomic resources of tropical ecology fruit mango (Mangifera indica L.) for phylogeography and varietal differentiation M. A. Iquebal1, Sarika Jaiswal1, Ajay Kumar Mahato2, Pawan K. Jayaswal2, U. B. Angadi1, Neeraj Kumar1, Nimisha Sharma3, Anand K. Singh3, Manish Srivastav3, Jai Prakash3, S. K. Singh3, Kasim Khan4, Rupesh K. Mishra4, Shailendra Rajan4, Anju Bajpai4, B. S. Sandhya5, Puttaraju Nischita5, K. V. Ravishankar5, M. R. Dinesh5, Anil Rai1, Dinesh Kumar1, Tilak R. Sharma2 & Nagendra K. Singh2 Mango is one of the most important fruits of tropical ecological region of the world, well known for its nutritive value, aroma and taste. Its world production is >45MT worth >200 billion US dollars. Genomic resources are required for improvement in productivity and management of mango germplasm. There is no web-based genomic resources available for mango. Hence rapid and cost-effective high throughput putative marker discovery is required to develop such resources. RAD-based marker discovery can cater this urgent need till whole genome sequence of mango becomes available. Using a panel of 84 mango varieties, a total of 28.6 Gb data was generated by ddRAD-Seq approach on Illumina HiSeq 2000 platform. A total of 1.25 million SNPs were discovered. Phylogenetic tree using 749 common SNPs across these varieties revealed three major lineages which was compared with geographical locations. A web genomic resources MiSNPDb, available at http://webtom.cabgrid.res.in/mangosnps/ is based on 3-tier architecture, developed using PHP, MySQL and Javascript. This web genomic resources can be of immense use in the development of high density linkage map, QTL discovery, varietal differentiation, traceability, genome finishing and SNP chip development for future GWAS in genomic selection program. We report here world’s first web-based genomic resources for genetic improvement and germplasm management of mango. Mango (Mangifera indica L.) a member of order Sapindales, family Anacardiaceae, is one of the popular fruit crops of tropical and sub-tropical ecological regions of the world. Especially in Asia, it is also referred as ‘King of fruits’ of the tropical world1. Its fruit is globally known for the strong aroma, coloration, delicious taste and a high nutritive value due to high content of vitamin C, β carotene and minerals2. Apart from being used as a fruit, it is also used in various processed forms like pickles, chutney, jelly, vegetable dishes and mango shake. It ranks as the fifth most produced fruit crop worldwide after banana, grapes, apples and oranges. India ranks first in the world in mango production with an annual production of 18–19 MT from an area of 2.31 MHa, which constitutes 40% of the total world production (>45MT worth >200 billion US dollars) (FAOSTAT-2014). India has exported more than 40000 ton mangoes majorly to UAE, UK, Saudi Arabia and the USA, which was of worth 50 million US dollar in 2013–14. Mangifera species being ecologically sensitive, it is mostly distributed below 300 m but can occur at 600–1900 m above sea level. The species is found as scattered individuals in tropical lowland rain forests on well-drained 1
Centre for Agricultural Bioinformatics, ICAR-IASRI, New Delhi, India. 2ICAR-National Research Centre on Plant Biotechnology, New Delhi, India. 3ICAR-Indian Agricultural Research Institute, New Delhi, India. 4ICAR-Central Institute for Subtropical Horticulture, Lucknow, India. 5ICAR-Indian Institute of Horticultural Research, Bengaluru, India. Correspondence and requests for materials should be addressed to D.K. (email:
[email protected])
SCIeNtIfIC REPOrTS | 7:_####_ | DOI:10.1038/s41598-017-14998-2
1
www.nature.com/scientificreports/ soil. Mango requires a frost-free climate. Flowers and small fruit can be killed if the temperature drops below 40° F, even for a short period. It requires warm and dry weather to set fruit. India is bestowed with substantial soil diversity with as much as 24 soil types3 and 15 broad agro-climatic zone having 127 sub agro-climatic zones4. The ecological diversity of soil and climate of India has resulted in very high diversity in mango germplasm along with its uniqueness in taste, aroma and colour specific to geographical locations. Though India is having more than thousand varieties of mango, about 30 varieties are grown for commercial purpose5. Though the area under mango cultivation has increased substantially over the period, but there has been a meagre increase in yield. Biotic (mainly mango malformation due to Fusarium mangiferae)6 and abiotic (temperature, humidity, light, drought, soil salinity and nutrient) factors had been major limiting factors in sustainable productivity of mango7. Though mango holds a huge economic aspect but owing to lack of genomic resources, genomic-based trait improvement and management has been one of the major impediments in mango productivity. Mango is an allotetraploid (2n = 40) fruit tree with a small genome size of 450Mb8–10 but its whole genome sequence is yet to be completed. Single nucleotide polymorphisms (SNPs) are the most abundant type of genetic markers and their high abundance in the genome makes them the ideal markers to study the inheritance of genomic regions11–13. Limited genic region SNP from transcriptome data of mango tissues have been reported14 but the whole genome-based bulk SNP discovery is yet to be reported. Genic region SNPs has been tried for varietal differentiation but with very limited success15. SSR marker-based approach has also been reported with limited success for example out of 41 only 5 varieties16, out of 36 only 7 varieties17 could be differentiated. These studies indicate that existing markers are not good enough for differentiation of mango varieties and there is need to discover more number of markers for variety differentiation and mapping18. An attempt has been made to develop genomic resources using NGS technology, but these resources are neither accessible to global community, nor it covers different varieties representing gene pool19. RAD-Seq (restriction site associated DNA sequencing) approach can identify thousands of SNPs distributed randomly across the genome20. RAD-Seq can be applied to study the population genetics of a species with no or very less sequence data and has several advantages over other methods for SNP discovery. Such approach reduces the complexity of the genome by sub-sampling only at the sites identified by restriction enzymes21. It reduces the investment drastically22. Till whole genome sequencing of Mango genome is completed such RAD-based bulk SNP discovery approach is most cost-effective and readily feasible alternative. Such SNP can directly be used for phylogeography and varietal differentiation. Similar studies have been done very successfully in various crops like cotton23 and sunflower24. Besides this such SNP data has further immense use and relevance in increasing marker density in linkage mapping programme. Even such approach has increased the marker density in specific variety of rice by utilizing available ref-sequence25. High heterozygosity in the plant is a big challenge in terms of whole genome sequencing-based SNP/polymorphism discovery. The RAD-seq technique can be used for rapid marker discovery and genotyping in crops for highly heterozygous and outbreeding species like mango where de novo genome assembly is challenging26. Attempts of geographical and varietal delineation of mango varieties with their genetic relationship have been made with RAPD and ISSR markers but there is no clear report covering the entire geographical locations of India27. Unless markers from all important varieties of mango are not discovered such studies cannot be completed. Molecular markers are required for traceability of mango fruit and its product to address the issues of adulteration28. An allelic database of mango for varietal differentiation has been reported29 where limited markers are not able to differentiate varieties. Earlier reported molecular marker information are not in the form of web genomic resources to be used as a research tool for mapping, QTL studies and genome finishing. Moreover, mango being fruit crop of relatively much longer life cycle (2–4 years), the DUS test statutory norms of varietal identification having two trials at two locations (http://www.plantauthority.gov.in/pdf/mango.pdf) becomes further challenging and cumbersome. The available genomic resources in mango are very scarce as only 107768 nucleotide sequences of mango are available in NCBI Genbank (as in May, 2017). Thus for a crop like mango, more holistic genomic resources are required to accelerate the DNA-based varietal differentiation, phylogeographic studies, increase in marker density for subsequent QTL and gene discovery. Present work aims at ddRAD-based SNP mining from 84 varieties of mango along with the development of its web-based genomic resources. It also aims at phylogeographic studies of these mango varieties along with its evolutionary relationship.
Results and Discussion
After pre-processing of RAD-Seq data, a total of 171807860 paired end reads were obtained with 14121079231 number of bases. Approximately, 5587436 (3.14%) low quality reads were removed. A total of 1258705 SNPs were obtained from these RAD sequences representing 84 varieties of mango. RAD genomic data coverage of each variety are shown in Supplementary Table 1. Variety-wise average genome coverage was found to be 8.36% with highest coverage of 15.35% in Langra variety and lowest coverage of 3.53% in Ratoul. Average SNP depth was found to be 9.815 with lowest and highest densities 4.787 and 17.953 in varieties, viz., Ratoul and Suvarnarekha, respectively. Conversely, in the data set, highest (at 1480 bp interval) and lowest (at 5090 bp interval) SNP density was observed in Suvarnarekha and Ratoul varieties, respectively. Overall SNP density over entire genome was estimated to be 357 bp. All these data have been populated in MiSNPDb to develop genomic resources. Only 749 SNPs were found common to all 84 varieties, which were subsequently used for diversity analysis and phylogeography studies. With increase in number of varieties for SNP discovery, we found decrease in number of common SNPs. For example, comparison of 10, 20, 50, 70 varieties, we got 10634, 7253, 2062 and 1343 SNPs, respectively (Table 1). Thus, large number (84) of varieties having inherent limitation of RAD-sequence data variation in terms of area covered on the respective genome of each variety made them further limiting the common genomic regions to be represented in SNP discovery. Besides this, the inherent limitation of RAD sequencing itself has also contributed in this reduced number of common SNPs. Unlike whole genome sequencing, in RAD sequencing, SCIeNtIfIC REPOrTS | 7:_####_ | DOI:10.1038/s41598-017-14998-2
2
www.nature.com/scientificreports/ Number of Varieties
Number of Common SNPs
5
32170
10
10634
20
7253
30
4080
40
2184
50
2062
60
1489
70
1343
80
946
Table 1. Decreasing trend in number of common SNPs with increasing number of varieties.
Type of Variation
Number
Percentage of the SNP type
A/G
427968
34.00%
C/T
429349
34.11%
A/T
118403
9.40%
A/C
98811
7.85%
C/G
83914
6.66%
G/T
100260
7.96%
Total
1258705
100%
Table 2. Statistics for the identified SNP types.
the entire genome cannot be covered irrespective of increase in depth as size selection step discards unsheared or partially sheared restriction fragments30. This random missing of genomic region further limits the common regions to be compared in SNP discovery. It leads to reduction in common number of SNPs. Apart from these two general limitations of RAD, there is one species specific reason in our dataset reducing number of common SNPs. Mango species being highly heterozygous causes hindrance in genome assembly, thus compromising genomic coverage of final RAD assembly31. All these factors might have contributed in drastic reduction of common number of SNPs in our dataset. Magnitude of reduction in common SNP may not affect the phylogenetic tree, varietal differentiation, admixture and pedigree analysis. In crop like cassava, even 300 SNP markers have been found adequate enough for these kind of differentiation32. Such use of RAD based SNP in 429 wheat variety differentiation using just 43 SNPs has been reported33.
SNP-based diversity analysis. SNP-based diversity analysis of the 84 varieties of mango was done along
with construction of phylogenetic tree for geographical relatedness using common RAD loci. The major allele frequency varied from 0.5 to 0.994 while minor allele frequency ranged from 0.006 to 0.5. The observed heterozygosity had a range of 0.0579 to 0.2649 with a mean of 0.1246 and expected heterozygosity varied from 0.029 to 0.1324 with a mean of 0.0623. The observed homozygosity was from 0.7351 to 0.9421 with a mean of 0.8753 and expected homozygosity varied from 0.8676 to 0.971 with a mean of 0.9376. The nucleotide diversity (π) had a range of 0.0579 to 0.2649 with a mean of 0.1246. The summary statistics for all the population of mango are summarized in Supplementary Table 2. This table contains summary of genetic statistics for all population split into those calculated for only nucleotide positions that are polymorphic in at least one mango population (described at top, “Variant positions”), as well as all nucleotide positions across all RAD sites regardless of whether they are polymorphic or fixed (described at bottom, “All positions”). These statistics include the average number of individuals genotyped at each locus (N), the number of variable sites unique to each population (private), the number of polymorphic (top) or total (bottom) nucleotide sites across the data set (sites), percentage of polymorphic loci (% poly), the average frequency of the major allele (P), the average observed heterozygosity per locus (Hobs), the average nucleotide diversity (π), and the average Wright’s inbreeding coefficient (FIS). A total of transition type SNPs (857317, 68.11%) having A/G (427968) and C/T (429349) type, accounting for 34.00% and 34.11%, respectively were detected. The other four types were transversion type (401388, 31.88%), observed as C/G (83914), G/T (100260), A/C (98811) and A/T (118403) with percentage varying between 6.66% and 9.40% (Table 2). The transition to transversion (Ti/Tv) ratio was observed to be 4.27. Ti/Tv is a ratio representing rate of single nucleotide change and not of observed events. Since transitions are two times more frequent than transversions, the Ti/Tv ratio is twice the ratio of events = 2 × (Ti/Tv)34. The Ti/Tv ratio approximately nears the Ts/Tv estimated in non-long terminal repeat (Non-LTR) retrotransposon sequences in crops like maize (3.9), medicago (3.6), lotus (2.5)35, peach (3.62, 3.47 and 3.28)34 and in another case of peach genotype (3.098)36. This high transition/transversion ratio of 4.312 in this current study may be an indication of low genetic divergence as it has been noted that lower is the genetic divergence, higher is the Ti/Tv ratio37. The Ti/Tv ratio is commonly used
SCIeNtIfIC REPOrTS | 7:_####_ | DOI:10.1038/s41598-017-14998-2
3
www.nature.com/scientificreports/ Variety
Number of SNPs
Variety
Number of SNPs Variety
Number of SNPs
Afeam
17749
Fazri Kalam
11889
Mohanbhog
8980
Alphan
16439
Gilas
8132
Mombosa
18388
Alphanso
12305
Gola Bhadaiya
19057
Mulgoa
18270
Amin Prince
13929
Gourjeet
9891
Mundappa Black
8955
Amrapali
14002
Gulab Khas Green
11236
Neelum
15352
Arka Aruna
18636
Hardil Aziz
10045
Nekkare
16946
Arunika
8913
Heraswania
26619
Prabhashankar
5018 9979
Baganapalli
19227
Himsagar
31479
Primor de Amoreira
Banganpalli
16458
Hyb. 165
13375
Pusa Arunima
22087
Banglora
13851
Irwin
9889
Pusa Lalima
16964
Baramasi
19290
Iturba
18228
Pusa Peetamber
13154
Baramasi Ajholi
13286
Janardan Pasand
15850
Pusa Pratibha
11330
Bathui
11030
Kala
13867
Pusa Shersth
12922
Bhadaiya Sukul
15080
Kalapahar
8873
Pusa Surya
14123
Bhadauran
11122
Karishad
9704
Ramkela
16380
Bombay
7440
Kesar
19130
Rataul
17558
Bombay Green
13236
Khasulkhas
14202
Ratna
14419
Bombay Yellow
9793
Kothapalli Kobbari
13768
Rosari
16491
Bride of Russia
22978
Kurukkan
11571
Safdar Pasand
14382 7946
Carabao
15576
Langra
30131
Samar Bahist Alibagh
Chandrakaran
13538
Langra Gorakhpur
14260
Seipia
17643
Chinku
12245
Machhli
15548
Sensation
13110
Creeping II
15272
Malda
15530
Sonatol
9698
Dushehari
15095
Malihabad Safeda
13653
Sukul
18788
Edward
13431
Mallika
19592
Suvarnarekha
37688
Elaichi
9243
Manipur dwarf
11064
Tatoul
3122
Extrema
15042
Manorajan
33248
Willard
26827
Fazri
13350
Mohammada Vikarabad
19862
Zardalu
4936
Table 3. Number of SNPs detected in each of the 84 varieties of mango. for ‘phylogentic’ tree construction, genetic divergence time estimation and to better the mechanisms of evolution at molecular level38,39. The number of SNP per variety of mango has been shown in Table 3.
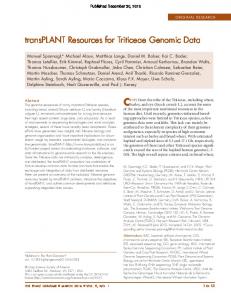
SNP-based phylogeography of mango varieties. The phylogenetic tree of 84 varieties of mango was constructed using PHyML in order to classify the varieties according to their geographical relatedness. The phylogenetic tree constructed from the phylip file of these common RAD loci are shown in Fig. 1. When we compared varieties in this phylogenetic tree with their respective geographical distribution in India, we found all 70 indigenous mango varieties to fall in three zones, viz., North, East and South zones except 13 hybrid/exotic varieties. Our analysis revealed three major lineages which showed that varieties belonging to northern and eastern India were found to be overlapping (merged) in geographical distribution. As our study reveals distinct genetic differentiation in consonance with geographical distribution, thus these SNPs can be used in varietal differentiation of indigenous mango varieties along with traceability of mango produce/products. Hybrid/exotic varieties (13) taken under present study could not be assigned to any of these major lineage/group over three geographical zones. This is obviously expected due to attribute of a hybrid having been originated from two parental varieties. This unassigned group also includes Indian mango varieties having exotic in origin/exotic parental variety (Supplementary Table 3). Small, separate cluster of these hybrid/exotic mango varieties might also be due to the limitation of RAD-based SNPs itself due to restriction fragment bias, restriction site heterozygosity and PCR GC content bias30. Earlier attempt has been made for phylogenetic studies of Indian mango varieties using SSR markers only. SSR-based phylogenetic tree of 387 mango accessions using limited 14 SSR loci has been reported40. The present study has 70 common varieties and all agree with earlier reported SSR-based tree, except 14 hybrid/exotic mango varieties. When our 84 varieties were compared for its geographical distribution, we found appropriate grouping in phylogenetic clusters except for hybrid/exotic varieties (Supplementary Table 3). We also compared our SNP-based tree with another SSR-based tree, which is confined to a very limited number of varieties (37) with 14 SSR markers41. This study also revealed three major clusters of Indian mango varieties. Subsequent comparison with major commercial mango varieties reported in this study was found in matching clusters41. Development of web-based genomic resource. Though a huge catalogue of phenotypic information of germplasm accessions and related basic information are available in mango resources information system SCIeNtIfIC REPOrTS | 7:_####_ | DOI:10.1038/s41598-017-14998-2
4
www.nature.com/scientificreports/
Figure 1. Radial phylogenetic tree showing four major lineages and one minor lineage using the SNP data generated from dd-RAD sequencing information of 84 mango varieties.
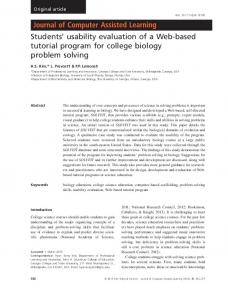
(www.mangifera.org) but there is no web-based genomic resources having molecular markers with genome information. The SNP data sets generated in the present study was compiled and stored in a database (MiSNPDb), which is the first portal available with basic information of genomic information. In the homepage of the web portal, selection of radio button ‘variety’ displays total number of SNPs discovered in a particular variety. On clicking ‘SNP ID’ which is having assigned a serial number of every SNP across varieties (from 1 to 1.258705 Million), it will enlist varieties having very same SNP along with type of haplotype with respect to varieties. Our database also displays the stack depth for every SNP so that user can select SNP at desired threshold of stack depth to maneuver over confidence limit required in SNP array assay development. An advance search option has also been provided to customize the need of users based on haplotype, common SNPs in selected varieties, the threshold of depth coverage (Fig. 2). The option of depth coverage will allow users to make a logical balance between selection of SNP and minor allele frequency as low threshold decreases chances of minor allele detection and high threshold leads to allelic dropout42. Our advance search has provision for haplotype, depth selection and selection of multiple varieties to get their common SNPs.
Utility of MiSNPDb in genomic research. Present database can be a valuable tool in expediting mango genomic research. As whole genome assembly of mango is yet to be available, thus such RAD-based genomic resources can be a rapid and cost effective approach for marker discovery which can be used in both model and non-model species43. Our genomic resources of RAD data based SNPs can be used in making high-density linkage map of mango. First high density linkage map of mango has been reported by crossing two varieties viz., “Jin-Hwang” and “Irwin” of M. indica, with length map 3148.28 cM, 20 linkage group and average markers distance 0.48 cM but these resources are also not accessible44. Another linkage group (20) of mango genome which are mapped using only genic region 1054 SNPs, thus representing very limited part of the genome14. Such use has been reported in other crop like Jujube (Ziziphus species) where 42784 putative high-quality SNP were linked to genetic map reducing the average marker interval of very drastically in tune of 0.34 cM making consistency with 12 linkage SCIeNtIfIC REPOrTS | 7:_####_ | DOI:10.1038/s41598-017-14998-2
5
www.nature.com/scientificreports/
Figure 2. Workflow of the MiSNPDb genomic resource.
group i.e. haploid chromosome number45. Similar mapping and QTL discovery using RAD-based SNPs have been reported in barley as well46. In case of crop sesame, more number of RAD-based SNP has been added in the existing linkage map, to create ultra-dense genetic map or ‘improved SNP map’. This approach has discovered more number of QTLs associated with economically relevant traits with identification of candidate genes in sesame47. RAD data-based genomic resources of SNP markers has enormous application in genome assembly especially to assign scaffolds in process of genome finishing48. Such RAD-based SNPs have been successfully used in improvement of de novo genome assembly46. These mango SNPs can be used in the development of throughput SNP arrays (SNP chip) after using standard filtering criteria. Such approach and criteria have been reported in other crop like sunflower24. MAF information is directly relevant to selection of SNPs for array development in genomic selection program. Mango being highly heterozygous fruit crop with higher genome complexity27, thus RAD-based SNP can reduce the magnitude of this issue as this approach is covering on an average 10% of whole genome randomly over specific orthologous regions49. Further, such resources have been used in trait specific mapping in very same sunflower50. RAD-based SNPs have been successfully used in eggplant for increasing the marker density and development of SNP chip/ array51. Mango fruit traceability studies have been reported with a limited number of markers (i.e., 15) and limited varieties (41) differentiating Iranian varieties originated from India and Pakistan16. Since such differentiation among these disputed varieties requires genotyping of few selected SNPs, thus present MiSNPDb can be of immense utility as immediately available genomic resources. Respective location of SNPs displayed in our database along with the DNA fragments can directly be used in development of SNP allelic discrimination chemistry or screening assay like FRET, beacon, scorpion or multiplexing. DNA profiling provides novel approaches to varietal identification having advantage over traditional morphological comparisons of DUS features. Such advantages are due to the attributes of high resolving power, objectivity, and its feasibility of testing at any stage of plant development/from any tissue of plant besides cost effectiveness52. Our RAD SNP-based phylogenetic tree was superimposed over native specific geographical regions of major commercial mango varieties. It clearly reflects that this genomic resources can be used for not only varietal differentiation but also for geographical origin in the cases of traceability of mango produce. Varietal signature and geographical traceability have high relevance in long term requirement to protect variety sovereignty along with GI protection, if granted or needed. Our genomic resources can be used as a research tool for development of varietal signature of targeted varieties. MiSatDb genomic resources provides a list of common SNPs across selected varieties which can be multiplexed for varietal differentiation. Our database also provides haplotype which can also be compared across varieties in varietal signature development. Such limited varietal differentiation in mango varieties viz., Neelam, Dashehari and Amrapali is recently reported using SNPs53. RAD genomic resources based limited number of SNP has been used in trait improvement by cost-effective marker development tagging a disease resistance gene in molecular breeding of crop54. RAD data has been of immense use in species lacking sufficient genomic resources including reference sequence. In this situation, it has great advantage of low per-sample cost needed to generate millions of molecular markers required for genomic
SCIeNtIfIC REPOrTS | 7:_####_ | DOI:10.1038/s41598-017-14998-2
6
www.nature.com/scientificreports/ selection55. RAD data has been used for population structure and degree of admixture analysis. Such analysis has even revealed footprint of domestication and bottleneck56 as well as climate change events57 in crops. Even after availability of mango whole genome reference sequence in future, the present genomic resources can be still of immense value. These SNPs can be mapped over mango genome reference sequence to obtain their exact physical location on each and every chromosome, thus obviating the need of re-sequencing to get similar information. Obtaining such genomic co-ordinates of each SNP will have further additional advantage to select them at equal spacing in order to minimise number of SNPs (with respect to each haplotype) without compromising the efficacy of genomic selection in future. Such approach even reduces the cost of genotyping. Use of RAD SNPs over existing ref-sequence has been very successfully used to enrich variety specific genomic resources of crop like rice with rapidity and cost effectiveness along with reduced computational complexities25.
Conclusion
From a total of 84 mango varieties, 1.25 M SNPs using 171.80786 M RAD sequences are reported and catalogued in web genomic resource MiSNPDb. 749 SNPs were common to all these 84 varieties, which were used for diversity analysis and phylogeography studies. MiSNPDb has customized advance search options for haplotypes, depth and the varieties having common SNPs. The average genome coverage was 8.36% and average SNP depth was found to be 9.815. These resources can be used in mapping, QTL discovery, varietal differentiation, traceability, genome finishing and SNP array development in genetic improvement program and management of mango germplasm. Our study reveals that diversity of both soil and tropical ecology have contributed to evolution and differentiation of Indian mango varieties having a unique appearance, taste and aroma in different geographical regions.
Methods
Mango genomic DNA extraction and ddRAD-sequencing. High-molecular weight DNA from 91 leaf
tissue samples was extracted and prepared for sequencing according to the modified version of RAD sequencing is known as Double Digestion Restriction site Associated DNA sequencing (ddRAD-Seq)58. One μg DNA from each sample was digested with Sphl and Mluc1 restriction enzyme and purified using AMPure XP Beads (Beckman Coulter, USA). Using T4 DNA ligase ligation of barcoded P1 and P2 adaptors was done and size selection of the product was done after 2% agarose gel electrophoresis. PCR amplification was done to enrich and add the Illumina specific adapters and flow cell annealing sequence, final quality check was done on bio analyzer. Sequencing was performed using Illumina TrueSeq chemistry (2X100nt) on Illumina HiSeq 2000 platform.
Preprocessing of ddRAD-Seq data. The ddRAD-Seq data of 84 varieties of mango were preprocessed using the FASTX-Toolkit59. The number of sequences before quality trimming were 177395296 with a total of 17898214358 bases. In order to remove low quality sequence data, the data was quality trimmed using the fastq_ quality_trimmer command of the FASTX-Toolkit. The minimum phred-score of 30 and minimum sequence length of 30 base pairs was used as a threshold for quality trimming. De novo SNP mining. De novo SNP mining was done by tool STACKS60 software version 1.29 using pro-
cessed paired end RAD-Seq data of 84 varieties of mango. The denovo_map.pl perl wrapper script of the tool was used having three components viz., ustacks, cstacks and sstacks using the standard parameters. Population genetics statistics and transition and transversion ratio were calculated using in house perl script.
Diversity analysis. Genetic diversity in the 84 varieties of mango was estimated using major and minor allele frequency, observed and expected heterozygosity as well as observed and expected homozygosity, and nucleotide diversity (π) at each locus. These parameters were calculated using the population program of the stacks pipeline. The population genetic statistics were generated using the population program of stacks pipeline using the common SNPs found in all the 84 varieties. Following the SNP mining and population genetic statistics, phylogenetic tree was drawn using the phylip file generated by the population program of the STACKS based on all the samples. Construction of phylogenetic tree. The SNPs from 84 varieties of mango mined using stacks software
using the denovo_map.pl and population program which can give the results in vcf format and phylip format. The SNPs common in 84 varieties of mango varieties were retrieved from the vcf file constructed by the stacks software. The number of common SNPs is 749 out of 1192 SNPs. The phylip tree of the common SNPs was constructed by PHyML software version 3.061 using BioNJ (neighbor joining) algorithm. The phylogenetic tree constructed by the PHyML software was visualized using the software Figtree version 1.4.062.
The Database Development. MiSNPdb (Mangifera indica SNP database), a relational database with three-tier architecture was developed using PHP, MySQL and Javascript. These three tiers are client, middle and database tier. Various web pages are developed for database browsing. The queries by users are placed in client tier. Database includes tables for SNPs from different mango varieties. In order to fetch the data from database and execute the query fired by the user, middle tier has a role in server side scripting using PHP. The database is freely accessible at the http://webtom.cabgrid.res.in/mangosnps/.
References
1. Krishna, H. & Singh, S. K. Biotechnological advances in mango (Mangifera indica L.) and their future implication in crop improvement—a review. Biotech. Advances 25, 223–243 (2007). 2. Tharanathan, R. N., Yashoda, H. M. & Prabha, T. N. Mango (Mangifera indica L.), “The king of fruits”—An overview. Food Reviews International 22, 95–123 (2006). 3. Bhattacharyya, T. et al. Soils of India: historical perspective, classification and recent advances. Curr. Sci. 104, 1308–1323 (2013).
SCIeNtIfIC REPOrTS | 7:_####_ | DOI:10.1038/s41598-017-14998-2
7
www.nature.com/scientificreports/ 4. Mandal, C. et al. Revisiting agro-ecological sub-regions of India-a case study of two major food production zones. Curr. Science 107 (2014). 5. Guidelines for conduct of tests for Distinctness,Uniformity and Stability. Mango (Manifera indica L.) Protection of plant varieties and farmers’ Right Authority, Department of Agriculture and cooperation, Ministry of Agriculture, Governement of India, NASC Complex, DPS Marg (OppTodapur Village) New Delhi – 110012 p17. 6. Chakrabarti, D. K. Chronological History of Mango Malformation. (ed Mango Malformation) 1–9 (Springer Netherlands, 2011). 7. Léchaudel, M. & Joas, J. An overview of preharvest factors influencing mango fruit growth, quality and postharvest behaviour. Braz. J. Plant Physiol. 19, 287–298 (2007). 8. Mukherjee, S. K. Mango: its allopolyploid nature. Nature 166, 196–197 (1950). 9. Mukherjee, S. K. Origin of mango (Mangifera indica). Economic Botany 26, 260–264 (1972). 10. Singh, N. K. et al. A Draft Genome of the King of Fruit, Mango (Mangifera indica L.). In Plant and Animal Genome XXII Conference. Plant and Animal Genome (2014). 11. Stickney, H. L. et al. Rapid mapping of zebrafish mutations with SNPs and oligonucleotide microarrays. Genome Research 12, 1929–1934 (2002). 12. Berger, J., Suzuki, T., Senti, K. A., Stubbs, J., Schaffner, G. & Dickson, B. J. Genetic mapping with SNP markers in Drosophila. Nat. Genet. 29, 475–481 (2001). 13. Wicks, S. R., Yeh, R. T., Gish, W. R., Waterston, R. H. & Plasterk, R. H. Rapid gene mapping in Caenorhabditis elegans using a high density polymorphism map. Nature Genetics 28, 160–164 (2001). 14. Kuhn, D. N., Dillon, N. L., Innes, D. J., Wu, L. S., & Mockaitis, K. Development of single nucleotide polymorphism (SNP) markers from the mango (Mangifera indica) transcriptome for mapping and estimation of genetic diversity. In XXIX International Horticultural Congress on Horticulture: Sustaining Lives, Livelihoods and Landscapes (IHC2014): IV 1111 (pp. 315–322) (2014). 15. Sherman, A. et al. Mango (Mangifera indica L.) germplasm diversity based on single nucleotide polymorphisms derived from the transcriptome. BMC Plant Biol 15, 277 (2015). 16. Shamili, M., Fatahi, R. & Hormaza, J. I. Characterization and evaluation of genetic diversity of Iranian mango (Mangifera indica L., Anacardiaceae) genotypes using microsatellites. Scientia Horticulturae 148, 230–234 (2012). 17. Honsho, C., Nishiyama, K., Eiadthong, W. & Yonemori, K. Isolation and characterization of new microsatellite markers in mango (Mangifera indica). Mol. Ecol. Notes 5, 152–154 (2005). 18. Surapaneni, M. et al. Population structure and genetic analysis of different utility types of mango (Mangifera indica L.) germplasm of Andhra Pradesh state of India using microsatellite markers. Plant Syst. and Evol 299, 1215–1229 (2013). 19. Ravishankar, K. V., Dinesh, M. R., Nischita, P. & Sandya, B. S. Development and characterization of microsatellite markers in mango (Mangifera indica) using next-generation sequencing technology and their transferability across species. Mol. Breeding 35, 1–13 (2015). 20. Hohenlohe, P. A. et al. Population genomics of parallel adaptation in threespine stickleback using sequenced RAD tags. PLoS Genet. 6, e1000862 (2010). 21. Davey, J. W. et al. Genome-wide genetic marker discovery and genotyping using next-generation sequencing. Nat. Rev. Genet. 12, 499–510 (2011). 22. Etter, P. D., Bassham, S., Hohenlohe, P. A., Johnson, E. A., & Cresko, W. A. SNP discovery and genotyping for evolutionary genetics using RAD sequencing. Mol. Methods. Evol. Genet. 157–178 (2011). 23. Wang, Y. et al. Molecular mapping of restriction-site associated DNA markers in allotetraploid Upland cotton. PloS One 10, e0124781 (2015). 24. Pegadaraju, V., Nipper, R., Hulke, B., Qi, L. & Schultz, Q. De novo sequencing of sunflower genome for SNP discovery using RAD (Restriction site Associated DNA) approach. BMC Genomics 14, 1 (2013). 25. Fan, W. et al. Development of a RAD-Seq Based DNA Polymorphism Identification Software, AgroMarker Finder, and its Application in Rice Marker-Assisted Breeding. PloS one 11, e0147187 (2016). 26. Baird, N. A. et al. Rapid SNP discovery and genetic mapping using sequenced RAD markers. PloS one 3, e3376 (2008). 27. Samal, K. C., Jena, R. C., Swain, S. S., Das, B. K. & Chand, P. K. Evaluation of genetic diversity among commercial cultivars, hybrids and local mango (Mangifera indica L.) genotypes of India using cumulative RAPD and ISSR markers. Euphytica 185, 195–213 (2012). 28. Muray, N. Mango supply chain running short of product, Food news (Agribusness Intelligence) (2016). 29. Dos Santos Ribeiro, I. C., Lima Neto, F. P. & Santos, C. A. Allelic database and accession divergence of a Brazilian mango collection based on microsatellite markers. Genet Mol. Res. 11, 4564–4574 (2012). 30. Davey, J. W. et al. Special features of RAD Sequencing data: implications for genotyping. Mol. Ecol. 22, 3151–3164 (2013). 31. Pryszcz, L. P. & Gabaldón, T. Redundans: an assembly pipeline for highly heterozygous genomes. Nuc. Acids. Res. 44, e113–e113 (2016). 32. Rabbi, I. Y. et al. Tracking crop varieties using genotyping-by-sequencing markers: a case study using cassava (Manihot esculenta Crantz). BMC genet. 16, 115 (2015). 33. Gao, L., Jia, J., Kong, X. A SNP-Based Molecular Barcode for Characterization of Common Wheat. PLoS ONE. 11(3) (2016). 34. Fresnedo-Ramírez, J., Martínez-García, P. J., Parfitt, D. E., Crisosto, C. H. & Gradziel, T. M. Heterogeneity in the entire genome for three genotypes of peach [Prunus persica (L.) Batsch] as distinguished from sequence analysis of genomic variants. BMC Genomics 14, 750 (2013). 35. Vitte, C. & Bennetzen, J. L. Analysis of retrotransposon structural diversity uncovers properties and propensities in angiosperm genome evolution. Proceed. Nat. Acad. of Sci 103, 17638–17643 (2006). 36. Martínez-Garcia, P. J. et al. Application of genomic and quantitative genetic tools to identify candidate resistance genes for brown rot resistance in peach. PloS One 8, e78634 (2013). 37. Yang, Z. & Yoder, A. D. Estimation of the transition/transversion rate bias and species sampling. J. Mol. Evol. 48, 274–283 (1999). 38. Ina, Y. Estimation of the transition/transversion ratio. J. Mol. Evol. 46, 521–533 (1998). 39. Kimura, M. A simple method for estimating evolutionary rates of base substitutions through comparative studies of nucleotide sequences. J. Mol. Evol. 16, 111–120 (1980). 40. Ravishankar, K. V. et al. Genetic diversity and population structure analysis of mango (Mangifera indica) cultivars assessed by microsatellite markers. Trees 29, 775–783 (2015). 41. Bajpai, A. et al. Molecular and morphological diversity in locally grown non-commercial (heirloom) mango varieties of North India. J. Environ. Bio 37, 221 (2016). 42. Verdu, C. F. et al. Dealing with paralogy in RADseq data: in silico detection and single nucleotide polymorphism validation in Robinia pseudoacacia L. Ecol. and Evol 6, 7323–7333 (2016). 43. Miller, M. R., Dunham, J. P., Amores, A., Cresko, W. A. & Johnson, E. A. Rapid and cost-effective polymorphism identification and genotyping using restriction site associated DNA (RAD) markers. Gen. Res 17, 240–248 (2007). 44. Luo, C. et al. Construction of a High-Density Genetic Map Based on Large-Scale Marker Development in Mango Using SpecificLocus Amplified Fragment Sequencing (SLAF-seq). Front. Plant Sci. 7 (2016). 45. Zhao, J. et al. Rapid SNP discovery and a RAD-based high-density linkage map in jujube (Ziziphus Mill.). PloSOne 9, e109850 (2014).
SCIeNtIfIC REPOrTS | 7:_####_ | DOI:10.1038/s41598-017-14998-2
8
www.nature.com/scientificreports/ 46. Chutimanitsakun, Y. et al. Construction and application for QTL analysis of a Restriction Site Associated DNA (RAD) linkage map in barley. BMC Genomics 12, 4 (2011). 47. Zhang, H., Miao, H., Li, C., Wei, L., Duan, Y., Ma, Q. & Chang, S. Ultra-dense SNP genetic map construction and identification of SiDt gene controlling the determinate growth habit in Sesamum indicum L. Sci. Rep 6, 31556 (2016). 48. Amores, A., Catchen, J., Ferrara, A., Fontenot, Q. & Postlethwait, J. H. Genome evolution and meiotic maps by massively parallel DNA sequencing: spotted gar, an outgroup for the teleost genome duplication. Genetics 188, 799–808 (2011). 49. Willing, E. M., Hoffmann, M., Klein, J. D., Weigel, D. & Dreyer, C. Paired-end RAD-seq for de novo assembly and marker design without available reference. Bioinformatics 27, 2187–2193 (2011). 50. Talukder, Z. I. et al. A high-density SNP map of sunflower derived from RAD-sequencing facilitating fine-mapping of the rust resistance gene R 12. PLoS One 9, e98628 (2014). 51. Barchi, L., Lanteri, S., Portis, E., Acquadro, A., Valè, G., Toppino, L. & Rotino, G. L. Identification of SNP and SSR markers in eggplant using RAD tag sequencing. BMC Genomics 12, 304 (2011). 52. Morell, M. K., Peakall, R., Appels, R., Preston, L. R. & Lloyd, H. L. DNA profiling techniques for plant variety identification. Aus. Jour of Exp. Agri 35, 807–819 (1995). 53. Mahato, A. K. et al. Leaf Transcriptome Sequencing for Identifying Genic-SSR Markers and SNP Heterozygosity in Crossbred Mango Variety ‘Amrapali’ (Mangifera indica L.). PloS one 11, e0164325 (2016). 54. Yang, H., Tao, Y., Zheng, Z., Li, C., Sweetingham, M. W. & Howieson, J. G. Application of next-generation sequencing for rapid marker development in molecular plant breeding: a case study on anthracnose disease resistance in Lupinus angustifolius L. BMC genomics 13, 318 (2012). 55. Dou, J. et al. Evaluation of the 2b-RAD method for genomic selection in scallop breeding. Sci. Rep. 6 (2016). 56. Wang, Y., Shahid, M. Q., Lin, S., Chen, C. & Hu, C. Footprints of domestication revealed by RAD-tag resequencing in loquat: SNP data reveals a non-significant domestication bottleneck and a single domestication event. BMC genomics 18, 354 (2017). 57. Clark, L. V. et al. A footprint of past climate change on the diversity and population structure of Miscanthus sinensis. Ann. of Bot 114, 97–107 (2014). 58. Peterson, B. K., Weber, J. N., Kay, E. H., Fisher, H. S. & Hoekstra, H. E. Double digest RADseq: an inexpensive method for de novo SNP discovery and genotyping in model and non-model species. PloS One 7, e37135 (2012). 59. Gordon, A., & Hannon, G. J. Fastx-toolkit. FASTQ/A short-reads preprocessing tools (unpublished) http://hannonlab.cshl.edu/ fastx_toolkit,5 (2010). 60. Catchen, J., Hohenlohe, P. A., Bassham, S., Amores, A. & Cresko, W. A. Stacks: an analysis tool set for population genomics. Mol. Eco 22, 3124–3140 (2013). 61. Guindon, S. et al. New algorithms and methods to estimate maximum-likelihood phylogenies: assessing the performance of PhyML 3.0. Sys. Biol 59, 307–321 (2010). 62. Rambaut, A. FigTree version 1.4. 0: Available at http://tree.bio.ed.ac.uk/software/figtree (2012).
Acknowledgements
Authors are thankful to Network Project on Transgenics in Crops, Indian Council of Agricultural Research, Ministry of Agriculture and Farmers’ Welfare, Govt. of India for providing research grant. Computational work done at Advanced Super Computing Hub for Omics Knowledge in Agriculture (ASHOKA) facility at ICARIASRI, New Delhi, India is also thankfully acknowledged.
Author Contributions
N.K.S., D.K., T.R.S. and A.R. conceived theme of the study. A.K.M., P.K.J., N.S., M.S., J.P., K.K., R.K.M., B.S.S. and P.N. collected samples A.K.S., S.K.S., S.R., A.B., K.V.R., M.R.D. and N.K.S. generated data. M.A.I., S.J., N.K., U.B.A. and A.K.M. did the computational analysis of generated data and developed database. M.A.I., S.J., D.K. and A.K.M. drafted the manuscript. D.K., A.R., A.K.S., M.S., S.K.S., A.B., S.R., K.V.R., M.R.D., T.R.S. and N.K.S. edited the manuscript. All co-authors read and approved the final manuscript.
Additional Information
Supplementary information accompanies this paper at https://doi.org/10.1038/s41598-017-14998-2. Competing Interests: The authors declare that they have no competing interests. Publisher's note: Springer Nature remains neutral with regard to jurisdictional claims in published maps and institutional affiliations. Open Access This article is licensed under a Creative Commons Attribution 4.0 International License, which permits use, sharing, adaptation, distribution and reproduction in any medium or format, as long as you give appropriate credit to the original author(s) and the source, provide a link to the Creative Commons license, and indicate if changes were made. The images or other third party material in this article are included in the article’s Creative Commons license, unless indicated otherwise in a credit line to the material. If material is not included in the article’s Creative Commons license and your intended use is not permitted by statutory regulation or exceeds the permitted use, you will need to obtain permission directly from the copyright holder. To view a copy of this license, visit http://creativecommons.org/licenses/by/4.0/. © The Author(s) 2017
SCIeNtIfIC REPOrTS | 7:_####_ | DOI:10.1038/s41598-017-14998-2
9