enthusiasm and attitude of life made working on my research a great ... Mariana V. Bravo from the University of Sao Paulo for the provision and use of their ...
Mitigating The Stochastic Effects Of Fading In Mobile Wireless Ad-hoc Networks by Ivan G. Guardiola, BSEE, MSIE A Dissertation In Industrial Engineering Submitted to the Graduate Faculty of Texas Tech University in Partial Fulfillment of the Requirements for the Degree of Doctor of Philosophy Approved by Timothy I. Matis Mike Bartolacci Terry Collins John Kobza Milton Smith Fred Hartmeister Dean of the Graduate School December, 2007
c °2007, Ivan G. Guardiola
Texas Tech University, Ivan G. Guardiola, December 2007
ACKNOWLEDGEMENTS Upon reflection, there are many people to thank for their help both academically as well as in the dealings of life. Thus, I would like to extend a general thanks to all those people who have crossed my path throughout my academic career, which without them this would have been a dull experience. I would first and foremost like to begin by dedicating this work to my loving parent’s Antonio R. and Rosa I. Guardiola, which without them none of my accomplishments would have been realized. I thank them for their unconditional love and support throughout my life. Their guidance and teachings are inherently the most important to me above all academic pursuits. So to my ”viejitos,” I say, ”es claro, que dios me a tocado con su gracia por darme los mejores padres una persona puede tener.” Secondly, I extend a great number of thanks to my advisor Timothy I. Matis. His enthusiasm and attitude of life made working on my research a great experience. I thank him for his advisement concerning both academic and personal issues. I would also like to show him my gratitude for believing in me and his friendship, which were the primary reasons for my success and perseverance. I give thanks to my committee members Mike Bartolacci, Terry Collins, John Kobza, and Milton Smith for their insight and guidance in the structuring of this work. The diversity in their knowledge base was most helpful in the refining of this work. Their unique specializations proved most helpful in making this research possible. I would also like to thank my friend and colleague Raja Jayaraman for all his help throughout. I would also like to extend a thanks to Prof. Alfredo Goldman and Mariana V. Bravo from the University of Sao Paulo for the provision and use of their AODVjr code. I would like to thank Aaron Phillips for his assistance with the data gathering requirements of these experimentations. Thus, this accomplishment was only possible due to the wonderful people who surrounded me throughout these past years.
ii
Texas Tech University, Ivan G. Guardiola, December 2007
TABLE OF CONTENTS Acknowledgements . . . . . . . . . . . . . . . . . . . . . . . . . . . . . . . Abstract . . . . . . . . . . . . . . . . . . . . . . . . . . . . . . . . . . . . . List of Tables . . . . . . . . . . . . . . . . . . . . . . . . . . . . . . . . . .
ii v vi
List of Figures . . . . . . . . . . . . . . . . . . . . . . . . . . . 1. Introduction . . . . . . . . . . . . . . . . . . . . . . . . . . 1.1 A Brief Introduction of Wireless Communications 1.2 Wireless Mobile Ad-Hoc Networks . . . . . . . . .
. . . .
. . . .
. . . .
. . . .
. . . .
. . . .
. . . .
vii 1 1 3
1.3 1.4 2. Problem 2.1
. . . .
. . . .
. . . .
. . . .
. . . .
. . . .
. . . .
6 7 9 10
2.1.1 Large-Scale Attenuation . . . . . . . . . . . . . . . 2.1.2 Small-Scale Effects and Fading . . . . . . . . . . . . 2.1.3 Details of Multi-Path Ricean Fading . . . . . . . . 2.1.4 Details of Multi-Path Rayleigh Fading . . . . . . . 2.2 General Statistical Interpretation of Multi-Path Fading
. . . . .
. . . . .
. . . . .
. . . . .
11 13 14 17 18
Fading of the Wireless Signal . . . . . . . . . Chapter Summary . . . . . . . . . . . . . . . Statement . . . . . . . . . . . . . . . . . . . Statistical Implications of Multi-Path Fading
2.3 Type I and II Errors Visualized . . . . . . 2.4 Chapter Summary . . . . . . . . . . . . . . 3. A Survey of MANETs . . . . . . . . . . . . . . . . . 3.1 Characteristics and Challenges of MANETs
. . . .
. . . .
. . . .
. . . .
. . . .
20 23 25 25
Dynamic Topology and Mobility . . . . . . . . . Asymmetric Link Characteristics . . . . . . . . Multi-Hop Communications . . . . . . . . . . . Decentralized Operations . . . . . . . . . . . . . Bandwidth-Constrained Variable Capacity Links
. . . . .
. . . . .
. . . . .
. . . . .
. . . . .
. . . . .
26 29 31 33 34
. . . .
. . . .
. . . .
. . . .
. . . .
. . . .
35 37 38 40
3.2.3 The Medium Access Control . . . . . . . . . . . . . . . . .
41
iii
. . . .
. . . .
. . . .
. . . .
. . . .
. . . .
3.1.6 Energy Conservation and Awareness 3.2 Fundamental Choices in Design . . . . . 3.2.1 The Network Architecture . . . . . . 3.2.2 The Routing Protocol . . . . . . . . .
. . . .
. . . .
. . . .
3.1.1 3.1.2 3.1.3 3.1.4 3.1.5
. . . .
. . . .
. . . .
. . . .
. . . .
. . . .
Texas Tech University, Ivan G. Guardiola, December 2007
3.3
Global Positioning System . . . . . . . . . . 3.3.1 Position-Based Protocols in MANETs . . 3.3.2 Current Position-Based Routing vs. GPS 3.3.3 Impact of GPS Inaccuracy . . . . . . . . 3.4 Chapter Summary . . . . . . . . . . . . . . . 4. Methodology I: Fading and Protocol Overhead 4.1 Simulation Design . . . . . . . . . . . 4.2 Results of Overhead Simulations . . . 4.3 Chapter Conclusions . . . . . . . . .
. . . .
. . . .
. . . . . . . . . . . . Blocking . . . . . . . . . . . . .
. . . . .
. . . . .
. . . . .
. . . . .
43 44 48 51 55
. . . .
. . . .
. . . .
. . . .
. . . .
. . . .
. . . .
. . . .
. . . .
. . . .
. . . .
. . . .
56 57 59 66
5. Methodology II: The Blocking Mechanism . . . . . . 5.1 Modification of NS-2.31 . . . . . . . . . . . 5.2 Simulation Design . . . . . . . . . . . . . . 5.2.1 The Statistical Design of Experiments .
. . . .
. . . .
. . . .
. . . .
. . . .
. . . .
. . . .
. . . .
. . . .
. . . .
. . . .
67 70 73 76
5.3 Results of the GPS-Blocking Simulations 5.4 Chapter Conclusions . . . . . . . . . . . 6. Closing Discussions . . . . . . . . . . . . . . . . . 6.1 Future Research . . . . . . . . . . . . . . References . . . . . . . . . . . . . . . . . . . . . . . .
. . . . .
. . . . .
. . . . .
. . . . .
. . . . .
. . . . .
. . . . .
. . . . .
. . . . .
. . . . .
. . . . .
80 96 97 97 99
. . . . .
Appendix A: Modification of NS-2.31 Source Code . . . . . . . . . . . . . . 105 Appendix B: Example TCL Script File . . . . . . . . . . . . . . . . . . . . 107
iv
Texas Tech University, Ivan G. Guardiola, December 2007
ABSTRACT This research considers the impact of fast fading effects on the discovery and maintenance of communication routes in mobile wireless ad-hoc networks. Moreover, it is a upon this consideration that fast fading directly impacts the performance of the underlying communication protocols for such networks. It is illustrated herein that protocol design should be based upon the consideration of the operating environments to which such networks are deployed. This research provides a statistical interpretation of link quality based on the instantaneous received power under various multi-path fading models, for which associated Type 1 and 2 errors are defined. Based on this viewpoint, this document proposes the embedding GPS information into a protocol in order to block the inclusion of unreliable links within the route of communication. This implementation results in a dramatic enhancement of the end-to-end performance of the mobile wireless ad-hoc communication network. Thus, this dissertation presents a general introduction to wireless communication networks and their inherent issues, and elaborates in detail this new statistical interpretation of fast fading and the results obtained from employing GPS information to realize an efficient protocol design methodology.
v
Texas Tech University, Ivan G. Guardiola, December 2007
LIST OF TABLES 3.1 4.1 4.2
Characteristics of The Forwarding Strategies . . . . . . . . . . . . . . Average Packet Delivery Fraction Summary . . . . . . . . . . . . . . Average Number of Forwarding Nodes Summary . . . . . . . . . . . .
48 61 63
4.3 5.1 5.2
Average End to End Delay Summary . . . . . . . . . . . . . . . . . . ANOVA Table for 4-Stage Nested Factorial Design with Mixed Effects Results for 4-Stage Nested Factorial Design with Mixed Effects . . . .
64 79 81
vi
Texas Tech University, Ivan G. Guardiola, December 2007
LIST OF FIGURES 1.1 1.2 1.3
Millions of handsets sold in first quarter of 2005. . . . . . . . . . . . . Dynamic Topological Changes in the MANET. . . . . . . . . . . . . . Illustration of Multi-Path Fading Sine Waves. . . . . . . . . . . . . .
2.1 2.2 2.3 2.4
Reflection and Diffraction of Wireless Signals. Model of Multi-Path Wave Interference . . . . Nominal Range of Transmission . . . . . . . . Simulated 802.11 Received Power Process with
2.5 3.1 3.2 3.3
Two node transmission with Multi-Path Fading The Categories of Mobility Models in Mobile Ad Different Antennas in a 3D Environment . . . . Illustration of Sparseness in Ad-hoc Networks .
3.4 3.5 3.6 3.7 3.8
Cluster Based Routing . . . . . . . . . . . . . . . . . Collisions in Mobile Ad-hoc Networks . . . . . . . . . The Global Positioning System Satellite Constellation The Expected Location of the Receiver . . . . . . . . The Receiver’s Decision . . . . . . . . . . . . . . . .
. . . . .
. . . . .
. . . . .
. . . . .
3.9 3.10 4.1 4.2
Position Service Error Visualized . . . . . Lingering Beta Error From Localization . . Fading & Overhead Simulation Design . . Average Delivery Fraction of Data Packets
. . . .
. . . .
. . . .
. . . .
. . . .
4.3 4.4 5.1 5.2 5.3
Average Number of Forwarding Nodes in a Route . Average End-to-End Packet Delay . . . . . . . . . . Schematic (simplified) of the Wireless Node in NS-2 Blocking Mechanism Simulation Design . . . . . . . Design Hypothesis Illustrated . . . . . . . . . . . .
. . . . .
. . . . .
. . . . .
5.4 5.5 5.6 5.7
Residual Plots for the Reliability . . . Reliability Observed . . . . . . . . . . Residual Plots for the Packets Received Number of Packets Received Observed
. . . .
. . . .
. . . .
5.8
. . . .
. . . .
. . . .
12 15 21 22
. . . .
. . . .
. . . .
. . . .
23 28 29 32
. . . . .
. . . . .
. . . . .
. . . . .
. . . . .
34 42 44 47 50
. . . .
. . . .
. . . .
. . . .
. . . .
. . . .
54 55 59 60
. . . . .
. . . . .
. . . . .
. . . . .
. . . . .
. . . . .
. . . . .
62 64 72 78 80
. . . .
. . . .
. . . .
. . . .
. . . .
. . . .
. . . .
83 84 85 87
Residual Plots for the Control Packets Generated . . . . . . . . . . .
89
vii
. . . .
. . . .
. . . .
. . . .
. . . .
. . . .
. . . . . . . . . . . . . . . . . . . . . . . . . . . . . . Rayleigh Fading
2 4 6
. . . .
. . . .
. . . . . . . . hoc Networks . . . . . . . . . . . . . . . .
. . . .
. . . .
. . . .
Texas Tech University, Ivan G. Guardiola, December 2007
5.9 5.10 5.11 5.12 5.13
Observed Control Traffic Generated . . . . . . Residual Plots for the Number of Intermediate Observed Average Number of Hop Nodes . . . Residual Plots for the Average Delay . . . . . Observed Average Delay . . . . . . . . . . . .
viii
. . . . Nodes . . . . . . . . . . . .
. . . . .
. . . . .
. . . . .
. . . . .
. . . . .
. . . . .
. . . . .
. . . . .
. . . . .
90 92 93 94 95
Texas Tech University, Ivan G. Guardiola, December 2007
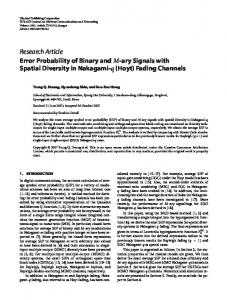
CHAPTER 1 INTRODUCTION 1.1 A Brief Introduction of Wireless Communications The pervasiveness of wireless communication systems and networks is quite evident. The attractiveness of mobility, flexibility, and availability are key features that make wireless technology so widely accepted by people from all walks of life. Perhaps one of the most prevalent wireless communication systems is the cellular telephone. The cellular phone system has come a long way since it was first developed in the 1970s by Bell Laboratories in the United States (MacDonald, 1979). The cellular phone allowed a subscriber to be capable of placing and receiving telephone calls through the existing wire-line network via access points that provided cellular coverage. This new form of communication forever changed wireless communication technology. Predominantly, this change can be attributed to the fact that it was the first instance in which wireless communication was available to an entire population of people. This capability to communicate with other people reliably and with the freedom of movement and location was quickly accepted by the populous (Padgett, Gunther, & Hattori, 1995). Wireless communication has become a norm amongst our highly mobile and information hungry society. This acceptance can be put into perspective by the large amount of cellular phones sold. In 2005, 810 million cellular phones were sold worldwide, which is an increase of 13.6 percent from 2004, according to research firm iSuppli Corporation (Frenzel, 2006). The growth of the cellular phone is astonishing. In (Frenzel, 2006), such growth is illustrated in the sales of cellular phones during the first business quarter of 2005 as shown in Figure 1.1. Such wide-spread use of the cellular networking system provides an insight into the popularity of all wireless communication technologies. These other technologies include wireless communication through computers which provide access to email and the world wide web. In (Varshney & Vetter, 2000), it is argued that the growth of wireless and mobile computer networks can be credited to the demand brought about by an increasingly mobile workforce. These emerging wireless networks come in a variety of forms such as Wireless Local Area Networks (WLANs)(LaMarie, Krishna, & Bhatwat, 1996), Wireless Local
1
Texas Tech University, Ivan G. Guardiola, December 2007
Millions of Units
300 250 200
173.5
187.5
Jan-05
Feb-05
210
239
150 100 50 0 Mar-05
Apr-05
Tim e (m onth/year)
Figure 1.1. Millions of handsets sold in first quarter of 2005.
Loops(WLLs)(Noerpel & Lin, 1998), and the mobile Internet Protocol (IP)(Perkins, 1997b). The WLANs, WLLs, and mobile IP wireless communication provide an oasis of wireless connectivity that can cover up to a 300 ft. radius where anyone with a laptop can access the internet and email. These oases are increasing in numbers and are referred to as ”hot spots.” Currently, these hot spots are being employed in hotels, restaurants, airports, college campuses, and many other public gathering places. Thus, these networks provide the user with the freedom to perform typical business duties and exchange information easily and reliably in a variety of locations (Cox, 1995). The previously mentioned mobile wireless communication systems and networks do well to provide the user with freedom from physical tethers. However, their performance and availability is determined by how well the underlying infrastructure has been engineered. These infrastructures are becoming overwhelmed by the mere volume of wireless communication users. The natural solution is to increase the infrastructure, which means the placement of more cellular base-station-antennas and hot spots. The installation of such infrastructure, however, has come under political fire in the past years, with more and more communities denying the communication providers infrastructure placement requests (J. Lin, 2004). This trend is problematic and poses a potential threat to the growth in cellular and wireless telecommunication networks. Thus, in the past several years, the development of a networking system that does not need pre-existing infrastructure or can provide larger areas of access via already existent infrastructure has been explored. These explorations are commonly referred to as
2
Texas Tech University, Ivan G. Guardiola, December 2007
Mobile Ad-Hoc Networks or MANETs. 1.2 Wireless Mobile Ad-Hoc Networks The need for the Mobile Ad-hoc Network (Perkins, 2000) has become obvious in our society. The MANET is considered one of the most robust wireless communication systems that has been developed in the past few years. Their robustness can be attributed to their capability to be quickly deployed to any situation or location. The MANET’s ability to provide reliable, efficient, and survivable communication make a MANET uniquely qualified in various important applications. These applications range in diversity, yet, the most well known are military networks, emergency/first response, and disaster relief efforts. These networking scenarios cannot rely on the existence of underlying infrastructure, which would otherwise supply centralized and organized connectivity to users in the network. In the previously mentioned scenarios, often the infrastructure is non-existent or is highly damaged. In particular, in the military scenario, the army does not have the capability to enter territories prior to the mobilization of assets in order to set up necessary communication infrastructure due to a hostile and aggressive engagement by the opposing force. In the relief effort scenario, the pre-existing infrastructure may have been highly damaged do to a large catastrophic event such as a hurricane or an earthquake. Thus, the deployment of a MANET to such scenarios would solve the communication problem by establishing a mobile autonomous self-configuring network that can handle the dynamics of such possible deployments. A MANET is an autonomous collection of mobile hosts that communicate through wireless links. A culmination of links amongst two or more hosts results in the establishment of a route that provides direct communication between any arbitrary transmitter receiver pair in the network. Hosts, or nodes, as they will be referred to for the remainder of this document, have the capability to play any of the following three major roles within the network. First, the node may be a transmitter/source, which is a node that initiates a communication demand. The node may also be a receiver/destination, which will be the node that the source intends to communicate with, and thus this node will be the end of a route. Finally,
3
Texas Tech University, Ivan G. Guardiola, December 2007
1
D D
4 1
2
2
5 3
5 3 S
4 S
A. Communication at time t0.
Β. Communication at t0+∆t.
Figure 1.2. Dynamic Topological Changes in the MANET.
nodes may also play the role of intermidiate/hop node, which act as passive nodes that will relay communication via themselves to establish a route for any other two source destination pair. It is important to note that a node may play one or more of the roles mentioned. Thus, at any given moment of time a node may not only be the source, but also a transmitter or hop node. Lastly, a node has the freedom to move throughout the operating environment at any speed or direction. The freedom of movement amongst the deployed network participants makes the networking topology change rapidly and is unpredictable over time. In Figure 1.2, it is illustrated that at time to the network’s configuration is such as illustrated in box A. At this particular time, the network is configured with a route amongst nodes {S, 3, D}, where nodes are the source, hop, and destination respectively. The dashed line denotes the route of communication, and the vectors denote movement and velocity for each node in the network. It is shown after some small amount of time, denoted as ∆t, the networks topology and changes due to mobility, and in order to meet the communication demand of S, the network reorganized the communication route to {S, 2, D}. This dynamic organization and coordination of routes is the responsibility of all the participating nodes in the network on an individual basis. These nodes rely on the underlying communication protocol in order to execute 4
Texas Tech University, Ivan G. Guardiola, December 2007
activities such as establishing and maintaining routes within the network. A protocol is the underlying logical programming that denotes when, where, and how nodes will react to the dynamic changes of the topology or communication demands within the network. Thus, the protocol is the logistical operations of how to manage communication, or rather, it is the basis for the establishment of routes, and the fixing of routes when communication become disrupted. All mobile wireless ad-hoc networks are decentralized, and all network activities are executed by the nodes. The MANET can configure itself into various forms in order to result as an effective communication solution to previously mentioned applications. The MANET, however, does not come without a fair share of issues in both performance and capability. The pressing issues of limited radio bandwidth, limited power supply, and delay continue to hinder the MANET’s capability to become a more reliable form of wireless communication. Moreover, the design of the protocol proves to be a difficult task no matter the application type. The difficulty of determining reliable routes in an ever changing environment is not a well defined problem within the wireless communication field. The factors of variable link quality, propagation path loss, multi-path fading, environmental interference, power expenditure and topological changes are all highly relevant issues when structuring and designing a communication protocol. It is trivial to notice the influence of these respective stochastic factors on the MANET’s overall performance, yet currently, protocol design is often deterministic in nature, and is often focused in alleviating one or more specific factors by adding application and operation specifics into the protocol in order to boost the overall performance of a MANET. This is accomplished through adding mathematically based algorithms that are focused on mitigating one or more of the factors. However, often these algorithms are designed so specifically for a given application that the MANET often loses its robustness as a communication solution. In addition, the computational overhead induced by such algorithms often results in larger delay, power consumption, and less throughput. Perhaps one of the most overlooked factors is the small scale variation in the signal, otherwise known as fading.
5
Texas Tech University, Ivan G. Guardiola, December 2007
1
0.8
0.6
0.4
AMPLITUDE
0.2
0
-0.2
-0.4
-0.6
-0.8
-1 0
1
2
3
4
5 TIME
6
7
8
9
10
Figure 1.3. Illustration of Multi-Path Fading Sine Waves.
1.3 Fading of the Wireless Signal Fading or specifically small-scale fading, is often described by a mathematical model that describes the distortion that a carrier-modulated communication signal experiences during its propagation through an operating environment. Thus, fading describes the rapid fluctuations of the amplitudes, phases, or multi-path delays of a radio signal over a short period of time or distance. Fading is caused when two or more versions of a transmitted signal arrive at the receiver with small amounts of time in between them. Therefore these signals, or multi-path waves combine at the receiver antenna, resulting in a signal that varies widely in phase as well as in amplitude, which depends on the distribution of the intensity, relative propagation time of the waves, and the bandwidth of the transmitted signal (Rappaport, 2002). An illustration of such a signal can be seen in Figure 1.3. It is clear that the signals displayed vary in phase and amplitude. Thus, if such a culmination of signals arrive at the receiver simultaneously, the signal will be highly corrupted from its original form, which causes the information to be unattainable from such a distorted signal. Shadowing, on the other hand, has a medium scale effect on the signal. The shadowing effect is observed when field strength variations occur, and this happens 6
Texas Tech University, Ivan G. Guardiola, December 2007
if the antenna is displaced over distances larger then a few tens or hundreds of meters or the signal passes through an obstruction (Bolanis, 1997). Thus, shadowing is also large scale due to large losses in the signal power as it is propagated over large distances and time. Shadowing and multi-path are both key issues that add to the stochastic nature of the MANET. It is through these inherent issues that a MANET’s performance is highly decreased. This decrease can be attributed to the fact that these effects are highly dynamic and stochastic in nature, thus deterministic thinking in protocol design hinders the overall robustness of the underlying MANET protocol. It is these effects of fading that often result in the use of malicious information about the signal strength and nominal communication range in the protocol decision making process and procedures. Deterministic protocols often break down in communication causing a large number of network activities, which increase the overall computational overhead of the nodes as well as contributes to the communication delay. Multi-path fading and shadowing effects are connatural to the operating environment of the MANET or the mobility levels of the MANET’s participants. As stated in Howard 2007, ”To understand wireless communication systems as it has evolved today is to know fading very well.” 1.4 Chapter Summary Although a variety of MANET protocols have been developed in recent years, they remain deterministic in design and do little to incorporate the stochastic nature brought about from the operating environment. Consequently, it is this lack of incorporation that results in poor performance in a deployed MANET. The underlying protocol of a deployed MANET has to be robust and must have mitigating mechanisms that consider these effects while in operation. Moreover, while certain protocols have been shown to increase the MANET’s performance in one or more particular metrics, often these protocols are case specific in design and lack operational robustness. Thus, as wireless communications continue to grow and increase in usefulness, it is the task undertaken herein which focuses on developing a more robust communication protocol, or mechanism that does well to incorporate some of the randomness brought about from the operating environment. It is the
7
Texas Tech University, Ivan G. Guardiola, December 2007
purpose of the latter chapters to present and validate one such attempt in protocol design that is particularly focused on mitigating the multi-path effects experienced by the signal as it is propagated in various operating environments. In addition to a design proposal, the areas of protocol overhead effectiveness, current protocol design, and finally a validation of such a design approach are presented in detail.
8
Texas Tech University, Ivan G. Guardiola, December 2007
CHAPTER 2 PROBLEM STATEMENT The research presented within is structured to validate a new fresh approach towards route discovery. Such an approach uses the well established and readily available Global Positioning System (GPS)(Parkingson & Gilbert, 1983) in order to gain position information on the network participants. This position information is then used in order to make a decision on whether or not the receiver should or should not participate in a particular route between any given pair of nodes that have propagated a communication demand. This decision then unequivocally causes a cessation of the use of unreliable links within a route. It does this by assuring that all communication is within a nominal range that is uninfluenced by the multi-path and fine grain variation of the signal and the nodes’ movements. It is necessary to develop a statistical interpretation of such a mechanism. This research culminates into a new protocol modification that can dramatically increase the reliability of link routes during the connectivity period. It has been noted that the establishment of routes with unreliable links, attributed largely to the fine grain variation in the signal, is a predominant factor in diminishing the end-to-end performance of well established protocols (Mullen, Matis, & Rangan, 2004). The unreliability often causes the connectivity to be lost during the critical time of data packet transmission. Thus, such a loss in connectivity therefore immediately ensues in maintenance activities and the subsequent rediscovery of routes, which creates excessive overhead and system congestion. Hence, it is proposed that GPS information will allow blocking of the inclusion of unreliable links in the discovered routes. This may be achieved for reactive protocols through the basic on-demand link distance calculation in the route discovery phase, from which each node determines if they will participate or remain passive in that possible route (Guardiola & Matis, 2007b). The statistical interpretation of multi-path in the wireless medium must be considered as a critical design motive.
9
Texas Tech University, Ivan G. Guardiola, December 2007
2.1 Statistical Implications of Multi-Path Fading Nearly all simulations of MANET routing protocols rely on mathematical models that predict received power as a function of distance, obstructions, radio carrier frequency, and many other factors (Calvin, Sasson, & Schiper, 2002; Neskovic, Neskovic, & Paunovic, 2000; Rappaport, 2002). These models, however, predict only the expectation of received power and do not take into account the fact that signal strength can vary from the predicted value by up to ±30dB. While there are numerous reasons that received power may rapidly fluctuate, usually the most significant in MANETs is due to multi-path fading (Linnartz, 1993; Rappaport, 2002). This fading is the consequence of mobility, which causes multiple copies of the same transmission on two or more paths of different lengths. The copies can either reinforce or partially cancel out each other. While methods exist to closely model multi-path fading, these methods often require a large amount of detailed information about the operating environment (Nidd, Mann, & Black, 1997). As a result, these modeling techniques prove to be limited in general application. As an alternative, robust models have been developed that describe the multi-path fading as a stochastic process. Such stochastic models are Ricean, Rayleigh, and Nakagami. In these models, the instantaneous received power of a given signal may be treated as a stochastic random variable that varies with distance, Pr (d), and the selection of a particular model associates a known probability distribution with this random variable. In particular, the probability distributions are the non-central chi-squared, the exponential, and the gamma distribution respectively for the previously mentioned multi-path fading models (Linnartz, 1993). It is such a statistical interpretation that is the main support for the statistical hypothesis that states that the power of a transmitted signal as perceived by the receiver is an effective measure of the reliability of said link. Thus, we begin by interpreting the basic statistical behavior of a signal by looking at the large scale attenuation model referred to as the Friis Free Space Model, then multi-path fading, and finally illustrating the statistical implications of multi-path in a general sense.
10
Texas Tech University, Ivan G. Guardiola, December 2007
2.1.1 Large-Scale Attenuation When modeling signal propagation, it is necessary to distinguish between large and small scale effects. Large scale is often in the order of hundreds or thousands of meters between a given transmitter and receiver. On the other hand, small-scale refers to a small distance in the order of a few meters spatially or temporally in terms of seconds. With this in mind the simplest propagation model is a free space propagation. This model considers a single communication path that is free from obstructions. Free space propagation does well in describing the propagation of direct line-of-sight microwave links. Perhaps one of the most well known of such models is the Friis free space equation, which states that the received power Pr at distance d obeys
Pr (d) ∝
λ2 Pt , 4πd2
(2.1)
where λ = c/f is the wavelength, f is the frequency, c is the speed of light constant, and Pt is the transmitted power. The Friis model results are best only in the far field region, which is defined to be 2
d > 2Dλ , where D is the largest linear dimension of the antenna. It is typical to choose a reference distance do and express Pr relative to this distance, so that
µ Pr (d) = Pr (do )
d do
¶−n ,
(2.2)
here the symbol n is called the path loss exponent. The value of the path loss exponent will increase as the number of obstructions increase in the line-of-sight path. These values have been determined experimentally for many different types of environments. Thus, it is considered to be the long range behavior of a signal. In a sense, this large scale effect essentially represents the expected signal strength within any environment. While the Friis equation is considered the most popular form of calculating the signal power for the purpose of simulation, other basic models exist that incorporate other signal behavior factors such as reflection and diffraction. It is 11
Texas Tech University, Ivan G. Guardiola, December 2007 %ULJKW�=RQH
$EVRUEHG
7UDQVLWLRQ� ���������=RQH 'LIIUDFWHG�3 DWK 6RXUFH
WHG
5HIOHF
6KDGRZ �=RQH
7UDQVP L
WWHG
5HFHLYHU
1RLVH�%DUULHU
Figure 2.1. Reflection and Diffraction of Wireless Signals.
important to consider that it is rare to operate within an environment that has a direct line-of-sight between wireless antennas, free from obstructions. One basic consideration that must be undertaken is to consider the occurrence of reflection, which is caused when a signal encounters a large surface with certain optical properties. These surfaces can largely vary. However, an example of such surfaces are the earth’s surface, or building walls. The plane earth loss model is a simple propagation model to employ when we consider the interference between a line-of-sight and a reflected ray. In such an operating environment the path loss coefficient of the previous model has been shown to be n = 4 (Laasonen, 2003). Yet, reflection of the signal is not the only consideration to be made when dealing with large scale effects. Diffraction is also of high interest, which is what makes signals capable of propagating around edges and beyond the horizon. Thus, these refer to various phenomena associated with wave propagation, such as bending, spreading and interference of waves of all forms. Perhaps an example of this is a music CD as it is turned on its underside where the closely spaced tracks are. It is easy to notice the color of the rainbow, which is directly related to the diffraction of light on the edges of each track. See Figure 2.1 for illustration of both reflection and diffraction. However, it is important to note that often the actual signal strength is higher than as estimated through reflection and diffraction models. This difference in signal strength can be attributed to scattering, which occurs when a signal 12
Texas Tech University, Ivan G. Guardiola, December 2007
encounters a large number of obstacles in its propagation path, and also due to fine grained variation in the form of small scale effects. Thus, we consider the large scale attenuation of a signal as an indicator of the signals intensity at a given distance from the receiver. In particular, it is considered within this document that we can use the large scale attenuation model to derive the expectation of the signal’s power for a given path of length d. In the latter, it is explored how this expectation is used to derive the fine grained variation of a signal within specific operating environments, which is used as the mean of the distribution of the small scale effects. This results in an accurate representation of the true signal behavior since it will have both large scale and small scale effect estimations. The discussion is now shifted to elaborate on the statistical description and details of the small scale effects such as Ricean and Rayleigh distributions of signal variation. 2.1.2 Small-Scale Effects and Fading The incorporation of the small scale effects is necessary when simulating the signal behavior encountered within a deployed MANET. A radio signal can be received many times even if there is a single line-of-sight link present. The reception of various copies of the same signal that has been reflected or diffracted is problematic. The collections of these multiple signals is otherwise known as multi-path waves. As they arrive at different times, they gain the attributes of different phases and thus interfere. The resultant signal can vary widely with apparently small changes in time or receiver location and as expressed previously up to ±30dB. This is known as fading. The motion between the transmitter and the receiver causes frequency modulation because each of the multi-paths will have a different Doppler Shift. The observed frequency change is fd = v cos θ/λ, where v is the relative velocity and θ the angle between the signal path and the direction of movement. The reception times of the multi-path can be thought of as a sample about which statistical quantities can be computed. Thus, an example of this is delay spread, which is the standard deviation of the arrival times. On a similar note, the Doppler spread measures the spectral broadening caused by the relative motion of the transmitter
13
Texas Tech University, Ivan G. Guardiola, December 2007
or receiver. These parameters allow for the characterization of the channel. In addition to the channel, there are other contributing factors to the reception quality of a transmitted signal. These other factors are the bandwidth of operation, which determines the utilized frequency range, as well as the symbol period, that is, the time range allotted for the conversion of a binary digit into analog. The combination of signal and channel parameters result in various forms of fading. However, there are mathematical models that are associated with such signal and channel behavior. Two such models are the Ricean and Rayleigh fading models. These models are developed on the probability distribution of the multi-path arrival times that are based on appropriate parametric assumptions. In order to gain a relative understanding of the statistical implications of multi-path, a discussion of the employed models is necessary. 2.1.3 Details of Multi-Path Ricean Fading The Ricean1 fading case is that there is a direct, or at least dominant, component in the mix of the signals that reach the intended receiver (see Figure 2.2). It generates a stochastic distribution about a more firmly characterized mean amplitude value. Ricean and Rayleigh can be clearly applicable to the scenario, where there is an existence of many multi-path propagators getting to the receiver. The Ricean case is often considered a characteristic of short-term indoor propagation (Howard, 2007). Thus, with this in mind, we can clearly see its usefulness when developing and designing MANET protocols. Consider an unmodulated carrier transmitted by node i. In the typical Ricean channel, the received carrier is of the form
vi (t) = (Ci + ζi ) cos ωc t + ξi sin ωc t,
(2.3)
where the constant Ci represents the direct line-of-sight component, and the random variables ζi and ξi represent the in-phase component and quadrature component of the sum of the reflection. Thus, if the mobile node is moving, ζi and ξi are functions 1
The details explained in this and next subsections can be found in various sources see (Linnartz, 1993; Rappaport, 2002; Bertoni, 2000) for reference details.
14
Texas Tech University, Ivan G. Guardiola, December 2007
Ricean & Rayleigh-Fading (narrowband)
ansm m tr o r f na l
itter
sig
phasor addition
Node velocity and direction
Figure 2.2. Model of Multi-Path Wave Interference
of time. Ricean fading occurs if the central limit theorem can be applied to each of the in-phase and quadrature components of the reflected signals. This occurs if the number of reflections is large as well as none of the reflections dominate. If this is the case, then the variables ζi and ξi are independently Gaussian distributed random variables with identical probability distribution functions (pdfs), of the form N (0, qsi ). That is, Normally distributed with zero mean and variance equal to the local-mean reflected power qsi . The received carrier vi (t) can also be expressed in terms of the amplitude ρi and phase θi :
vi (t) = ρi cos(ωc t + θi )
(2.4)
with p (Ci + ζi )2 + ξi2 ¶ µ Ci + ζi θi = arctan ξi ρi =
The instantaneous amplitude ρi has the Ricean pdf (Green, 1989) µ 2 ¶ µ ¶ ρi ρi + Ci2 ρi Ci fρi (ρi | q si , Ci ) = exp − Io q si 2q si q si 15
(2.5)
Texas Tech University, Ivan G. Guardiola, December 2007
where Io (.) is the modified Bessel function of the first kind of zero order. The local-mean power, pi , is the sum of the power q di in the dominant component with q di = 12 Ci2 and the average power q si in the scattered component, that is pi = q si + q di . The K-factor of the Ricean distribution is defined as the ratio of the direct power and the scattered local mean power. Thus, K = qqdi . Performing a si
substitution gives q si =
pi 1+K
and Ci =
√
q 2q di =
2Kpi 1+K
Thus, the pdf of the signal amplitude, expressed in the local-mean power pi and the Ricean K-factor becomes
µ
fρi (ρi | pi , K) = (1 + K)e−K
1+K 2 ρi exp − ρ Io pi 2pi i
Ãs
2K(1 + K) ρi pi
! (2.6)
The instantaneous power pi , (pi = 1/2ρ2i ), has the non central chi-square pdf ¯ ¯ µ ¶ ¶ µr ¯ dρi ¯ (1 + K)e−K 1+K pi ¯ ¯ fpi (pi | pi , K) = fρi (ρi | pi , K) ¯ ¯ = exp − pi Io 4K(1 + K) dpi pi pi pi (2.7) Our measure Pr (d) = pi , where Pr (d) corresponds to the notation used in latter sections, has a non central chi-square pdf. Thus, we can consider the local-mean power to be obtained through the quantification of the free space model at some specified distance d (see Equation 2.2). Hence, our experimentation will be to determine the mean-local power of the transmitted signal through the free space model. In order to obtain the instantaneous power Pr (d), a realization of the non-central chi-squared distribution with a mean equal to the free space model quantity will be used. This will be elaborated upon in more detail in latter sections of this chapter.The Ricean model is not the only such model, however, we will, in a similar manner, consider the Rayleigh fading model.
16
Texas Tech University, Ivan G. Guardiola, December 2007
2.1.4 Details of Multi-Path Rayleigh Fading The Rayleigh density is most commonly associated with the envelope of a narrow-band Gaussian process. Rayleigh fading can be similarly interpreted. This form of fading occurs in the case where there are multiple indirect paths from the transmitter to the receiver, with no distinct dominant path. In this scenario there is no clear desired signal. The signals arriving at the receiver, instead, represent the summation of many multiple, independent, random variables. This interpretation allows us to employ one of the most powerful concepts of stochastic processes, which is the central limit theorem. Thus, this idea is that the sum of multiple, independent, random variables, under some constraints, converges to a Gaussian form. This proves to be convenient because Gaussian processes are so well defined and characterized. For a Gaussian signal, we can recognize that the envelop random variable of the signal in this type of fading represents a Rayleigh distribution. Therefore, the amplitude of the received signal varies stochastically within a range that is characterized by the one single adjustable parameter in the distribution, which determines both the maximum and the spread of the curve. The importance of this model is that it represents a worst case scenario where there is no one path of interest. This model proves to be the most mathematically tractable due to the assumptions made. The employment of such a model within the MANET context results in valuable insights into performance characteristics that can also be solidly mathematically based. Thus, the above scenario, where longer obstructed paths exist, results in Rayleigh fading. The power of the direct line-of-sight signal is small in comparison to the reflected signal power (Ci → 0, K → 0). In this case, the variance ζi and ξi is equal to the local-mean power pi : the phase θi is uniformly distributed over [0, 2π],and the instantaneous amplitude ρi has the Rayleigh pdf
µ ¶ ρi ρ2i fρi (ρi |pi , K = 0) = exp − pi 2pi
(2.8)
The corresponding total instantaneous power pi , (pi = (1/2)ρ2i = (1/2)ζi2 + (1/2)ξi2 ) received from the ith node is exponentially distributed about the mean power; that 17
Texas Tech University, Ivan G. Guardiola, December 2007
is,
¯ ¯ µ ¶ ¯ dρi ¯ p 1 i fpi (pi | pi , K = 0) = fρi (ρi | pi , K = 0) ¯¯ ¯¯ = exp − dpi pi pi
(2.9)
Thus, again it is stated that our measure Pr (d) = pi , such that the mean power is obtained from the large scale propagation model such as free space. Thus, through the above mathematical illustrations of both Ricean and Rayleigh fading, the discussion is shifted into elaborating the main concept presented within this research. Thus, the discussion continues by describing in detail the statistical interpretation and impact of fading in MANETs. 2.2 General Statistical Interpretation of Multi-Path Fading The peruse of this research is to use Pr (d) as a measure that will determine successful communication between any given pair of nodes in the MANET. Successful communication consists of a packet of information successfully being transmitted and received with minimal structural errors. The fundamental, and somewhat simplifying assumption of this research is that there is a critical level of received power, pc , for which communication between any arbitrary pair of nodes will be successful if and only if Pr (d) ≥ pc , and not otherwise. In this context, a communication link is deemed reliable if communication is successful on average, that is Pr (d) ≥ Pr (ro ), where ro is the nominal range in terms of distance, such that the expectation of the instantaneous received power is equal to pc . There are other factors to signal quality, such as the Signal to Noise Ratio (SNR), that influence the probability of successful packet transmission, yet it is common to use received power thresholds as a primary measure of reception, as is done in many popular simulation languages. There are currently various simulator languages that encompass the wireless networking complexity. These simulators vary in capability, underlying assumptions, and efficiency that will be discussed in latter chapters in more detail. Reactive point-to-point protocols for MANETs have the advantage of only creating overhead on a necessity basis on local levels. Hence, they are scalable by nature and will be the only form of protocol type explored and analyzed within this 18
Texas Tech University, Ivan G. Guardiola, December 2007
research. Scalability becomes a problematic issue as the number of participating nodes in the MANET increase. Although proactive protocols can also be scalable in certain scenarios, their continuous and periodic information transmission often result in increasing overhead and congestion that hinders the overall performance of the MANET. These reactive protocols generally consist of two phases of configuration, the route discovery and maintenance phases. In the route discovery phase, the receipt of a route request RREQ or reply RREP by a node is a partial realization of the compound random variable P (d), where both Pr (d) and d are random. That is, we only observe the indicator function I[Pr (d) ≥ pc ] and only if I[Pr (d) ≥ pc ] = 1, where pc is the threshold power specified by the underlying technology. Thus, in most protocols, the null hypothesis Ho : d ≤ ro is immediately formed upon receipt of a RREQ or RREP, and the corresponding link becomes eligible for inclusion in a route. The validity of this null hypothesis, however, has a non zero probability of being false, β, as Pr (d) is a random variable whose realization may be larger than expected due to signal amplification caused by multi-path fading. If a β error has occurred, the link which appears to be reliable is in fact unreliable, and if included in a discovered route, which is not unlikely in protocols that are designed to establish routes with a minimum number of hops, this will result in an increase of overhead through the ensuing route maintenance and rediscovery activities (Cuoto, Bicket, & Morris, 2005). In the route maintenance phase, each link operates under the null hypothesis Ho : d ≤ ro , which is observable through handshakes in the medium access control (MAC) layer as I[Pr (d) ≥ pc ]. If I[Pr (d) ≥ pc ] = 0, the MAC layer will attempt to resend the data packet on the same communication link, and will continue to do so until the number of retries equals the short retry limit (SRL). It follows that the null hypothesis is rejected if and only if the number of consecutive failed retries,I[Pr (d) ≥ pc ] = 0, equal the SRL. Under this sampling scheme, the test of this hypothesis has both the capability of producing a false positive β and a false negative α. While multiple retries diminish the probability of a false negative, α → 0, they magnify the probability, albeit at a slower rate, of a false positive, β → 1. Hence, while retries are necessary to not trigger unnecessary route searches
19
Texas Tech University, Ivan G. Guardiola, December 2007
due to the α error, they perpetuate bad routes due to the β error as it becomes more difficult to discover unreliable links. From this statistical viewpoint, it is apparent that the resulting β error from the signal being greater in power than expected is far more critical than that of the α error from the signal being less than expected. In particular, α error is not present during the discovery phase, assuming that the intermediate nodes can not establish a route from cache searches, and it can easily be mitigated through maintenance retries. Yet β errors are present in both phases, and continuation of retries only magnifies this error. It follows that the reduction or elimination of β error in the discovery phase would lead to routes that are initially reliable, and would thereby relieve some effort in discovering these bad routes in the maintenance phase. Hence, it is for this purpose that GPS information could be used most effectively by reducing β through the reduction of discovered routes with unreliable links. This reduction in the β error can be done by evaluating the distance of a given link. Thus, upon receipt of an RREQ or RREP by the receiver, a basic Euclidean distance calculation is undertaken to deem the link to be reliable or the converse. If the receiver then evaluates this distance to determine that d ≤ ro , then this packet is processed and the respective link is included in the route. In Figure 2.3 it is illustrated that if ro has set the nominal range for communication, then through the execution of the previously mentioned Euclidian distance check, we have eliminated the unreliable links, which are illustrated as dashed lines, a result in only one path of reliable communication whose set contains nodes {S, 2, D}. This is explained in more detail in section 3.3.2 of this document. 2.3 Type I and II Errors Visualized In order to visualize the previously mentioned Type I and II errors, or α and β respectively, it is necessary to provide a theoretical simulation for the purpose of clarification. The provided simulation in this section is that of signal behavior under the large-scale path loss model in an open environment. Consider the redefinition of Equation 2.2 to define the expected received power to be,
20
Texas Tech University, Ivan G. Guardiola, December 2007
1
ro S
D
2
Figure 2.3. Nominal Range of Transmission
·
d E[Pr (d)] = Pr (d0 ) do
¸−n ,
(2.10)
where Pr (d0 ) = 3.1623 ∗ 10−2 milliwatts at do = 1 meters with an environmental loss factor of n = 3, which lies under a multi-path (Rayleigh) fading model whose simulated inverse transform is given by,
Pr (d) = E[Pr (d)]ln(1 − r),
(2.11)
where r is a pseudo-random number on the open interval (0, 1). A received power threshold of pc = 5.82587 ∗ 10−9 milliwatts yields a nominal range of ro ≈ 170 meters. Resulting possible α and β error, related to the route maintenance and discovery processes described in previous sections are respectively displayed in the lower left and upper right quadrants of Figure 2.4. The continuous line is the E[Pr (d)] and the dots represent the realization of Pr (d). The horizontal line that divides the quadrants is pc and the vertical line corresponds to ro . Note that the proportion of realized power levels that constitute α and β errors in this simulation 21
Texas Tech University, Ivan G. Guardiola, December 2007 milliwatts
Ro
Beta (Type II Error)
Pc
Alpha (Type I Error)
Meters
Figure 2.4. Simulated 802.11 Received Power Process with Rayleigh Fading
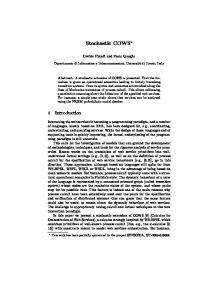
are considerable. In addition, there are a large number of β errors beyond ro up through 300 meters. The realization shown in Figure 2.4 are common to realizations of this process. In particular, the values above for {Pr (d), n, do , pc } are values that represent the technical specs of the Orinoco 802.11b card. However, in this simulation, there is no packet processing information and therefore it is completely theoretical. The Orinoco specs were employed to facilitate the understanding of the statistical viewpoint presented in previous sections. Consider another similar scenario of two nodes moving away at a constant velocity of 1 meter per second, while maintaining continuous transmission of 4 packets per second, which are 512Kbits in size, within an open environment. This scenario also employs the Orinoco 802.11b card, which has a transmit power of 15dBm and an operating frequency of 2.472GHz. It also employs the AODV protocol, and has CCK112 data rates. This card is simulated under Rayleigh fading in order to observe the implications of multi-path fading on the transmission channel. In Figure 2.5 it is observed that connectivity is inconsistent when multi-path is present. This inconsistency drastically influences the number of packets that reach the receiver. In addition, this scenario clearly demonstrates that the effective range of 2
Demodulation / Modulation rates of 11 corresponds to 11Mbps.
22
Texas Tech University, Ivan G. Guardiola, December 2007
7 6
Packets
5 4
Multi-Path
3
No Fading
2 1
154
143
132
121
99
110
88
77
66
55
44
33
22
11
0.02
0
Distance (Meters)
Figure 2.5. Two node transmission with Multi-Path Fading
communication is greatly decreased if the multi-path effects are considered. Thus, this simple scenario does well to show that although communication should not occur beyond ro , it is present due to the multi-path power addition. This addition is the primary reason for unreliable links to be included in a discovered route. The receiver believes that the link is good; however, this is a ruse caused by multi-path fading. 2.4 Chapter Summary The statistical implications of multi-path fading cannot be ignored in the design process of MANET protocols. These effects hinder the performance of a communication protocol due to the establishment of routes with links that are inherently flawed. This flaw is increased not only from the multi-path effect of amplification, but also from the fact that often control traffic is propagated at lower data rates than that of data packets. Hence, this results in control packets propagating further than data packets. This results in links that are subsequently formed for lower data rates rather then on the data rate. Thus, the proposition of using GPS information in order to reduce the number of unreliable links included
23
Texas Tech University, Ivan G. Guardiola, December 2007
within established routes does well in increasing the overall effectiveness of the underlying protocol. Participating nodes will remain in a passive mode if the basic Euclidean distance constraint brought about by the nominal range is not satisfied. Through the support of various simulations demonstrating the issues of errors as realized in a technology specific context will alow us to clearly note the validation of the context of this work. In the latter chapters the assumptions and methodologies undertaken to support the statistical interpretations of multi-path fading are elaborated upon. Thus, it is important to discuss in detail the issues that are inherent within MANETs.
24
Texas Tech University, Ivan G. Guardiola, December 2007
CHAPTER 3 A SURVEY OF MANETS The current research and innovations in MANET protocols is quite extensive due to the growth of applications for such a communication network. While there are many current directions within MANET research, only the significant sections that support this research are explored here. These subjects are the characteristics of mobile ad-hoc networks, the challenges facing mobile ad-hoc networks, and the fundamental choices in the design of such networks (Leiner, Neilson, & Tobagi, 1987; Corson & Macker, 1999). MANETs incorporate a wide range of knowledge that span various academic fields such as statistics, radar design, communication networks, electronics, logistics and many others. It is the purpose of this chapter to elaborate on the significance of current approaches to design, limitations, and the flaws of such a communication system. 3.1 Characteristics and Challenges of MANETs We have introduced the mobile wireless ad-hoc network in the previous chapters. Although the previous description of such a networking solution gave us an insight into how such networks operate, these networks are far more complex than previously illustrated. The characteristics that are inherent within a MANET make the design of protocols a highly perplexing problem. These characteristics must be addressed in due course in order to make a reliable, and perhaps more importantly, a robust protocol. Ad-hoc networks have several salient attributes, which are dynamic topologies, asymmetric links, multi-hop communication, decentralized operations, bandwidth-constrained variable capacity links, and energy conservation (Mukherjee, Bandyopadhyay, & Saha, 2003). Many protocols exist that do well to increase the performance of the MANET when the protocol’s design is based on one of the main characteristics of the MANET. This research varies in application specificity; however, it does well to explain each of the before mentioned issues and characteristics of the MANET.
25
Texas Tech University, Ivan G. Guardiola, December 2007
3.1.1 Dynamic Topology and Mobility The rapid unpredictable movement of the nodes in the network and the fast changing propagation conditions make network information obsolete (Mukherjee et al., 2003). These ever changing conditions lead to continuous network reconfiguration, which then results in frequent exchanges of control information over the limited network communication channels. Therefore, mobility directly impacts the number of failures as well as the activation of links within the network. This, of course, leads to an increase in congestion while the routing algorithm reacts to the topological changes induced by the independent mobility of the nodes (McDonald & Znati, 1999). The incorporation of mobility in any simulation or protocol analysis is crucial in order to truly evaluate the effectiveness and robustness of the routing algorithm. Links might also fail due to diverse sources of interference and packet collisions. These packet collisions and interference occur since most current wireless technology operates in a limited spectrum. Various users often emit signals at the same frequency band (Lenders, Wagner, & May, 2006). In (Lenders et al., 2006), the impact of human mobility is explored through an analysis of connectivity and lifetime route distributions in order to isolate breakage from mobility or signal interference. It is through such an analysis that we are able to support the notion that for small route lifetimes, the link breakage can be attributed to collision errors and interference, and conversely for longer lasting routes, the breakage is a result of mobility. Hence, the longer the link activation time the more likely that mobility will be the main source of failure. Similarly, it can be stated that the more data that has to be transmitted between any arbitrary receiver transmitter pair in the network mobility becomes the dominant factor. However, if data transmissions are of small quantities, then multi-path fading and other interference effects play a more principle role. Mobility is directly linked to multi-path fading in the sense that mobility leads to a Doppler Shift in the signal (Sollacher & Greiner, 2006). The relative motion of the two nodes, and whether they are moving towards or away from each other has an effect in the random frequency modulation (Rappaport, 2002). The Doppler Shift will be positive if the nodes are moving towards each other and negative if the nodes are moving in opposite directions. Rappaport continues by elaborating that if
26
Texas Tech University, Ivan G. Guardiola, December 2007
objects in the radio channel are in motion, then they induce a time variant in the phase component of the signal. Thus, if the surrounding objects move at a greater rate than the receiver node, this effect dominates the small scale fading. Otherwise, the mobility of the objects surrounding the node may be ignored and only the speed of the receiver needs to be considered. The coherence time is the time interval within which a propagating wave’s phase is, on average, predictable and defines the mobility of the channel. This explains how signals that are of the same bandwidth cause corruption in the transmission of data packets and control packets, which reduces the effectiveness of the MAC and Link Layer protocols. Since these scattering signals propagate in different paths, it results in multi-path effects at the receiver node. In (Robertson & Kaiser, 1999), a general model for path loss, carrier frequency shifts and signal time delay in multi-path environments is presented. They propose a method that reduces the power spectrum shift due to the Doppler Effect through a manipulation of the carrier frequency at which signals are being transmitted. Chu and Kiang (2004) explore the effects of the environment and analyze the difference between uplink and downlink channels. Moreover, it is their study of network architecture that is most significant. They emphasize that the network architecture can alleviate the effects of multi-path fading. They propose that through technical approaches the capability to reduce the effects of the operating environment and mobility is possible and thus increasing the MANETs performance. Current research in mobility and its impact on mobile wireless communications is highly diverse and application driven. However, various mobility models have been developed in order to derive better simulations that mimic real world employments of MANETs. In (Camp, Boleng, & Davies, 2002), a survey of current mobility models used for the simulation of MANETs is presented. Camp states that the performance of the underlying protocol can vary significantly with the employment of different mobility models. Thus, when the real life user mobility scenario is unknown, the researcher should make an informed choice on what type and structure of the mobility model to be employed should be. In (Bai & Helmy, 2007), a survey of MANET protocols are evaluated in which the mobility models are thoroughly categorized and illustrated (see Figure 3.1 as presented in (Bai & Helmy,
27
Texas Tech University, Ivan G. Guardiola, December 2007
Mobility Models
Random Models Random Waypoint Model Speed Decay Problem
Other Variations Random Direction Model
Models with Temporal Dependency
Models with Spatial Dependency
Models with Geographic Restriction
Gauss-Markov Model
Reference Point Group Model
Pathway Mobility Model
Smooth Random Mobility Model
Set of Correlated Models
Obstacle Mobility Model
Random Walk Model
Figure 3.1. The Categories of Mobility Models in Mobile Ad hoc Networks
2007)). Bai and Helmy propose that a well rounded mobility model must be developed in order to evaluate the performance of any MANET protocol. However, it is interesting that mobility is of such importance in protocol performance that the choice of user mobility essentially determines the effectiveness of the underlying protocol with no direct method of ranking the protocols under evaluation (Bai, Sadagopan, & Helmy, 2003). These mobility models differ greatly in structure, from cluster based mobility (Hong, Gerla, Pei, & Chiang, 1999; McDonald & Znati, 1999) to individual movement with obstacles (Jardosh, Belding-Royer, Almeroth, & Suri, 2003). This mobility awareness directly influences the protocol design decision. In (Sheth & Han, 2002), a mobility aware power conservative protocol was developed. Thus, the issues of mobility are a driving factor in the current research of MANETs, whether it is enhancing simulations to better mimic real world scenarios, or to increase the effectiveness of the routing algorithms. Mobility is one of the most prevalent issues concerning MANET performance since it affects not only the physical layer protocols but the link layer protocols as well. The ubiquitous stochastic nature of mobility within an active MANET is perhaps one of the main considerations all researchers must address in order to obtain reliable simulation results that can have relative effectiveness for comparison with real world situations.
28
Texas Tech University, Ivan G. Guardiola, December 2007
Node 3
Directional Antenna
Node 2
Omni Antenna
Node 1
Figure 3.2. Different Antennas in a 3D Environment
3.1.2 Asymmetric Link Characteristics Due to the stochastic nature of mobility, hardware, and the operating environment, bidirectional links are highly unlikely within a mobile ad-hoc network. These asymmetric characteristics can be attributed to a variety of factors such as different antennas on various wireless devices that have ad-hoc capabilities. It is common for devices to have different antennas since not all devices are manufactured by the same company. This results in devices that have differing power, geometry and coverage areas as antenna attributes. In Figure 3.2 such a scenario is illustrated. Suppose that node 1 wishes to communicate with node 3. We can see that node 1 is unable to reach node 2 since their elevation and antennas are different. Consider that node 3 has the same antenna configuration as node 2, then in such a scenario communication from node 1 to node 3 is impossible since there is only one unidirectional link that is capable of communication in such a network, which is from node 2 to node 3. This is perhaps one of the most overlooked issues in current wireless network research (Kotz, Newport, & Elliot, 2003). Kotz et al. (2003) states that, ”if I can hear you, you can hear me,” which clearly simplifies the 29
Texas Tech University, Ivan G. Guardiola, December 2007
reality under which MANETs truly operate and considers such a notion a ”mistaken axiom”. It is this simplification that often is detrimental to the research of any MANET. Hence, the evaluation of the impact unidirectional links have on current protocols must be considered. In (Prakash, 1999), one such evaluation is done in order to quantify the impact of unidirectional links on the popular Ad-hoc On Demand Vector (AODV), Dynamic Destination-Sequenced Vector (DSDV), and other protocols. Prakash suggests a manipulation of data reconfiguration in order to decrease the effects unidirectional links have on a mobile ad-hoc network. Even if symmetric relationships are present, it can vary widely. The mathematical illustration by Kotz et al.(2003) puts this into perspective. Consider the situation where, i can hear j and j can hear i. The amount of symmetry is variable. We define the signal-strength symmetry(SSS) of that pair to be
SSS(i, j) = min[SS(i, j)/SS(j, i), SS(j, i)/SS(i, j)]
(3.1)
except where both SS(i, j) = 0 and SS(j, i) = 0, which would result as SSS(i, j) as undefined. The min[.] forces SSS to range [0 : 1] and to zero when one of the nodes cannot hear the other. Thus, in a symmetric relationship, either SS(i, j) = 0 or SS(j, i) = 0, and SSS = min[∞, 0] = 0. Such a definition within an ad-hoc network allows us to quantify the amount of symmetry present in an ad-hoc network. In (Ganesan et al., 2002), it was noted that only 5 − 15 percent of the links in their sensor network were asymmetric. Asymmetry is ever-present within the wireless medium due to differences in physical technologies such as antenna configurations and transmission characteristics. In addition, the stochastic nature of mobility makes the possibility that a node may transmit in a direct line-of-sight link and moments later that link may become obstructed by objects such as a building make the design of protocols a difficult problem. However, it has been shown that if a protocol design does not consider the possibility of asymmetric links then it is likely to fail in the real world. Thus, the consideration of asymmetric and symmetric link possibilities must be considered when designing any MANET protocol. 30
Texas Tech University, Ivan G. Guardiola, December 2007
3.1.3 Multi-Hop Communications All nodes that participate in a MANET can play a variety of roles. These roles are a transmitter, receiver, or hop node1 . Since in MANETs there is no fixed positioned infrastructure, all routing must occur through intermediate nodes when large distances between the receiver and transmitter exist within the network’s topology. This use of other nodes to form routes is called multi-hop communications, and most all communication within a MANET employs such a technique to meet the communication demands within the network. The link based routes are susceptible to the capacity and movement of the other nodes. This issue is highly problematic when a sparse distribution of nodes in the operating environment is present. Multi-casting is an essential service in MANET operations. Thus, if sparseness is present there is a possibility that the network may become partitioned in which case some of the nodes may be unable to communicate with other nodes via intermediate nodes. In Figure 3.3, sparseness is illustrated in an ad-hoc network. In this scenario we have established a communication route and is depicted by the dashed arrows. The solid arrows show the direction and the velocity of the nodes. It is clear that node 4 will soon move out of the range of node 6 thus this route will break. Since the set of nodes S1 = {S, 1, 2, 3, 4} are moving in a downward direction and nodes in set S2 = {5, 6, 7, R} are moving in an upward direction. There will be a partition of communication within the network, which will not allow any nodes of S1 to communicate with with any nodes from S2 . In (Chen, Yang, Zhao, Ammar, & Zequra, 2006), a protocol is proposed that is particularly focused in timely delivery of communication demands as well as the transmission efficiency when spareness is present. Since nodes move independently and are power constrained, they may omit to participate in the network communication protocol. A methodology is proposed in (Hauspie, Simplot, & Carle, 2003) to predict when possible partitions may occur within the network. They arrive at the conclusion that such a prediction of sparseness is highly difficult due to mobility. The capability to predict when possible route failures will occur is important when trying to determine Quality of Service (QoS) of a given deployed network. The possibility of partitioning is an ever existing stigma of such communication networks and is almost impossible to 1
see Section 1.2
31
Texas Tech University, Ivan G. Guardiola, December 2007
1 R S 6 3 4
7 5
2
Figure 3.3. Illustration of Sparseness in Ad-hoc Networks
mitigate through basic logical operations due to its complexity. In (Khelil, Marron, Dietrich, & Rothermel, 2005), a method to manipulate the popular NS-2 network simulator in order to obtain partition information while simulating MANETs is presented. While partitioning in MANETs is unavoidable with such a simulation tool, we are able to explore the significance of such network behavior. Multi-hop communications is one of the most pervasive methods to accomplish communication within a MANET. A variety of protocols have been developed in the past years. Perhaps of these protocols the most popular are DSDV (Perkins & Bhagwat, 1997), TORA (Park & Corson, 1997), DSR (Johnson, 1994; Johnson & Maltz, 1996; Broch, Johnson, & Maltz, 1998), and AODV (Perkins, 1997a). In (Broch et al., 1998), they provide a realistic, quantitative analysis of the performance of the above mentioned protocols through simulation. This comparison illustrates in which situations these protocols begin to breakdown and begin to hinder the MANET’s performance. Broch and co-authors conclude that of all multi-hop protocols, DSR and AODV perform best in a large variety of scenarios. This multi-hop environment exists due to mobility and propagational effects of the operating environment as well as a lack of fixed infrastructure. Since there is no infrastructure in place, there is also no centralized control to manage communications amongst the network participants.
32
Texas Tech University, Ivan G. Guardiola, December 2007
3.1.4 Decentralized Operations In ad-hoc networks, there is no preexisting infrastructure and centralized control (Mukherjee et al., 2003), and the ability to organize communication within the network is a difficult task. Major sources of difficulty are scalability, power constraints, and congestion. However, researchers have approached the problem from various view points in order to obtain organizational control of communications within MANETs. The most prevalent methodology currently being employed by researchers is cluster based routing. The clustering of nodes allows for a hierarchy to be developed amongst the participating nodes, which results in a selective few nodes taking controlling positions within the network. The purpose of this is to control traffic within large scale ad-hoc networks (Mukherjee et al., 2003), while maintaining scalability. In (B. Das, Sivakumar, & Bharghavan, 1997; Jiang, Li, & Tay, 1999), two routing protocols are presented that employ the clustering of nodes in order to achieve basic communication control and organization. There have been various protocols designed with such a clustering structure in recent years such as the Cluster Based Routing Protocol (CBRP)(Jiang et al., 1999), and Layer Net (Bhatnagar & Robertazzi, 1990). The basis of CBRP and the clustering algorithm (Baker & Ephemides, 1981) are illustrated in Figure 3.4 in which a controlling node is chosen amongst each cluster, which is referred to as the cluster head of the group. Thus, if any node wishes to communicate with any other node it must be done so through the cluster head. If nodes of different cluster heads want to communicate they also must go through the cluster heads. This incorporation of cluster heads thus allows for communication control as the cluster head organizes all communications within its cluster as well as serves as the main point of contact for other cluster heads. The illustration of communication in Figure 3.4 is such that node 2 wishes to communicate with node 6. In accordance with cluster based routing, nodes A and B will control all communication within each of their respective clusters and are also responsible for all communication entering or leaving their clusters. In (B. Das et al., 1997), it is proposed that a spine may be formed within the network. Thus, a chain is formed from cluster head nodes. In such a proposed form of communication, the link between nodes A and B form a vertebrae of such a spine. However, these clustering techniques are proactive in nature since
33
Texas Tech University, Ivan G. Guardiola, December 2007
5
1
6
B
A 2 4
7
9
3
8
Figure 3.4. Cluster Based Routing
the cluster heads must maintain information about their neighboring nodes. Thus, clustering techniques come with a tradeoff. This tradeoff is that these routing algorithms, in high-rate topological changing environments such as ad-hoc networks and packet radio networks, trade the overhead due to topology update messages and the routing overhead (Krishna, Vaidya, Chatterjee, & Pradhan, 1997). The large amount of topological information processing do to periodic updating as well as network traffic requests make clustering techniques inefficient when it comes to power management and scalability. Although clustering methodologies offer better security aspects of ad-hoc networking, it comes with the high cost of reducing the life time of the deployed network through the large power consumption of periodic overhead processing and updates (Blazevic, 2001). Thus, the network is continuously transmitting over the already limited bandwidth and capacity constrained links. 3.1.5 Bandwidth-Constrained Variable Capacity Links Wireless communication will always have a lower capacity than that of their wired counter parts. In addition, the observed throughput of wireless communication is always less than that of the maximum allowed throughput of any given wireless technology. This is due to fading, multiple access, noise, and interference conditions that may exist (Mukherjee et al., 2003). These issues have their own unique impact 34
Texas Tech University, Ivan G. Guardiola, December 2007
on wireless communications within a MANET, which has been previously discussed in this document. Perhaps one of the most apparent effects of low and moderate link capacity is that it tends to increase congestion. This increase in congestion is caused through the limited amount of operating frequency bandwidth, which is directly connected to the amount of information that can be transmitted at any given time. Since the frequency band is highly controlled and allocated through the Federal Communications Commission (FCC), obtaining a free bandwidth spectrum is incredibly difficult (Toh, 2002). Perhaps one controversial issue concerning wireless ad-hoc communications is that since ad-hoc networks can be deployed at anytime, anywhere, it is not quite clear who should pay for the frequency bandwidth. This frequency bandwidth allocation should be highly analyzed due to the fact that if ad-hoc communications do not operate within a designated frequency band, this will be considered illegal communication by the FCC and will introduce high interference since most bandwidths have been allocated to other wireless systems. An example of this is microwave ovens, which operate at a frequency of 2.4GHz and can interfere with various WLAN communication networks. 3.1.6 Energy Conservation and Awareness The mobile nodes of any MANET rely on batteries and other exhaustible means for their energy. The duration of deployment of any MANET is determined by this limited power supply and its ultimate number of data transmission sessions is also predetermined through the size and capability of the power supply within each node in the network. However, the power supply problem is not only unique to MANETs but to all mobile wireless communication systems. The cellular phone of today has decreased in size dramatically over the last decade. This is due to technological advances in low power circuitry (Frenzel, 2006). However, the cellular phone does not have to deal with traffic routing and other responsibilities that a MANET node embodies. As previously stated in this document, each MANET node has to take on all the responsibilities in order to or help to establish routes within the network. Thus, a MANET node has more computational overhead than other wireless components such as cellular phones. This overhead therefore greatly decreases the overall lifetime of a node since every time it has to participate as a receiver,
35
Texas Tech University, Ivan G. Guardiola, December 2007
transmitter, or intermediate node it must use some of its limited energy to accomplish each of the tasks of the respective role. Power consumption is highly important in specific applications of MANETs and is the main design criterion within such applications. A similar power conscious application are static sensor networks. Sensor networks are comprised of nodes that are randomly deployed to a location, but unlike a dynamic mobile network, these sensor networks remain fixed in position once they are deployed. They then relay information about the deployed environment back to a location where the data can be analyzed and used at will by the deploying entity. Since these networks remain in a fixed position, these systems’ usefulness is determined by the amount of time that such a network can reliably monitor the environment of deployment. An application for such a system is a military sensor network. In such an application, the sensor network is deployed into a region that is controlled by the opposing force, in which the sensor network will gather information about movement of vehicles or personnel. Thus, sensor networks gather information and return that information via wireless links. Various methodologies have been developed in past years in order to optimize the power consumption of all MANET applications. These methodologies include protocols, algorithms of distribution of traffic, and energy conservation via transmission power reduction. Power is in all aspects of communication within the MANET. Hence, any protocol that reduces congestion, overhead, and delay will greatly impact the power conservation issue. If congestion is tackled, we can observe the benefits of power optimization in the form of a more uniform distribution of usage amongst all the participating nodes. Thus, nodes will omit or decrease their participation in the network as well the overuse of a particular node is avoided in order to conserve energy throughout the network. The uniform dispersion of networking and communication duties by the nodes themselves will greatly increase the lifespan of the deployed MANET. In order to maximize the total battery life of wireless networks, the energy consumption of the entire network must be minimized (Rodoplu & Meng, 1999). In (Rodoplu & Meng, 1999), a protocol is presented which tries to tackle the energy issue head on by decreasing the power consumption of the entire network. This protocol accomplishes the before mentioned task by
36
Texas Tech University, Ivan G. Guardiola, December 2007
reconfiguring the links dynamically as nodes move throughout the operating environment in order to more uniformly distribute traffic demands. Their proactive protocol periodically transmits GPS position information throughout the entire network in an effort to optimize the network topology. While this protocol does well to reroute traffic in an effort to reduce the overuse of particular nodes, it is not scalable and will begin to fail as the network size increases. Other methodologies include the use of random delay back off time at each of the participating nodes to decide whether or not that node will become a communication coordinator. (Chen, Jamieson, Balakrishnan, & Morris, 2001) present one such protocol in which each node bases its decision on an estimate of how many of its neighbors will benefit from it being an active communication protocol participant and the amount of energy that node has available. This type of routing algorithm does well to increase the overall lifespan of the MANET. In recent years, a variety of energy efficient algorithms have been developed (Wieseltheir, Nguyen, & Ephremides, 2001). Another methodology is to directly focus on the routing aspect of wireless ad hoc networks (Xu, Heidemann, & Estrin, 2006). Thus, it is noticed that tackling the other issues of wireless communication will often result in an impact of energy conservation within the network, which increases the overall lifespan of a particular deployed MANET. 3.2 Fundamental Choices in Design The design of any MANET is quite perplexing. As it has been shown in previous sections, all issues are inherently combined and one issue can either contribute to or mitigate other issues of wireless communications within a MANET. These characteristics that have been elaborated upon in the previous section are all salient in their own right and create a set of performance concerns for protocol design that extend beyond those guiding the designs of protocols for conventional networks with preconjectured topology. The decisions that encompass the engineering of a robust protocol must consider the fundamentals that are inherent in MANET communication systems. The fundamental design considerations are the network architecture, routing algorithms, and the medium access control (MAC)(Haas & Tabrizi, 1998). Thus, by making direct choices on these three fundamental
37
Texas Tech University, Ivan G. Guardiola, December 2007
considerations, we will have defined the application as well as the functionality of the MANET that will employ the protocol that is to be designed. The following sections of this document elaborate on these three main considerations of protocol designs and continue to support the notions of the GPS blocking mechanism within reactive protocols. 3.2.1 The Network Architecture Network architecture can be classified into hierarchal and flat (Haas & Tabrizi, 1998). These two main architectures differ greatly in the sense that these architectures define two very different modes of communication amongst the nodes in the network. In hierarchal architecture, the nodes in the network are dynamically separated into clusters. Each of these clusters then choose a cluster head or spokesman node for that cluster. Thus, all communication within the cluster is controlled by the cluster head. The cluster head then acts as the main routing switch between two nodes that reside in two different clusters or within the same cluster (see Figure 3.4). The cluster head of such a network is often determined through the employment of an algorithm (Banerjee & Khuller, 2002). This methodology has been widely explored in recent years; however, mobility causes problems to arise within such a communication scheme. The problems are that the network is continuously having to perform network updates since nodes are able to enter and leave clusters at any time. In addition, the determination of the cluster head is also periodically updated in order to assure movement does not hinder the communication control of the cluster. Various techniques have been developed to tackle these problems through a dually distributed approach of intra-cluster communication and cluster formation, which eliminates the need of the cluster head (R. Lin & Gerla, 1997). However, even with such innovations, the network overhead ensued from the reconfiguration of clusters and the assignment of nodes to specific clusters is considerable. In addition, bottlenecks will be created throughout the network when cluster head nodes are present. In hierarchal architecture, some nodes, such as the cluster heads and the gateway nodes, have higher utilization on all aspect of communication than the other participants in the network. The cluster heads tend to diminish their power source much faster, which results in a decrease
38
Texas Tech University, Ivan G. Guardiola, December 2007
of the overall lifespan of the deployed MANET. Nodes in such an architecture depend on the availability, capacity, and processing capability of the cluster head. Scalability is impacted by this methodology, since the number of nodes and the amount of traffic will influence the overall performance of the network. In contrast, a flat architecture has no clustering and neighboring nodes are allowed to communicate directly with on another. It has been argued that routing in flat architecture schemes is more scalable than hierarchal architecture schemes. The reasoning of this notion is that the network tends to balance the communication load among multiple paths, thus reducing the traffic bottlenecks that arise from having cluster heads. In this case of flat architecture, all nodes carry the same responsibility, and the reliability of the network does not rely on a single point of failure. However, flat architecture is not without its inefficiencies, which are bandwidth usage and scalability. Scalability worsens as the number of nodes increase. The inefficient usage of bandwidth is a result of the large number of control traffic that is propagated throughout the network in order to establish communication routes. This differs from hierarchal architecture since all control traffic is essentially controlled by the cluster head, thus reducing the control traffic significantly. The use of a flat network architecture is to be used within this research. The reasoning for employing this form of network architecture is that in a flat architecture, the nodes act on a more individual basis. Thus, in order to evaluate the impact of multi-path fading, link quality, and route reliability, we must be able to observe the individual links within the network. Since in flat architecture all the nodes carry the same amount of communication responsibility, it facilitates the observation and analysis of the link and routes within the MANETs. The network architecture type is directly related to the underlying protocol type. In order for nodes to maintain hierarchal type architecture, continuous network information is needed that must be periodically transmitted and all nodes must update their known topology. Thus, in hierarchal architecture a proactive protocol is employed. However, if a flat architecture is to be used, then a reactive protocol is being employed as it only activates on an on-demand basis.
39
Texas Tech University, Ivan G. Guardiola, December 2007
3.2.2 The Routing Protocol All existing protocols can be classified into two main types, which are proactive or reactive. In proactive protocols, routing information is known prior to any communication taking place. A proactive protocol does this through continuous network topological information exchanges. There are a variety of proactive protocols in which a variation of link-state and distance vector methodology is used. In particular, the wireless ad hoc network cluster based routing approach (Krishna et al., 1997) and the highly dynamic sequenced distance vector (Perkins & Bhagwat, 1997) protocols are two current protocols that are fully proactive in nature. Thus, such protocols determine the entire topology of the network prior to propagating any control traffic throughout the network. However, as the node mobility increases, such topological network information becomes obsolete quite quickly. In fact, for any given network capacity, there exists a network size and nodal mobility for which all the network capacity will be used by control traffic. Thus, if the network is moving quickly and is scaled to some given size, all the bandwidth channels will be allocated to the receiving and transmission of control traffic (Haas & Tabrizi, 1998). In a small network, however, proactive protocols often work better than reactive protocols since each node contains a cache table of all possible routes in the network. Hence, when a communication demand is activated, the nodes quickly establish routes through the filtering of their cached information. This results in almost a real time establishment of a route. In contrast, reactive protocols invoke a route discovery procedure on demand. The node which employs such a protocol will refrain itself from actively propagating its information until it is needed to participate. When a route needs to be established; some sort of flooding-based global search procedure is used in order to find a route between a receiver and transmitter pair. There is a significant number of such protocols for wireless ad hoc communication networks. The most common of these protocols are AODV (Perkins, 1997a), DSR (Broch et al., 1998), and TORA (Park & Corson, 1997). Thus, since the network does not know the communication route between two or more nodes, the result is a delay in communication. Reactive protocols are not capable of performing in real time, and this global search for a route can also result in an increase of control traffic since RREQs and RREPs are
40
Texas Tech University, Ivan G. Guardiola, December 2007
flooded throughout the network in order to establish communication routes. In this research, only reactive protocols will be explored and evaluated. This is done for various reasons such as reactive protocols are far more scalable than proactive protocols. In addition, in this research condensed networks are assumed in order to see the impact of fading. It is proposed that it is possible to mitigate the effects of fading through GPS information, which also increases the scalability of a wireless ad hoc network protocol. In particular the AODV protocol and the simple version of AODV known as the AODVjr protocol, were employed. 3.2.3 The Medium Access Control Designing an efficient and effective Medium Access Control (MAC) protocol with collision avoidance capabilities in mobile wireless ad hoc communication networks is quite a difficult task (Mukherjee et al., 2003). This difficulty arises from the self configuring characteristic of MANETs. The lack of infrastructure that would otherwise organize and control network communication results in decentralized communication within all deployed MANETs. Wireless ad hoc networks communicate through omnidirectional broadcasts in which all nodes in all directions must listen to said broadcast whether it is intended for them or not. In this context, it becomes increasingly important to ensure as much as possible a collision free communication environment. The possibility that there will be multiple communication demands by multiple receiver and transmitter pairs in the network is high. A collision occurs as two or more transmitters use the same transmission bandwidth to send messages. As these message propagates throughout the network, they collide with each other and can cause high levels of information corruption. In Figure 3.5, one such scenario is illustrated. In this scenario, we have two receiver and transmitter pairs, which employ one intermediate node simultaneously. Consider that Route 1 is actively sending information via Node I to R1 from T1. Now consider that Route 2 also becomes active, which means transmissions from T2 to R2 are occurring. The MAC protocol assures that node I completes communications between R1 and T1 prior to sending any information from T2 to R2. The MAC does not necessarily queue communication demands but also listens to assure that at the moment of a transmission, no similar messages of the same
41
Texas Tech University, Ivan G. Guardiola, December 2007
7�
5RXWH��
7�
5RXWH�� ,
5�
5�
Figure 3.5. Collisions in Mobile Ad-hoc Networks
operating bandwidth are also being propagated throughout the network. The MAC has the capability to switch back and forth from actively participating in Route 1 and Route 2, in order to assure that a propagated communication packet reaches its intended receiver with a low amount of collision error, which translates into data corruption. Thus, in our illustrated scenario, communication from Route 1 would be delayed slightly by node I in order to assure less corruption to Route 2 communications. However, the MAC should be actively controlling transmission from both T1 and T2 to reduce the interference seen by node I. The main purpose of the MAC mechanism in ad hoc networking is to ensure that collisions are minimized amongst the nodes under different conditions. However, such MAC schemes waste a considerable proportion of the network’s capacity by reserving the wireless medium over large operational areas. This is due to the fact that many of nodes must sit idle until ongoing communication stops. This is true even if the communication taking place does not concern a MAC controlled node. The most prevalent method being currently employed by researchers is the introduction of directional antennas, which greatly reduce interference since large sections of the operating environment are left open for communication as the signal has been dynamically orientated towards its intended receiver. Yet another form to optimize the usage of the limited wireless medium spectrum is to control the carrier 42
Texas Tech University, Ivan G. Guardiola, December 2007
frequency and signal transmission power dynamically by the nodes. This results, however, in the increase of nodal overhead. Such manipulations of the carrier frequency as well as signal transmission power often fails to accomplish its tasks of producing a collision free environment since the MANET is highly dynamic. It is almost impossible to properly calculate necessary transmission power or coordinate carrier frequency hoping. Thus, the interaction between the MAC protocol and the link layer protocol must be explored in order to assure that the MAC does not interfere with the logical programming of the link layer protocol. 3.3 Global Positioning System The Global Positioning System (GPS) (Parkingson & Gilbert, 1983) has been in use for many years and has become a popular feature in a variety of electronic devices. In communication components such as cellular phones and computers, GPS has allowed navigation, localization, and synchronization capabilities. In MANETs, GPS has spawned an interest since it is capable of delivering critical topological information about the dynamic mobile nodes with a low cost of power and overhead. This low cost of overhead is due to the fact that GPS information may be gathered whenever needed as the satellite constellation in orbit provides this information continuously (see Figure 3.6). Thus, one needs only to incorporate the hardware necessary to process the continuous information being broadcasted from the satellites in order to gain position information anywhere on the planet. This technology has increased greatly in accuracy and has also become cheaper to implement into electrical components. GPS technology can be used in a variety of ways within MANETs, and is a viable solution that can greatly improve a deployed MANET’s performance. There are a variety of protocols that take advantage of the location information that is supplied by GPS. These protocols often focus on improvement in routing capabilities, which result in a rapid route determination. The discussion of position based protocols is necessary in order to gain an understanding of how they are capable to deliver more efficient and reliable communication within a mobile ad-hoc network. Thus, the following subsections focus on discussing the fundamentals of position based protocols and the accuracy of GPS and its impact to the research presented within this document.
43
Texas Tech University, Ivan G. Guardiola, December 2007
Figure 3.6. The Global Positioning System Satellite Constellation
3.3.1 Position-Based Protocols in MANETs Currently a large number of protocols exist that are focused specifically on mobile wireless ad-hoc communication networks. However, many of these protocols have scalability and efficiency problems. As previously noted, protocols can be divided into two main types, which are proactive and reactive. Proactive algorithms employ classical routing strategies that have been modified from wired networking for wireless networking such as the distance-vector routing (e.g., DSDV (Perkins & Bhagwat, 1997)) or link state routing (e.g., OLSR (Jacquet et al., 2001)). In these proactive protocols all possible routes in the network are maintained through a cache system whether the route is active or not. This maintenance of inactive routes often occupies a significant amount of the the available bandwidth if the network topology changes frequently (S. Das, Castaneda, & Yan, 2000). Due to this inefficient use of the limited bandwidth, reactive protocols (e.g., AODV (Perkins, 1997a), DSR (Johnson & Maltz, 1996),and TORA (Park & Corson, 1997))were developed. Reactive protocols maintain information on only those routes that are active within the network, and thus this greatly reduces the burden on the network participants. Similarly to the inefficiencies of proactive protocols, reactive protocols also inherit their own flaws. First, delay is induced since the network must first establish a route prior to any communication packets being transmitted. Secondly, 44
Texas Tech University, Ivan G. Guardiola, December 2007
the maintenance of active routes can result in a large amount of control traffic, which also consumes the limited bandwidth as the network mobility and size increases. Finally, reactive protocols can result in large amounts of data loss as the network mobility results in the breakage and reestablishment of communication routes. In (Royer & Toh, 1999), a survey of these protocols is presented. These limitations have spawned a new form of routing protocols that make use of positioning capabilities in order to increase the efficiency of the limited wireless bandwidth spectrum. These routing protocols are referred to as position-based routing protocols, which differ from topological-based protocols since they use additional information in order to perform routing operations. All position-based routing protocols incorporate the capability to obtain the physical position of the participants in the network through positioning services such as GPS or some other form of positioning service (Capkun, Hamdi, & Hubaux, 2001). This position information is then used to make better decisions about forwarding strategies in the stochastic wireless ad-hoc network topology. Positional-based forwarding strategies result in less traffic congestion, less control traffic, and often in quicker route determination, which ultimately results in less communication delay within the network. As network topology is revealed to the nodes for small amounts of time. This knowledge is often stored in cache tables or is updated continuously through pings, which deliver more current details about a neighbor’s positional status. In current position-based protocols the routing decision at each node is based on the destination’s position contained within the packet header and the position of the forwarding node neighbors. The advantage to such communication logistics is that routing of this form does not require the establishment or maintenance of routes (Mauve, Widmer, & Hartenstein, 2001) since each forwarding node is capable of determining the destination’s position relative to its own and implementing a forwarding strategy that is impervious to previous communication routes. Thus, a previous route does not entail any significant information about the current route since mobility has made that previous route’s information outdated and has no significant information about the current network’s topology. Current position-based protocols incorporate forwarding strategies that are similar to those of topological-based protocols in the sense that they still employ algorithms, such as
45
Texas Tech University, Ivan G. Guardiola, December 2007
the greedy algorithm, in which a forwarding node forwards a packet to a node which is closer to the destination then the forwarding node itself. Thus, a forwarding node is greedy about the hop-count, which means it attempts to minimize the number of hop nodes for a given route. This strategy is often referred to as the most forward within some radius (MFR), where this radius is essentially determined by the nominal transmission range of the antenna of the mobile node. In such a forwarding strategy a forwarding node determines which node within its nominal range is the closest to the destination and forwards packets to that node. However, in (Hou & Li, 1986) it was shown that a different strategy performs better than MFR when the sender can manipulate its signal strength. In addition, this forwarding strategy is considered to be flawed since it does not consider the effects of fading, which can greatly effect reliability of communication within an expected communication range. Yet another form of routing is called nearest with forward progress (NFP), which is the transmission of packets to that node which are closest to the sender rather than the destination. In NFP, it has been argued that this reduces the number of packet collisions significantly (Mauve et al., 2001). These forwarding strategies employ GPS in order to increase the reliability or reduce the number of nodes that must partake in a given arbitrary pair of nodes communication route. There is one other forwarding strategy that makes use of position information more effectively and has resulted in two of the most popular position-based routing protocols in existence. It is the use of restricted directional flooding. Directional flooding is when a sender determines the expected destination’s location through a positional service and thus floods the network with control traffic or communication packets in that direction. This differs from topological protocols in the sense that flooding does not affect the entire network but rather a selective region. The protocols that employ restricted flooding are the popular Distance Routing Effect Algorithm for Mobility (DREAM) (Basangi, Chlamatac, Syrotiuk, & Woodward, 1998) and Location Aided Routing Protocol (LAR) (Ko & Vaidya, 1998). In both of these protocols, an expected position of the destination is determined and flooding occurs in the network in that direction only. This flooding restricts the network to only flood in that direction in which a particular sender expects the destination or receiver to be. This reduces the number of nodes that participate in the network. This of course then translates into
46
Texas Tech University, Ivan G. Guardiola, December 2007
T Expected Zone R
a Expected Region R Request Zone
r T
Expected Region in DREAM
Expected Zone in LAR
Figure 3.7. The Expected Location of the Receiver
scalability as the network will not be overcome with control traffic as rapidly as the network mobility or size increases. In Figure 3.7 an illustration of directional flooding is shown for both DREAM and LAR. Additionally, hierarchal approaches have also been developed in which position information is employed. One particular example of these protocols is the Terminodes project (Blazevic, 2001). Packets are routed according to a proactive distance vector scheme based on if the destination is close in terms of hops to the sending node. However, if the distance is large between the sender and receiver, then a greedy algorithm is used to determine the route. All of these routing protocols result in a more efficient use of the limited bandwidth available to the mobile nodes and does well to use the network topological information to reduce congestion or delay within a deployed MANET. Mauve et al. (2001) proposes that the nodes neither have to store routing tables nor do they need to transmit messages to update said tables; yet, another advantage to such communication protocols is that they support the delivery of packets to all the nodes in a graphical region in a natural way. This is because the participants are capable of viewing the current networks topology prior to initiating any communication route search overhead. A detailed survey of position-based routing as well as their shortcomings and details of operation is presented in (Mauve et al., 2001). Table 3.1, where n is the number of nodes, illustrates the characteristics of 47
Texas Tech University, Ivan G. Guardiola, December 2007
Table 3.1. Characteristics of The Forwarding Strategies Criterion Type Communication Complexity Tolerable Position Inaccuracy
Requires position on all other nodes Robustness Implementation Complexity
Greedy Greedy
LAR Restricted Flooding O(n)
Terminodes Hierarchical
Transmission Expected Range Region
Expected Region
No
Yes
No
ShortDistance Routing Range No
Medium Medium
High Low
High Low
Medium High
√ O( n)
DREAM Restricted Flooding O(n)
√ O( n)
the previous forwarding strategies and was obtained directly from (Mauve et al., 2001), which explains the complexity of each of the position-based forwarding strategies by separating them into type, complexity, tolerable position inaccuracy, if all nodes must know all other node’s position, robustness, and implementation complexity. In the latter section it is detailed how the routing scheme proposed within this dissertation differs from that of the before mentioned position-based routing algorithms. 3.3.2 Current Position-Based Routing vs. GPS Blocking In the preceding section a brief discussion of current position-based forwarding strategies was presented. All of these previously mentioned algorithms incorporate a positioning service in order to reduce the flooding space based on position information regarding the destination node, and all employ strategies that incorporate the position of the destination in order to forward the packets to nodes that are closer to the destination then the forwarding node itself. These algorithms are innovative and have shown to be quite robust as well as beneficial in various ways. The proposed GPS-Blocking Mechanism (GPS-BM), which is one of the main research aspects contained within this dissertation, differs from these position-based 48
Texas Tech University, Ivan G. Guardiola, December 2007
protocols. The primary difference is that the GPS blocking is used only during the route discovery phase of the protocol in order to block the inclusion of unreliable links within a given route. This is done by using GPS to determine whether or not the link is considered reliable from the perception of the receiver not the transmitter node. Thus, where current position-based protocols infer a decision based on the location of the destination, the GPS blocking mechanism makes its routing decision based on the current position of the transmitter as relative to the current forwarding node’s position. Consider that a forwarding node has just received a control packet from another node. That forwarding node determines whether it is within nominal range of the transmitter based on it’s position, which has been appended to the packet header. This nominal range is determined conservatively based from knowledge concerning the operating environment and that environment’s statistical characteristics. A receiver may obtain a packet that has been transmitted from a far away node well beyond the nominal range due to the amplification that is a result of fine grained variation. The purpose of this blocking mechanism is to reduce the acceptance of such packets by all receivers in the network. This reduces the number of packets that will be accepted by a given receiver as it will only accept those packets that were transmitted by receivers within a nominal range of the transmitter. Consider Figure 3.8, in which a route is to be formed from node S to node D. We now consider the view point of the node F. As flooding is initiated from node S, node F will receive multiple packets from various intermediate nodes such as nodes F1 and F2. F would thus determine whether nodes F1 and F2 are within communication range. The GPS-Blocking Mechanism determines that F2 is not. Thus, the packet received from node F2 is discarded and only the packet received from node F1 is accepted. Thus, the link between F1 and S is admitted to the route and link F2-F is not. Similarly, consider node F4, which has obtained a packet from S directly. It checks the distance between S and itself and deems the link unreliable. The packet is then discarded since the link which it arrived in is deemed unreliable. This is because F4 knows that the only reason for a packet to travel that far is due to some sort of fading induced amplification in the signal. Thus, it is the preventative mechanism that allows a node to decide whether to accept
49
Texas Tech University, Ivan G. Guardiola, December 2007
Nominal Range D F2
Un re
liab le L
ink
F F1
F3
ble lia Re Link
S F4
Figure 3.8. The Receiver’s Decision
communication from beyond nominal communication. This is only from perspective of the receiver and the destination’s physical position is irrelevant. This mechanism can be employed above any protocol and prevents reactive protocols from using links that are deemed unreliable due to amplification caused by multi-path fading. It is the purpose of this mechanism to only allow links within a route if they are deemed reliable given that we know the operating environments statistical characteristics (i.e. Ricean or Rayleigh fading environments). This mechanism stops the forwarding of packets from a transmitter that is beyond the conservative estimate of nominal range. Since it is uses the GPS positioning service, which is on demand, this form of blocking can easily be incorporated into reactive protocols. The only overhead addition is that all receivers in the network must calculate the distance from itself to the transmitter prior to processing the packet. This is insignificant and will only be done upon receipt of a packet and not otherwise. The statistical interpretation of this has been described in Chapter 2 of this document. However, GPS is not fully accurate and does contribute to the previously mentioned Type I and II errors of the network. The latter subsection elaborates upon this issue in more detail and discusses how the inaccuracy of GPS effects our previously stated hypothesis. The inclusion of such a mechanism that will eliminate the processing and inclusion of unreliable links will increase the overall network’s reliability as well as the other measures of throughput, less control traffic and 50
Texas Tech University, Ivan G. Guardiola, December 2007
others. This is because if more reliable links are used then the route’s reliability is increased. The experimentation process to prove this notion is described in the latter chapters of this document. 3.3.3 Impact of GPS Inaccuracy The inaccuracy of GPS contributes directly to the effectiveness of the proposed blocking mechanism. The accuracy and precision errors of GPS can be classified as those originating at the satellites, originating at the receiver, and error brought about by signal propagation (e.g. atmospheric refraction) (El-Rabbanny, 2002). The errors originating at the satellites are otherwise known as ephemeris or orbital errors, and are a direct result of Selective Availability (SA), which is an error that was intentionally fabricated by the Department of Defence (DoD) in order to degrade the accuracy of GPS for security purposes. However, in May 1, 2000, SA was turned off and therefore increased the accuracy of GPS. The errors originating at the receiver are clock, receiver noise, antenna phase center variations, and multi-path errors. The signal propagation errors include delays of the reception of the GPS signal as it must pass through the ionosphere and troposphere layers of the atmosphere as well as delay caused by passing though objects such as walls in the operating environment. Only in a vacuum can GPS travel at the speed of light. In any other environment, the signal succumbs to propagation effects. Finally, the accuracy of the GPS position calculations is affected by the geometric locations of the GPS satellites as seen by the receiver. The farther the satellites are from each other in relation to the receiver, the more accurate the positioning will be. The errors brought about from the positioning service of GPS can contribute a great deal of inaccuracy and will impact both the β and α errors presented in the previous chapter of this document. The quantity of error introduced by GPS in all its variations are significant. These errors can deviate the physical position of a particular node by significant amounts of distance. First, satellite positions are a function of time, which are included in the broadcast of the satellite navigation message, and are predicted from previous GPS observations at each ground control stations. The overlapping of previous GPS observations allows a given control station to predict the new orbital
51
Texas Tech University, Ivan G. Guardiola, December 2007
elements of the satellites. The modeling of the forces acting on the GPS satellites is not perfect, which causes some errors in the estimated positions of the satellites. This is known as the ephemeris errors of GPS (El-Rabbanny, 2002). According to (Shaw, Sandhoo, & Turner, 2000), the range error due to the combined effect of the ephemeris and the satellite clock errors is of the order of 2.3m in magnitude. In (Hofmann-Wellenhof, Lichtenegger, & Collins, 2001), it is proposed that nominally an ephemeris error is usually in the order of 2m to 5m and can reach up to 50m if SA is turned on. This problem seems to have a possible solution that is presently being implemented, which is known as differential GPS (DGPS). This form of positioning obtains various satellite positions from various ground control stations and differences the observations in order to gain an estimate of how much position error is being observed. This results in a large increase in accuracy of physical position determination, which is in the order of 10cm or 1 − 2decimeters. The ephemeris error can then be considered to be quite negligible since its magnitude is quite low whether DGPS is employed or not. Next, the error brought about from the satellite and receiver clocks can also contribute to the GPS positioning inaccuracy. These errors are common to all users that are gathering observations from the same data. However, through the use of differentiation much of this error can be eliminated. According to (El-Rabbany, 1994), applying the satellite correction in the navigation message can also correct the satellite clock errors; however, this leaves a lingering error of the order of several nanoseconds, which translates into a positional error of about 3cm for each nanosecond of error. On the other hand, the clock error introduced at the receiver is more significant, which can be mitigated through the differentiation of multiple observations. It may be treated as an unknown error when estimating the position since its influence is quite negligible. Currently, the more precise the clock within the receiver, the better. This better clock also comes with a significant cost associated with it that can reach up to $20, 000 dollars for a cesium clock within a receiver. The multi-path error distorts the original signal through interference with reflected signals at the GPS antenna. The advancement in receiver technology, actual pseudo-random multi-path, is reduced dramatically. For example, the Strobe Correlator and the MADLL are two such technologies. These are mitigation
52
Texas Tech University, Ivan G. Guardiola, December 2007
techniques that mitigate this error to a negligible order of a few meters at most in highly reflective environments (El-Rabbanny, 2002). Finally, the error precision and accuracy of GPS can also be affected by antenna-phase-center-variation and receiver measurement noise, which can attribute error in the order of 1 − 2cm and 0.6m. Thus, we can consider the error brought about from the antenna-phase-center-variation to be insignificant when compared to all of the previously mentioned errors, but the measurement noise can cause large variation up to a meter. It is not only this error but all of the worst case scenarios of the previously mentioned errors added together which makes the inaccuracy of GPS significant. In conclusion, GPS does introduce a large number of variations in the physical position determination of a node. If we consider the worst case scenarios of the previously mentioned error, GPS can be inaccurate in the order of 1 − 15m, which is significant. Thus, in order to effectively use GPS, we must consider this error as a contributor to the magnification of both the α and β errors proposed within this research. The α and β are affected by the inaccuracy of GPS in a very simple manner that can be dealt with appropriately. Consider the two possible cases: 1) The GPS position is closer than the actual position of the node and that node is outside of the nominal range, and 2) The GPS position is farther than the actual position of the node and is within the nominal range of communication. Figure 3.9 depicts the situation visually. It is important to remember what the respective α and β errors are conditioned upon. The α error can be described as the situation where the received power is perceived to be smaller than the technological threshold when the node is within the nominal range. In contrast, the β error depicts the situation in which the power is perceived to be strong when the corresponding transmitter lies outside of the nominal communication range. Thus, considering the previously mentioned cases, if the position realized by GPS is closer or perceived to be within the nominal range of communication when the node is in reality outside of the nominal range, then in such a scenario GPS inaccuracy contributes to the β error, and realizes case 1. On the converse, if a node’s position is in reality within the nominal range and the GPS realization of position is that is it outside of the nominal range then this scenario would contribute to the α error.
53
Texas Tech University, Ivan G. Guardiola, December 2007 Case 2: Ro
th s to
lph eA
r.
rro
ae
Case 1: Ro
R2
ute
ib ntr Co
GPS error case 2: position is given is farther then it really is. R
eB to th utes ib r t Con
S
Actual Receiver Position Regular error from the multi-path contributes to both Alpha and Beta.
rror.
eta e
R1
GPS error case 1: the position given is closer then it really is.
Source
Figure 3.9. Position Service Error Visualized
According to current research, the range of GPS position can attribute up to 15m of position variation. We can assume that the distribution of the error is Uniform throughout the range. Thus, any realization of GPS position error has equal probability of taking any value within the 0 − 15m range, therefore he variation of GPS position attributes to the α and β equally since they are both conditioned on two unique scenarios and have independent associated probabilities respectively. Through the incorporation of the GPS distance check, d 6 ro , which eliminates most of the β error that is caused due to environmental factors, it also introduces a new β error caused by the error contained within the determination d. A small range in which β error exists is now present due to the inaccuracy of GPS. In order to mitigate this error, a more conservative value should be chosen for ro , which will eliminate this lingering β error introduced from our positioning service. In a manner of speaking, this magnification of the β error is present only if a number of conditions have occurred at the receiver. These conditions are: 1) The receiver has obtained a large value of Pr (d), which is above the specified technological threshold, 2) a packet has successfully been transferred, and 3) GPS position of the receiver is determined. It is in condition 3 where this β error occurs since the position of the receiver needs to be determined through GPS as well as the 54
Texas Tech University, Ivan G. Guardiola, December 2007 GPS introduced error in the position of the reciever
GPS introduced error in the position of the source
S
R
GPS can give any realization of the position of the node within this range. Thus, position of the receiver and source are inherently flawed. Thus creating a new beta error.
Figure 3.10. Lingering Beta Error From Localization
position of the respective transmitter. Thus, it is in the calculation of the distance between the two nodes of a given link that presents this β error. The β caused by multi-path has been mitigated through the use of the distance check; however, the lingering β error is caused solely by the positioning service’s inaccuracy. 3.4 Chapter Summary It is through a thorough overview of current research endeavors that all of the problems and issues involving MANETs can be put into perspective. These issues and problems make the MANET one of the most unique research problems in existence today, which if tackled can result into a giant leap forward in technological knowhow and communication capabilities. It is apparent that all current research in this field is focused on tackling one or more problems at a time, while holding all other issues constant. However, as has been illustrated throughout this chapter, all problems and issues of MANET communications are entwined and often correlated. It is the purpose of this research to provide a new viewpoint towards tackling the issues inherent within MANETs. In the latter chapters experimental methodologies are elaborated upon, which support the proposed ideas contained herein.
55
Texas Tech University, Ivan G. Guardiola, December 2007
CHAPTER 4 METHODOLOGY I: FADING AND PROTOCOL OVERHEAD There have been many protocols developed in the past several years in an attempt to improve the end-to-end performance of the mobile ad-hoc network. In a broad sense, each of these protocols attempts to increase the end-to-end performance measures of the network in a scalable setting while minimizing energy consumption and overhead requirements. Once a general protocol has been established for a specific application, there are numerous incremental adjustments that are made by the research community, most of which add marginal control overhead in an attempt to realize larger end-to-end performance measure gains. However, a drawback to such a methodology is that through each incremental stage the robustness of the protocol of choice is reduced. While the performance measures increase for a specific application or network characteristic, those gains often do not carry over into a general application of said protocol. Thus, the usefulness of supplementary control overhead calculations is that of ultimately increasing the end-to-end performance of the mobile wireless ad-hoc network protocol; however, it is not effective when small-scale fading effects are considered. Thus, through analysis of simulations it can be shown that this increase of overhead does not in fact increase the end-to-end performance of the MANET when small-scale effects are considered, and is even further diminished as the network size is increased. These arguments are supported through a comparison of the AODV (Perkins, 1997a) and AODVjr (Chakeres & Klien-Berndt, 2002) protocols under differing small-scale fading environments and scaled areas of operations. In particular, the AODV protocol is a point-to-point reactive protocol which has been well developed, documented, and tested over time. This protocol is highly effective in performing well in mobile wireless ad-hoc networks for its capability to be robust within this complex environment. The AODV protocol relies on cached routing tables that are periodically updated through gratuitous packets that are propagated throughout the network. This cached table therefore supplies each node with critical information regarding active routes in the network. This routing algorithm makes decisions based on consistent maintenance activities of its routing tables. Thus, at
56
Texas Tech University, Ivan G. Guardiola, December 2007
any given time many nodes are sorting and updating their tables. As stated by Das et al. (2000), these maintenance activities result in considerable amounts of bandwidth usage, which can completely overtake the available bandwidth of the network when the network mobility and size increase. In contrast, the AODVjr protocol is a simplified version of the AODV protocol with considerably less routing and maintenance overhead. Unlike AODV, the AODVjr protocol allows only the destination nodes to reply to RREQs, and the first available route to the source is selected. This differs since in the AODV protocol intermediate nodes can establish routes by sorting through their cached route information. This inherently means that the first RREP to reach the source essentially determines the route that will be used for a specific communication demand. Thus, the AODVjr protocol removes the need for hop counts, gratuitous RREPs, hello messages, Route Error RRERs messages, which are sent back to the source when a break in the route has occurred, and precursor lists, which are inherent sources of control overhead of the AODV protocol. Through simulation, it can be shown that the additional control overhead of the AODV protocol does not significantly improve end-to-end performance over the AODVjr protocol as the network is scaled up in size, and fading models are incorporated. 4.1 Simulation Design High fidelity in simulations is necessary in order to produce more accurate performance measures. This fidelity can be increased through the incorporation of small scale fading models. The simulations undertaken were performed using the popular Network Simulator 2.31 (Fall & Varadhan, 2002) otherwise known as NS2.31 package. The simulations incorporated common values of technological specifications of an IEEE 802.11b wireless channel. In addition, the wireless channel was simulated under the Carnegie Mellon University’s small-scale fading model documented in (Punnoose, Nikitin, & Stancil, 2000). It is important to note that this model includes the doppler spread, which was set to a max velocity of 2.5m/s, thereby creating a complete high fidelity fast-fading envelop. The topology of these simulations are similar to those found in (Chakeres & Klien-Berndt, 2002); however, it differs by having small-scale fading included. In terms of specifics, three different
57
Texas Tech University, Ivan G. Guardiola, December 2007
environment sizes were considered, each with a specific number of active nodes that are allowed to move about that environment freely and randomly. In particular, the environment sizes of 500m2 , 750m2 , and 1000m2 , which have congestion levels of 25, 50, and 100 nodes respectively. These nodes move according to a random way point model with a velocity that follows a Uniform distribution that ranges from 0m/s to 5m/s. All simulations incorporated a randomized node placement, which was obtained from running the Carnegie Mellon University ”setdest” routine. This routine essentially randomizes the placement of the nodes within each environment size. The placement of the nodes differs from one environment size to another and defines the initial node placement from which the random way point model will begin. Thus, we can consider the movement of each node and its initial position in the environment to be randomized. The traffic pattern can also be considered to be randomized as the initial placement and movement model will define the active routes throughout the entire simulation time. In each simulation there are 10 source nodes which initiate a continuous communication demand for the entirety of the simulation time to 10 specific intended respective receiver nodes. These source nodes transmit five 512 − byte data packets per second at a constant bit rate (CCK111 ) along the established routes for the entire simulation time of 250 seconds. Sensitivity thresholds are common to those that describe the technical hardware specifications of the Orinoco IEEE 802.11b wireless card that has an expected or nominal transmission range of 172m. The sensing threshold was set to 5.012x10⁻¹² W and the received power threshold was set to 1.15x10⁻¹⁰ W to compensate for bit error rates. A standard transmission power value of 0.031622777W was used for a reference distance of 1m. The AODV implementation that is included in the base distribution of NS-2.31 was used. In contrast, the AODVjr code supplied by (Bravo, 2006) were used to evaluate the performance in each of the previously mentioned scenarios under no fading, Ricean-k fading with k = 6, and Rayleigh fading models. Figure 4.1 depicts the simulation design. Thus, three scenarios with 10 routes, which refers to ten receiver transmitter node pairs, are evaluated under the two protocols of AODV and AODVjr under the no fading model, the Ricean model, and the Rayleigh fading model. 1
11 Mbps
58
Texas Tech University, Ivan G. Guardiola, December 2007 Scenarios 500mx500m
750mx750m
1000mx1000m
Protocols AODV | AODVjr
Protocols AODV | AODVjr
Protocols AODV | AODVjr
Routes
Routes
Routes
1 2 3 4 5 6 7 8 9 10
1 2 3 4 5 6 7 8 9 10
1 2 3 4 5 6 7 8 9 10
No Fading | Ricean | Rayleigh
No Fading | Ricean | Rayleigh
No Fading | Ricean | Rayleigh
Figure 4.1. Fading & Overhead Simulation Design
The end-to-end performance measures extracted from the results of the simulation consisted of the end-to-end throughput, which is expressed as a packet delivery fraction, end-to-end delay, and forwarding hop counts for each route. The packet delivery measure consists of the relative frequency of packets received by the receiver over the total packets the traffic agent requested to transmit, which is 250s of five 512-byte packets. The delay is a measure of the amount of time the AODV protocol spent establishing routes or reestablishing routes. Finally, the hop count is the number of intermediate nodes that were necessary on average for each of the ten routes within each scenario. Thus, the results are detailed within the next section of this chapter. 4.2 Results of Overhead Simulations The simulation results reveal a great deal of insight about the impact that small-scale fading has on the MANET protocol’s performance. Perhaps one of the most significant measures is the packet delivery throughput, which is the amount of packets that were successfully transmitted from the source node to its intended destination node. The average delivery fraction of data packets is shown in Figure2 2
This research has also been shown in (Guardiola & Matis, 2007a)
59
Texas Tech University, Ivan G. Guardiola, December 2007 25 Nodes in 500m x 500m field
50 Nodes in 750m x 750m field 0.8
AODV AODVjr
0.9
Delivery Fraction
Delivery Fraction
1
0.8
0.7
0.6 NoFading
Ricean
Rayleigh
0.7
0.6
0.5 AODV AODVjr NoFading
Ricean
Rayleigh
100 Nodes in 1000m x 1000m field Delivery Fraction
0.7 0.6 0.5 0.4 0.3 AODV AODVjr
0.2 NoFading
Ricean
Rayleigh
Figure 4.2. Average Delivery Fraction of Data Packets
4.2 and summarized in Table 4.1. It is important to note that each number displayed corresponds to the average of the number of packets received in ten routes within each of the fading environments and respective environment sizes. Through a brief observation of the results displayed in Figure 4.2, we can clearly see that the average delivery fraction is impacted by the small-scale fading, with a magnitude both greater and less than the case in which no small-scale fading model is used. It can be observed that AODV noticeably outperforms the AODVjr protocol when small scale fading has been omitted. However, in the scaled networks of 50 and 100 nodes the performance of the AODVjr increases above that of the AODV protocol under both the Ricean and Rayleigh fading models. This is so because small-scale fading may cause the instantaneous power of the signal to be attenuated or amplified. The interest lies in the case where the signal has been amplified by the small-scale fading model since it gives the receiver the perception that the link is of a reliable status when in fact that signal strength observed is only one realization of a stochastic small-scale fading model. Thus, the receiver makes a bad judgement 60
Texas Tech University, Ivan G. Guardiola, December 2007
Table 4.1. Average Packet Delivery Fraction Summary
Environment Size Number of Nodes 500m2 25 25 750m2
50 50
1000m2
100 100
Packet Delivery Fraction Protocol No Fading Rayleigh Ricean AODV 0.98 0.72 0.77 AODVjr 0.92 0.68 0.73 Difference 0.06 0.04 0.04 AODV 0.72 0.48 0.62 AODVjr 0.63 0.46 0.66 Difference 0.09 0.02 0.04 AODV 0.51 0.33 0.66 AODVjr 0.15 0.42 0.67 Difference 0.36 0.09 0.01
call by basing its routing decisions on this one realization that does not have any sound basis to supply the receiver with long term performance capabilities of the link. This leads to the establishment of unreliable routes in the discovery phase since the links which make up a route are unreliable themselves. The case of 25 nodes, which are limited to the tight network area of operation of 500m2 and have a nominal transmission range of 172m, will not need many intermediate nodes within their routes even in the worst case scenarios. Also, the links in these routes are likely to remain quite reliable throughout the entirety of the simulation time of 250s. Thus, it is such a condensed network that the cache table for the active routes in the network of AODV are likely to stay useful throughout the entire simulation. In these types of scenarios the usefulness of gratuitous RREPs, hop counts, and other overhead processing is reinforced since, in such a network, they contribute to the end-to-end performance of the protocol. As the network size is expanded, however, the average number of forwarding intermediate nodes increases, as noted in Figure 4.3 and is summarized in Table 4.2. This is a result of the AODV protocol’s main optimization criterion, which is to select routes with the smallest number of hops from the source to the receiver and these links being unreliable due to signal amplification of small-fading (Cuoto et al., 2005). This trend becomes more pronounced as the magnitude of the stochastic 61
Texas Tech University, Ivan G. Guardiola, December 2007 50 Nodes in 750m x 750m field 3
2
2.5
Number of Hops
Number of
Hops
25 Nodes in 500m x 500m field 2.2
1.8 1.6 1.4 AODV AODVjr
1.2 NoFading
Ricean
Rayleigh
AODV AODVjr
2 1.5 1
NoFading
Ricean
Rayleigh
100 Nodes in 1000m x 1000m field
Number of Hops
4 AODV
3.5
AODVjr
3 2.5 2 1.5 NoFading
Ricean
Rayleigh
Figure 4.3. Average Number of Forwarding Nodes in a Route
behavior is increased from the employment of the Ricean and Rayleigh models, and as the size of the network is scaled from 50 to 100 nodes. The utility of the additional overhead inherent within AODV does not significantly increase the data packet delivery fraction. The hop count is also highly influenced by the fading models since the signal is being amplified throughout the network. Thus, the receiver and transmitters establish routes with less nodes on average; however, the number does not shift dramatically. The hop count, although reduced by fading, does not seem to favor AODV nor AODVjr for which seem to have similar values in the fading environments. The advantage of AODV’s additional overhead is not apparent as both protocols seem to perform equally if fading is considered. The average end-to-end delay in the delivery of data packets is given in Figure 4.4 and is summarized in Table 4.3. As a result of not using gratuitous RREPs from cached tables, the AODVjr protocol requires more processing time to rediscover routes following link breakage in an established route. Thus, AODV outperforms AODVjr when the network is either condensed or no fading effects are considered. 62
Texas Tech University, Ivan G. Guardiola, December 2007
Table 4.2. Average Number of Forwarding Nodes Summary
Environment Size Number of Nodes 500m2 25 25 750m2
50 50
1000m2
100 100
Number of Forwarding Nodes Protocol No Fading Rayleigh Ricean AODV 2.11 1.45 1.79 AODVjr 1.56 1.19 1.79 Difference 0.55 0.26 0 AODV 2.95 .98 1.82 AODVjr 2.41 .89 1.53 Difference 0.44 0.09 0.29 AODV 3.74 1.71 1.24 AODVjr 3 1.5 2.19 Difference 0.74 0.21 0.95
However, similar to the delivery fraction metric, this does not hold when small-scale fading models are considered or the network is scaled up in size. There is a noticeable exception to this performance in the case of the 50 node network under the Ricean fading model. Note in Figure 4.4 that for this scenario, the packet delivery fractions and the average forwarding hop count metrics are both similar for AODV and AODVjr, yet the end-to-end delay metric of AODVjr greatly exceeds that of AODV. This is likely to be a result of many link breakages on the established routes in this simulated instance, and the time required by the AODVjr protocol to reestablish routes through a route discovery phase required a proportionally longer time than AODV, which was not expected. Thus, the AODV protocol was more capable to deal with the link breakages and capable of maintaining those routes through using intermediate nodes to find a new link, unlike AODVjr, which abandons the route and requests a new route, rather than trying to fix or mend the current route. The reliability of these new routes, however, was of a sufficiently high degree to provide comparable performance to the AODV protocol, whose routes were quickly mended or fixed from the use of its active route cache table, in end-to-end throughput. Communication will be successful on average for receiver/transmitter pairs within the nominal range and unsuccessful on average beyond this range, from which we derive the terms reliable and unreliable 63
Texas Tech University, Ivan G. Guardiola, December 2007
25 Nodes in 500m x 500m field
50 Nodes in 750m x 750m field 2
1.2
1.75 Delay (sec)
Delay(sec)
1 0.8 0.6 0.4
AODV
0.2 Ricean
1.25 1 0.75 0.5
AODVjr
0 NoFading
AODV AODVjr
1.5
0.25
Rayleigh
NoFading
Ricean
Rayleigh
100 Nodes in 1000m x 1000m field 7
Delay (sec)
6
AODV
5
AODVjr
4 3 2 1
NoFading
Ricean
Rayleigh
Figure 4.4. Average End-to-End Packet Delay
Table 4.3. Average End to End Delay Summary
Environment Size 500m2
Number of Nodes 25 25
750m2
50 50
1000m2
100 100
Average End-to-End Delay (sec.) Protocol No Fading Rayleigh Ricean AODV 0.259 0.729 0.629 AODVjr 0.166 1.27 0.701 Difference 0.093 0.541 0.072 AODV 1.95 0.585 0.52 AODVjr 1.48 1.66 0.401 Difference 0.47 1.075 0.119 AODV 1.46 1.22 0.69 AODVjr 6.77 1.04 0.337 Difference 5.31 0.18 0.353
64
Texas Tech University, Ivan G. Guardiola, December 2007
links. When a node receives a control packet, it is assumed that the link is reliable; however, in actuality the link may or may not be reliable due to signal amplification resulting from small-scale fading. The Euclidean distance between nodes is unknown, and we only observe a sample from the instantaneous power process upon which to make inference. The distance between the nodes is a statistical hypothesis from which a single observation is made, that being an indicator function of whether or not the packet was received without error. The null hypothesis is formed that the nodes are within the nominal range, yet the alternative is present that the nodes may in fact be beyond this range. This corresponds to the Type II error previously emphasized in Chapter 2 of this document. The additional effect of control packets being transmitted at a lower data rate (1M b) than data packets (11M b) further calls into question the ability to make reasonable inference about the nominal range of data packets based on a sample of control packets. The AODV protocol relies on updated and accurate cache tables, yet these tables are built of control packets, which are a single source of inference about the hypothesis. Periodic Hello messages provide multiple samples since they are periodically propagated throughout the network. However, each is an indicator variable type and suffer from the aforementioned data rate issue. Through not incorporating the stochastic effects of fading into simulations, it removes the statistical hypothesis about the node distances being within the nominal range. In actuality, however, it has been shown that there is sufficient stochastic behavior under the Ricean and Rayleigh fading models that this statistical hypothesis cannot be ignored. Once a route has been established, the MAC layer will attempt to send data packets along that route. If an acknowledgement of a successful reception of the data packet is not received, the MAC will send the packet again, and will repeat this process for each data packet a number of times up to the retrial limit. The statistical hypothesis presented in Chapter 2, the MAC will attempt to mitigate Type I errors through retries prior to rediscovering a route, but in doing so it increases the β error, which is because it perpetuates bad routes. These β errors lead to increased observable performance in the short term, as noted by the increased packet delivery fraction of the Rayleigh model over the Ricean model in the simulations, but may
65
Texas Tech University, Ivan G. Guardiola, December 2007
degrade the performance of the protocol in a long run setting. 4.3 Chapter Conclusions In general, these simulations show that under Ricean and Rayleigh fading, which is realistic and representative of actual field environments, the additional overhead of AODV does not increase the end-to-end performance of the protocol over the AODVjr protocol. While the main focus of this experiment was based on these two protocols, this research proposes an interesting question that needs to be explored throughout all other protocols which have been developed for mobile wireless ad-hoc networks. It follows that any MANET protocol with excessive control overhead should be evaluated in a small-scale fading context, and that such overhead will likely be of minimal value in increasing the end-to-end performance in these higher fidelity environments. It has been shown through these experimentations that small-scale fading effects significantly contribute to the stochastic behavior of a transmitted signal, which are critical to simulations of mobile wireless ad-hoc networks. The additional overhead of AODV over the AODVjr protocol was shown to have marginal benefits when the stochasticity of the operating environment is considered and under performs as the network is scaled upwards in size. Thus, the proposition that overhead contributes to the increase in performance measures is questionable through such experimentations. Moreover, the generalized assumption that in fact overhead does not contribute to the MANET performance can be made upon findings like those presented within this chapter. While the experimentations presented in this chapter were primarily focused on the AODV and AODVjr protocols, such results give us an insight into the performance of other high overhead protocols within a fading considerate environment.
66
Texas Tech University, Ivan G. Guardiola, December 2007
CHAPTER 5 METHODOLOGY II: THE BLOCKING MECHANISM The addition of marginal control overhead into current protocols attempt to realize great improvements in the performance of wireless ad-hoc networks; however, as it has been shown in the preceding chapter, this is often not the case when multi-path fading models are incorporated into simulations. The benefits of the additional overhead seems to diminish when multi-path models are considered, and often protocols that do not possess such overhead outperform the protocols that do. The influence of multi-path is far greater than previously anticipated as it has the capability to reduce the performance of well established protocols considerably. Hence, it is of interest to explore methods by which to mitigate these effects. The proposed methodology is that through the incorporation of the Global Positioning System a node can attempt to mitigate these effects of multi-path by reducing the influence of multi-path during the route discovery phase of a protocol by giving a participant the capability to determine whether a link is reliable or not. This is done by the receiver determining the Euclidean distance between itself and the transmitter and determining whether that transmitter is in fact within reliable communication range or not. Through this simple decision, it is proposed that the effect of multi-path signal amplification can be mitigated as it leads to the inclusion of unreliable links within a route. The perception of the receiver is hindered by basing this decision on only one realization of the signal power process. Hence, by eliminating this perception more reliable routes can be established throughout the entire network since they will inherit more reliable links from this distance check. Many current protocols do not posses the capability to determine whether a link is reliable or not. This is due to the fact that most protocols rely on the Medium Access Control protocol to determine whether or not a receiver is reliable based on the received power of the signal. Hence, the problem of assuming that a transmitter is reliable is realized. The fact of the matter is that this signal power determination is not a good decision making measure as it is highly influenced by multi-path fading, which can amplify or attenuate a signal by up to ±30dB. The MAC layer has the capability to drop control packets as they are received based on their
67
Texas Tech University, Ivan G. Guardiola, December 2007
received power. Thus, it is proposed that the GPS Euclidean distance check be performed within this layer, which will reject control packets prior to any data processing taking place. In order to accomplish this, each packet transmitted will have the last senders position information within its header. Thus, as packets are received, the MAC protocol can call upon a basic routine that determines the senders position through the processing of the packet header information. Once the MAC determines the distance between the current node and the previous sender it then makes a basic decision to drop or process that packet. A packet will be dropped and no further processing will be performed if the distance is greater than that of the average nominal range of communications. In contrast, the MAC will proceed with the processing of a packet if it does not fail this basic if statement and the packet will be sent up to the link layer and protocol layer for further processing. The MAC gains the capability to drop packets from those senders whose signal strength is ambiguous and is often a result of the multi-path fading obtained within the operating environment. This check therefore eliminates all those packets whom arrived with nominal or above nominal signal power that are beyond the reliable range of communication. This marginal processing can result in the mitigation of the β error described throughout this document. The mitigation of this error can result in the decrease of control packet processing throughout the entire network as well as less maintenance activities that can be seen as an increase of reliability. Reliability is observed as less route down time, which means that the transmitter receiver pair has longer periods of continuous communication between link changes or breakages. Thus, this measure is quantified as the amount of time the route was active. It is also proposed that since the link is active for longer periods, less control traffic is generated throughout the network. It is hypothesized that the throughput will not be affected significantly but rather would increase rather than decrease. Finally, it is also hypothesized that the number of intermediate nodes necessary for any given arbitrary route will not increase significantly due to this exclusion of links within the route discovery phase. The underlying protocol is not modified but rather the MAC layer is modified to process the header information of a received packet prior to sending it up to link and protocol layers. The basic operations of the protocols stay the same and do not
68
Texas Tech University, Ivan G. Guardiola, December 2007
change. Since a packet is generated by the protocol layer, the MAC of the transmitter is the only modified structure within the wireless node. Thus, it is only the Up-Links that are affected by this GPS distance check that results in a blocking mechanism for the inclusion of unreliable links. It is also important to note that regular data packets are not to be passed through this distance check. All data packets will proceed and will be processed as the underlying protocol dictates. The only packet that will be processed for this distance check are control packets that are generated during the discovery or maintenance phases of the underlying protocol. Moreover, the incorporation of such a mechanism within the MAC layer under a reactive protocol results in a protocol that has the capability to obtain the known positive attributes of pro-active protocols. This is due to the fact that the pro-active protocols have access to the topological information of the network by which routing decisions are based. Through the incorporation of GPS within the reactive protocol’s MAC layer, the reactive protocol is able to gain insight about its neighborhood in an on-demand basis. Thus, the reactive protocol reveals the neighborhood’s topological information as needed and can also make routing decisions; however, this is not done by the communication source node but rather by the intermediate and intended receivers in the network. The effectiveness of this blocking mechanism is that intermediate nodes have the capability to stop the propagation of RREQs and RREPs if their position results in a rejection of the distance check. Thus, all nodes who are farther away but have received propagated packets are truncated from participating in a particular route search or maintenance activities. The effectiveness of this mechanism was evaluated using the minimal overhead AODVjr protocol in the popular NS-2.31 simulator package, which was built in a Linux Redhat Enterprize 4 platform. All simulations were performed on an x86 − 64 server. The details of the simulation experiment undertaken are further explained in the following sections and subsections of this chapter as well as the modifications to the NS-2.31 C++ hierarchy.
69
Texas Tech University, Ivan G. Guardiola, December 2007
5.1 Modification of NS-2.31 The NS network simulator is written in C++ and uses OTcl as a command and configuration interface. While this simulator is highly well documented and developed, many basic functions are still not incorporated. One such capability not incorporated is that of being able to implement positioning capabilities. Hence, in order to accomplish the experimentations necessary to show the proposed hypothesis that through positioning capabilities the effects of multi-path fading can be mitigated, slight modifications to the current release of NS-2.31 were done. These modifications included adding the CMU addition to the network simulator that incorporates both Ricean and Rayleigh fading. Next, incorporation of the AODVjr code to the base package was also done. Finally, modifications were made to the current base package to obtain nodal positions and calculate the Euclidean distance from receiver to transmitter during the Up-Link in the MAC layer. First, the incorporation of the fading models was done according to the instructions provided by the CMU fading addition package, which is described in detail within (Punnoose et al., 2000). The CMU fading additions to the network simulator can be found on the internet and are widely used throughout the research community that uses NS-2 for simulations of networking. Next, the addition of the AODVjr protocol was done according to the instructions provided by Mariana Bravo from the University of Sao Paolo, under the supervision of Professor Alfredo Goldman (Bravo, 2006). The AODVjr protocol provided by Professor Goldman was highly reviewed and was found to be sound and error free. Through the addition of these two packages, the capabilities to model the AODVjr protocol as well as all other protocols provided by the base release of NS-2 under fading is possible. However, one major modification to the simulator package is that of determining the node position of the the current node and the last transmitting node during the Up-Link of the channel in the MAC layer. Hence, a small amount of additional C++ code was added to the wireless-phy.cc file in order to accomplish the task of stopping control packets from being further processed by the receiving node. The task included obtaining the received packet’s header and processing that information in order to establish packet type and transmitting node information. Once this information was obtained, the distance between the current node and
70
Texas Tech University, Ivan G. Guardiola, December 2007
transmitting node was found using the distance formula described below in equation 5.1, where the subscripts r and t refer to the receiver and transmitter respectively. The third dimensional component z is excluded as NS-2 does not have third dimensional networking capabilities. Distance =
p
(xr − xt )2 + (yr − yt )2
(5.1)
Once the distance is found, the following conditions must be satisfied in order to drop or accept the packet for further processing. If the packet is an RREP or RREQ type of the AODVjr protocol, then the basic check that the distance is within nominal range is obtained. The nominal range was set to those specifications that are common to the Orinoco 802.11b card (i.e. the nominal range of 172m). If this packet passes through this distance check, then further processing at the MAC level is continued. This further processing consists of determining whether the packets received power is within the Orinoco card’s specifications. Thus, the collision threshold was set to 10.0, the carrier sense power was set to 5.011872x10⁻¹² W , received power threshold was specified to be 1.15126x10⁻¹⁰ W , transmitting power was set to 0.031622777W , and a bandwidth of 2.472GHz. The code was written in Otcl as illustrated below. #Values of the 802.11b card Phy/WirelessPhy set L_ 1.0 ;#System Loss Factor Phy/WirelessPhy set freq_ 2.472e9 ;#Channel-13 2.472GHz Phy/WirelessPhy set bandwidth_ 11Mb ;#Data rate Phy/WirelessPhy Phy/WirelessPhy Phy/WirelessPhy Phy/WirelessPhy
set set set set
Pt_ 0.03162277 ;#Transmitting power CPThresh_ 10.0 ;#Collision threshold CSThresh_ 5.011872e-12 ;#Carrier sense power RXThresh_ 1.15126e-10 ;#Received power threshold
set val(netif) Phy/WirelessPhy ;#Network interface type The packet is received from the channel and is then analyzed according to these specifications in accordance to the propagation models. The packet is then checked to see whether its received power is within the sensing capabilities described by previously set thresholds. If a packet does not meet these thresholds, it is then 71
Texas Tech University, Ivan G. Guardiola, December 2007
LL Link Layer
MAC uptarget_
Radio Propagation Model
propagation_
NetIF Network Interface uptarget_ Channel
Figure 5.1. Schematic (simplified) of the Wireless Node in NS-2
dropped by the receiving node and is not sent to the upper layers. The schematic of the mobile node under the CMU monarch’s wireless extensions to NS is shown in Figure 5.1 (Fall & Varadhan, 2002). Thus, this check is incorporated into the section of the code within the wireless-phy.cc file during the analysis of the propagation variable. The check itself is described in the pseudocode below. IN the WirelessPhy::SendUP(Packet *p) function within wireless-phy.cc. 1. Obtain Header type; 2. 3. 4. 5.
IF header type defines an AODVjr packet, go to 5, otherwise go to 9; Obtain current coordinates of the transmitter; Obtain current coordinates of the receiver; Calculate distance between transmitter and receiver.
6. 7. 8. 9.
IF packet is an AODVjr_RREQ OR AODVjr_RREP, go to 7, otherwise go to 9; IF Distance > Communication Range Ro=172m, then set pkt_recv=0; go to 8; Drop packet Continue basic SendUP checks of power thresholds. 72
Texas Tech University, Ivan G. Guardiola, December 2007
The actual code added to the wireless-phy.cc is written in detail in Appendix A. It is important to note that this C++ hierarchy is object orientated programming and has many pointers and classes within the code. A packet is dropped if the pkt-recv flag is set to zero. This flag will then allow a built in function to discard the packet as well as all of its attributes and information within the network simulator. Thus, by adding the code within Appendix A, we are able to stop the further processing of control packets if they have been found to be generated from transmitters beyond the nominal range of communication, and hence, the global positioning mechanism realized within the network simulator. It is important to note that many functions are necessary in order to accomplish the task of determining distance between a transmitter and receiver due to the complexity of the NS-2 simulator’s C++ hierarchy. The file wireless-phy.cc can be found in the following directory /ns.31/mac/wiress − phy.cc within the ns-2.31-allinone package. This code was evaluated through simple simulation scripts consisting of three nodes and creating routing agents to assure that AODVjr control packets were dropped according to specified conditions. Moreover, the distance information was gathered from within ns-2 through the usage of pointers and classifiers inherent within the ns-2.31 source code. Note that this global positioning mechanism adds marginal processing overhead to the node as it receives incoming packets; however, it proposed that this overhead will result in a better performance measures. Hence, a detailed and well thought out simulation analysis was developed in order to design an experiment with the capabilities to statistically support the proposed hypothesis that position information will mitigate the effects of small-scale fading on protocol performance. Hence, the following sections describe the experiment undertaken in great detail as well as discussions of results. 5.2 Simulation Design In order to fully understand the impact of the GPS-Blocking mechanism, a complex set of simulations were performed in the NS-2.31 package. These simulations evaluated the minimal control overhead protocol AODVjr under various movement scenarios, congestion levels and operating environment sizes, all of which
73
Texas Tech University, Ivan G. Guardiola, December 2007
can greatly diversify the performance of any given protocol. Thus, the randomization of node placement and movement conditions, as well as constant communication demands within each network, allows us to view the effectiveness of this new marginal overhead under various conditions common to those encountered in the real world deployment of a mobile wireless ad-hoc network. Moreover, it is through not just one realization, but rather multiple realizations that we can truly observe the significance of fading as well as the effectiveness of the GPS blocking mechanism. The simulations developed consisted of a contrast analysis of the performance of the AODVjr protocol under both Ricean and Rayleigh fading models. In addition, the network size was scaled in size from 750m2 to 1000m2 with the number of nodes staying consistent at 100. Ten different movement scenarios were used under each operating environment size and within each of those ten movement scenarios ten routes were observed under both Rayleigh and Ricean fading with and without GPS included. The simulation design is illustrated in Figure 5.2. It is important to note that the movement scenarios within each operating environment differ significantly in the initial position of the nodes as well as their movement descriptions. A random way-point movement model was used under each of the movement scenarios and were developed using the setdest routine available within the base package of NS-2.31. The setdest routine is capable of generating movement descriptions and initial node placement. The output of the setdest routine consists of a text file written in Otcl script language which can be called upon by any Otcl script file. Hence, the routine samples from a Uniform distribution for velocity measures within the interval of 0m/s to 10m/s or U (0, 10)m/s. Similarly, the initial node placement within the operating environment is also a result of the routine implementing a random realization from the Uniform distribution within the environment size constraints. Therefore the nodes were randomly scattered throughout the entire operating environment. This randomization results in a randomization of the routes within the scenarios since the nodes are placed randomly from one scenario to the other. The routes stay consistent throughout all scenarios. The reason for this is that the routes are defined to be between 20 particular node participants. In particular, Route 1 refers
74
Texas Tech University, Ivan G. Guardiola, December 2007
to communication between node 1 and node 2 and Route 2 refers to communication between node 3 and node 4. This patterns is followed until Route 10, which defines the communication between nodes 19 and 20. These 20 nodes are randomly placed within the the operating environment as well as their movement is also randomized. This results in the routes differing significantly from one movement scenario to the next as well differing greatly between operating environment sizes. The communication demands for each of these routes stays consistent, which is that a routing agent was created throughout the entire simulation time of 350 seconds. The OTcl code was used to define the traffic of route. #Connecting node 1 to node 2. set udp_(0) [new Agent/UDP];# creates an agent $ns_ attach-agent $node_(1) $udp_(0);# attaches the agent to node 1 set null_(0) [new Agent/null];#creates a sink agent $ns_ attach-agent $node_(2) $null_(0);# attaches the agent to node 2 set crb_(0) [new Application/Traffic/CBR];# creates a traffic agent $cbr_(0) set packetSize_ 512;#defines packet size $cbr_(0) set interval_ 0.20;#send 5 packets per second $cbr_(0) set attach-agent $udp_(0) $ns_ connect $udp_(0) $null_(0);#connects the nodes $ns_ at 0.0001 "$cbr_(0) start";#start time of agent $ns_ at 350.0 "$cbr_(0) stop";#stops agent The agent will begin at the start time and will continue to demand that node 1 and node 2 communicate throughout the entire simulation time. The agent will send five 512-byte packets per second. Similarly, this code was developed for the remaining nine routes within each scenario. The simulations’ specifics for the IEEE 802.11b standard card are the same as those described in section 5.1. Hence, all of the thresholds and specifications are those common to the Orinoco 802.11b card. The operating frequency and tranmission power is the same as those previously stated. A sample OTcl script file can be seen in Appendix B. As depicted in Figure 5.2, this experiment follows the design of a four-stage nested factorial design with mixed effects. Each route’s performance is therefore observed under the levels of GPS-Blocking Mechanism (GPS-BM) included or not 75
Texas Tech University, Ivan G. Guardiola, December 2007
across the fading models of Ricean and Rayleigh fading. For example, Route 1 consisting of node 1 communicating with node 2 is evaluated under Ricean fading with and without the GPS-Blocking Mechanism. Similarly it follows that Route 1 is also evaluated within Rayleigh fading with and without the GPS-Blocking Mechanism. These routes are nested within ten different movement scenarios, which are themselves nested within two different operating environment sizes. Hence, for the purpose of analysis, a variety of performance measures were collected in order to evaluate the performance of the GPS-Blocking Mechanism in a fading rich environment. One of the performance measures is the reliability measure, which consisted of finding the ratio of the amount of time the route was active over the total amount of time the route was needed by the traffic agent. Another measure collected was the number of packets received throughout the entire simulation on a specific route. The number of control packets generated was also collected, which is the measure of the amount of control traffic a specific source generated throughout the entire simulation. Finally, the number of intermediate nodes and the average delay was also recorded for each of the 10 routes within a specific movement scenario. These measures were then analyzed through well developed statistical methods associated with a nested factorial design. Each of the performance measures can be considered a response that is effected by the factors of environment size (Topology), movement scenario (Trace), Route number (Route), GPS or No-GPS (GPS), and Ricean and Rayleigh fading models (Fading), where the name in parenthesis is the variable name which follows the notation depicted in Figure 5.2. 5.2.1 The Statistical Design of Experiments The model associated with each of these performance measures or responses is,
Yijklm
i = 0, 1 j = 1, 2, 3, ..., 10 = µ + φi + ϕj(i) + ϑk(ij) + νl(ijk) + ηm(ijk) + ²ijklm k = 1, 2, 3, ..., 10 l = 0, 1 m = 0, 1
76
(5.2)
Texas Tech University, Ivan G. Guardiola, December 2007
where φi is the effect of the ith topology or operating environment size, ϕj(i) is the effect of the jth trace within the ith topology, ϑk(ij) is the effect of the kth route within the jth trace within the ith topology, νl(ijk) is the effect of the lth level of GPS within the kth route within the jth trace within the ith topology, ηm(ijk) is the effect of the mth level of fading within the kth route within the jth trace within the ith topology, and ²ijklm is the usual error term. Notice that the interaction terms have been omitted from the model since the movement scenarios are not the same across both topology sizes as well as the routes differ greatly from one topology size to the other. The expected mean squares are shown in Table 5.1 assuming a restricted mixed model. However, while the GPS and fading are fixed since they are within the route and trace, which are both randomized, then that randomization will transfer to the levels below since it is a nested model, hence, the regular sigma notation is used. Through the regular Analysis of Variance we are able to obtain whether each of the effects is significant for each of the respective responses. Thus, Yijklm will allow us to gain inference about the significance of these factors, specifically, on the reliability measure, the number of packets received, the number of control packets generated, the number of intermediate nodes, and the average delay. The subscript notation explains the various levels of the effects, i = 0, 1, where 0 denotes the operating environment of 1000m2 and 1 denotes the operating environment of 750m2 , j corresponds to the ten trace/ movement scenarios, k corresponds to each of the ten routes within each trace, l = 0 denotes the inclusion of the GPS-Blocking Mechanism, and in contrast, l = 1 corresponds to the exclusion of the GPS-blocking mechanism. The notation continues with m = 0 if Rayleigh fading is used and m = 1 if Ricean fading is used. Specifically, the following hypothesis are tested through this analysis at all levels of the effects. Using the notation displayed in Figure 5.2 and the design in Figure 5.3, the statistical hypotheses of Equation 5.3, are formed. Note that Figure 5.3 depicts the levels of both GPS and fading. The point denoted by (1) corresponds to the data pertaining to the observation which had the GPS-blocking mechanism (GPS-BM) and was evaluated under the Rayleigh fading model. The point denoted by a corresponds to the observations gathered when the GPS-blocking mechanism was omitted under the Rayleigh fading model. It follows
77
ab
GPS
GPS
ab
...
... ab
b (1) Fading
a
10
ab
b (1) Fading
a
1
ab
b (1) Fading
a
2
Route
...
... GPS
Route
ab
b (1) Fading
a
10
...
... a
1
ab
a
2
b (1) Fading b (1) Fading
ab
Route
... ... GPS
1
b (1) Fading
a
2
10
a
10
b (1) Fading
ab
ab
b (1) Fading
a
1
a
2
1
b (1) Fading
ab
Route
... a
10
ab
a
1
...
ab
b (1) Fading
b (1) Fading
ab
b (1) Fading
a
2
Route
2
...
...
ab
b (1) Fading
a
10
...
...
...
ab
b (1) Fading
a
1
GPS
GPS
GPS
GPS
ab
b (1) Fading
a
2
Route
10
...
...
This is a Four-Stage Nested Factorial Design with Mixed Effects. Each Topology size containes 10 random movement scenarios, in which 10 communication demands are to be initiated. Thus, within each Movement scenario there is ten Routes. These Routes are evaluated under both Ricean and Rayleigh Fading, and GPS blocking and no GPS blocking.
b (1) Fading
a
1
...
GPS
Movement[ i ]
GPS
Movement[ i ]
GPS
2
GPS
750mX750m
GPS
1
GPS
2
GPS
Topology (size)
GPS
Figure 5.2. Blocking Mechanism Simulation Design
GPS
78
GPS
1000mX1000m
ab
b (1) Fading
a
10
Texas Tech University, Ivan G. Guardiola, December 2007
Trace (within Topology) Route (within Trace) GPS (within Route) Fading (within Route) Error Total
Topology
Source
i(j − 1) ij(k − 1) ijk(l − 1) ijk(m − 1) ijk(m − 1)(l − 1) ijklm − 1
i−1
σ 2 + lσν2m(ijk) + mση2m(ijk) + lmσϑ2 m(ijk) + lmkσϕ2 m(ijk) σ 2 + lσν2m(ijk) + mση2m(ijk) + lmσϑ2 m(ijk) σ 2 + lσν2m(ijk) σ 2 + mση2m(ijk) σ2
σ 2 + lσν2m(ijk) + mση2m(ijk) + lmσϑ2 m(ijk) + lmkσϕ2 m(ijk) + lmkj
Table 5.1. ANOVA Table for 4-Stage Nested Factorial Design with Mixed Effects Degrees of Freedom Expected Mean Squares E[MS]
∀i
X
φi
Texas Tech University, Ivan G. Guardiola, December 2007
79
Texas Tech University, Ivan G. Guardiola, December 2007
ab
(1)
b
GPS
a
Fading
Figure 5.3. Design Hypothesis Illustrated
that the point denoted by b corresponds to those observations with the GPS-blocking mechanism but under the Ricean model. In this context, the point denoted by ab is the observations from the GPS-blocking mechanism being omitted under the Ricean fading model. Hence, the following hypothesis of Equation 5.3 were tested using the analysis of variance. Ho : µ(1) − µa = 0 Ha : µ(1) − µa 6= 0 Ho : µ(1) − µb = 0 Ha : µ(1) − µb 6= 0
Ho : µb − µab = 0 Ha : µb − µab 6= 0 Ho : µa − µab = 0 Ha : µa − µab 6= 0
(5.3)
It is important to note that the hypothesis denoted here are for one particular route within a particular trace within a topology size. Hence, these hypothesis are realized for each of the ten routes within each of the ten traces within each topology size, with a total of 800 hypothesis for each of the before mentioned responses. It is through this elaborate statistical analysis that we were able to gain an insight into how each of the responses is impacted by each of the effects. In particular, the design is focused in gaining an insight into the statistical significance the GPS-blocking mechanism has towards each of the respective responses. 5.3 Results of the GPS-Blocking Simulations The resulting ANOVA tables for each of the responses have been concatenated in Table 5.2 and are displayed in the order of reliability, packets received, control packets generated, average hop nodes, and average delay, from top to bottom respectively. The ANOVA table for reliability response reveals that the GPS-blocking mechanism is indeed significant with a p-value of 0.029. It is observed 80
Texas Tech University, Ivan G. Guardiola, December 2007
Table 5.2. Results for 4-Stage Nested Factorial Design with Mixed Effects Analysis of Variance for Reliability, using Adjusted SS for Tests Source D.F. Seq. SS Adj. SS Adj. MS F P Topology 1 0.90844 0.90844 0.90844 2.15 0.16 Trace(Topology) 18 7.59388 7.59388 0.42188 9.88 0 180 7.68978 7.68978 0.04272 4.84 0 Route(Topology Trace) GPS(Topology Trace Route) 200 0.59269 0.59269 0.00296 1.31 0.029 Fading(Topology Trace Route) 200 1.62383 1.62383 0.00812 3.58 0 Error 200 0.45298 0.45298 0.00226 Total 799 18.86161 S = 0.0475911 R-Sq = 97.60% R-Sq(Adj.) = 90.41% Analysis of Variance for Packets Received, using Adjusted SS for Tests Source D.F. Seq. SS Adj. SS Adj. MS F P Topology 1 1897060 1897060 1897060 15.1 0.001 Trace(Topology) 18 2261457 2261457 125637 0.49 0.961 Route(Topology Trace) 180 46364462 46364462 257580 11.58 0 GPS(Topology Trace Route) 200 1445680 1445680 7228 1.24 0.065 Fading(Topology Trace Route) 200 4171197 4171197 20856 3.57 0 200 1167059 1167059 5835 Error Total 799 57306916 S = 76.3891 R-Sq. = 97.96% R-Sq.(Adj.) = 91.86% Analysis of Variance for Control Packets Generated, using Adjusted SS for Tests Source D.F. Seq. SS Adj. SS Adj. MS F P Topology 1 367910 367910 367910 6 2.84 0 Trace(Topology) 18 105386 105386 5855 0.4 0.987 Route(Topology Trace) 180 2642202 2642202 14679 0.93 0.679 GPS(Topology Trace Route) 200 467181 467181 2336 1.21 0.086 200 3059744 3059744 15299 7.95 0 Fading(Topology Trace Route) Error 200 384850 384850 1924 Total 799 7027275 S = 43.8663 R-Sq. = 94.52% R-Sq.(Adj.) = 78.12% Analysis of Variance for Average Hop Nodes, using Adjusted SS for Tests Source D.F. Seq. SS Adj. SS Adj. MS F P Topology 1 34.8677 34.8677 34.8677 26.6 0 Trace(Topology) 18 23.5913 23.5913 1.3106 0.86 0.631 Route(Topology Trace) 180 275.252 275.252 1.5292 5.03 0 GPS(Topology Trace Route) 200 11.9157 11.9157 0.0596 1.09 0.27 Fading(Topology Trace Route) 200 59.7528 59.7528 0.2988 5.47 0 Error 200 10.923 10.923 0.0546 Total 799 416.3024 S = 0.233698 R-Sq. = 97.38% R-Sq.(Adj.) = 89.52% Analysis of Variance for Average Delay, using Adjusted SS for Tests Source D.F. Seq. SS Adj. SS Adj. MS F P Topology 1 30.7871 30.7871 30.7871 18.98 0 Trace(Topology) 18 29.2047 29.2047 1.6225 0.54 0.938 Route(Topology Trace) 180 544.7152 544.7152 3.0262 2.91 0 200 38.981 38.981 0.1949 0.86 0.856 GPS(Topology Trace Route) Fading(Topology Trace Route) 200 214.5827 214.5827 1.0729 4.74 0 Error 200 45.3006 45.3006 0.2265 799 903.5713 Total S = 0.475924 R-Sq.=94.99% R-Sq.(Adj.) = 79.97%
81
Texas Tech University, Ivan G. Guardiola, December 2007
from these results that trace, route, and fading are also highly significant. This follows intuitive thinking concerning a MANET, since mobility and fading are highly influential to the performance of MANETs. Moreover, the significance of route suggests that routes differ greatly from one to another, which means that the performance of a particular route can not reveal any information regarding the performance of another route under the same operating conditions. Thus, the ranking of fading or its movement model is not possible as routes are highly independent and therefore each route’s reliability can not be attributed to specific operating conditions. These conditions can be operating environment size, movement model, fading conditions, and/or underlying protocol control overhead. The reliability response also revealed that the network size is softly significant. The term softly is used as this value is higher than the accepted value of α = 0.05, hence it is noticed that the network size referred to by the variable topology is softly significant to the measure of reliability with a p-value=0.16. It is apparent that the reliability of the route is influenced by all of the effects considered within the statistical model. Hence, it is difficult to rank which of these factors effects the overall reliability of a deployed MANET. However, it is perhaps the significance of the GPS-Blocking Mechanism which is most important as we are able to assure through a thorough statistical analysis that the addition of the distance calculation overhead to stop the inclusion of bad links within a route during the discovery phase of the AODVjr protocol does influence the reliability performance measure of the deployed MANET. While the observation of the significance is clear from the resulting p-value in the respective ANOVA table, it’s assured through the visual inspection of the residuals that the assumptions of the ANOVA have been met. The residuals of the fitted ANOVA corresponding to the reliability response are displayed in Figure 5.4. Through a visual inspection of Figure 5.4, we are able to conclude that all the assumptions related to the Analysis of Variance indeed have been met. The residuals do not display any patterns which would suggest that normality, independence, and constant variance are not present for the reliability response. It follows that the ANOVA does not actually quantify the significance of incorporating the GPS-Blocking Mechanism within a MANET. All 200 route reliability measures observed from the simulation experiment for the
82
Texas Tech University, Ivan G. Guardiola, December 2007 Normal Probability Plot Standardized Residual
Versus Fits
99.99 Percent
99 90 50 10 1
2 0 -2 -4
0.01
-4
-2 0 2 Standardized Residual
4
0.2
Standardized Residual
Histogram Frequency
4
80 60 40 20
0.4
0.6 Fitted Value
0.8
1.0
Versus Order 4 2 0 -2 -4
0 -3
-2 -1 0 1 2 Standardized Residual
1 50 00 50 0 0 5 0 0 0 5 0 00 50 00 5 0 0 0 5 0 0 0 50 0 1 1 2 2 3 3 4 4 5 5 6 6 7 7 8
3
Observation Order
Figure 5.4. Residual Plots for the Reliability
1000m2 environment size are displayed in Figure 5.5 sub-figure (a) in which 100 observations correspond to those observations obtained with the GPS-Blocking Mechanism included and are displayed by the solid line. In contrast the other 100 observations correspond to those observations obtained with the GPS-Blocking Mechanism not included in the simulation. Similarly, this context follows for Figure 5.5 sub-figure (b) in which the 200 observations under the 750m2 environment size are displayed. Through a careful analysis it was observed that in the 1000m2 environment, 55 of the 100 routes with a median value of 0.39% benefited in an increase of reliability by having the GPS-BM included, where as in the 750m2 environment only 52 of 100 routes with a median value of 0.0467% benefited from the GPS-MB. In terms of the results pertaining to the response of the number of packets received, the topology, route, GPS-BM, and fading were all found to be highly significant. They all possess low p-values from the ANOVA analysis. It is, however, interesting that trace is highly insignificant with a large p-value=0.961. 83
Texas Tech University, Ivan G. Guardiola, December 2007
0.9 GPS No-GPS 0.8
0.7
Reliability
0.6
0.5
0.4
0.3
0.2
97 10 0
91 94
85 88
79 82
70 73 76
64 67
58 61
52 55
46 49
40 43
34 37
28 31
22 25
16 19
7 10 13
1
4
0.1
Route
(a). 1000m2 Topology Size 0.9
0.8
0.7
Reliability
0.6
0.5
0.4
0.3
0.2 GPS No-GPS 0.1
0 1
5
9
13
17
21
25
29
33
37
41
45
49
53
57
61
65
69
73
Route
(b). 750m2 Topology Size Figure 5.5. Reliability Observed
84
77
81
85
89
93
97
Texas Tech University, Ivan G. Guardiola, December 2007 Versus Fits Standardized Residual
Normal Probability Plot 99.99 Percent
99 90 50 10 1
2 0 -2 -4
0.01
-4
-2 0 2 Standardized Residual
4
0
400
800 Fitted Value
1200
1600
Versus Order Standardized Residual
Histogram Frequency
4
80 60 40 20
4 2 0 -2 -4
0 -3
-2
-1 0 1 2 Standardized Residual
1 50 00 50 00 50 00 50 00 50 00 50 00 50 00 50 00 1 1 2 2 3 3 4 4 5 5 6 6 7 7 8
3
Observation Order
Figure 5.6. Residual Plots for the Packets Received
This insignificance of the route effect suggests that the mobility model does not effect this measure, which is highly counter intuitive. Hence, the number of total packets received on a particular route is influenced more by the network size and which nodes participate in the route, as well as by fading and GPS-BM, rather than the underlying mobility model. The impact of the network size is trivial since as the network is scaled in size sparseness of the nodes is more apparent. Thus, this results in particular nodes being utilized more as intermediate nodes as the possibility of partitions within the network increases. The impact of fading towards the received packets response measure is also trivial as it has been shown that fading can impact the performance of any underlying protocol greatly. However, unlike the reliability response, we are able to somewhat rank the significance of each of the effects. In particular, it has been found that the underlying mobility model does not affect the number of packets received on a particular route, but rather where that route is, and more importantly, which nodes participate in a route that are more likely to
85
Texas Tech University, Ivan G. Guardiola, December 2007
affect this measure. It has been observed that the GPS-BM is highly significant to the response of received packets, which implies that the inclusion of the GPS-BM can considerably sway this performance measure within a MANET. The residuals of this model are checked again in order to assure that the assumptions made by employing the analysis of variance are sound. The residual plots belonging to the analysis of variance for the number of received packets are displayed in Figure 5.6. Through the inspection of these plots we find no reason to believe that the assumptions of the analysis of variance have not been satisfied. The residual exhibit a random spread suggesting constant variance, the normal probability plot and the histogram plot suggest normality. The residual versus order plot suggest the data came from a time invariant process, which implies no correlation between observations. Quantification of the GPS-BM is again found for the number of packets received response due to this effect resulting in a p-value=0.065. In Figure 5.7 the values of the number of received packets response are displayed. The results shown in Figure 5.7 sub-figure (a) entails that in the 1000m2 environment only 51 of the 100 routes with a median value of 1 packet benefited in a positive manner. On the other hand, in the 750m2 environment only 46 of 100 routes benefited with a median value of -7.25 packets. Thus, the larger network benefited while the smaller more condensed network seemed to have not benefited from the GPS-BM. The response of control packets generated is perhaps the most important measure in validating the effectiveness of the GPS-BM. This is because it is through the processing of the control packets that we are capable of mitigating the stochastic effects of fading. The proposition is that by not allowing the inclusion of unreliable links into the route during the route discovery phase of the protocol that will ultimately result in less overall control traffic throughout the entire network as routes will be more reliable. Hence, we see that the resulting analysis of variance yielded a p-value=0.086 for the GPS-MS, which is highly significant. The other most significant effects are the network size and fading with both attributing p-values of 0. This supports the notions and propositions expressed throughout the entirety of this document. The notion that control traffic is a result of both the network size and fading within an operating environment has been suggested
86
Texas Tech University, Ivan G. Guardiola, December 2007
1400
1200
Packets Received
1000
800
600
400 GPS No-GPS
94 97 10 0
88 91
82 85
76 79
70 73
64 67
58 61
52 55
46 49
40 43
31 34 37
25 28
16 19 22
7 10 13
1
4
200
Route
(a). 1000m2 Topology Size 1400
1200
800
600
400 GPS No-GPS
Route
(b). 750m2 Topology Size Figure 5.7. Number of Packets Received Observed
87
94 97 10 0
88 91
82 85
76 79
70 73
64 67
58 61
52 55
46 49
40 43
31 34 37
25 28
16 19 22
7 10 13
1
200
4
Packets Received
1000
Texas Tech University, Ivan G. Guardiola, December 2007
multiple times throughout this document. It also observed that the route and trace effects are highly insignificant with p-values of 0.679 and 0.987 respectively, which suggests that control traffic is not influenced by the underlying mobility model and the specific route characteristics such as the individual node participants that link together to make the route possible. These results follow intuitive thinking concerning MANET performance and the behavior of control traffic within a deployed MANET. Thus, it is supported through this statistical analysis that network size and fading account for the generation of control traffic throughout the network. This is due to the incorporation of the GPS-BM. Hence, control packets that were generated by nodes further away then the nominal range of the respective receiver are dropped in the MAC layer. This dropping of control packets results in the nodes only processing those packets that will result in a more reliable links thus increasing the overall reliability of the route. The links accepted and used within routes will tend to have less breakages as they will be more effective for longer periods. However, it is counter intuitive that mobility is not significant as mobility tends to cause route breakages, which would ensue maintenance activities of the protocol, resulting in more control traffic being generated and propagated throughout the network. In order to assure that these conclusions are sound, an inspection of the residuals is again performed for the number of control packets generated response variable. The residual plots associated with this analysis are shown in Figure 5.8. Through a brief inspection of the residual plots we find that all of the ANOVA assumptions are satisfied. The residuals associated with the control packets generated response display a random pattern with a few outliers, which may be a result of the heavy tails inherent within the histogram. Through further inspection we note that the residuals do not seem to possess any characteristics that would suggest correlation or nonlinearity. The residuals suggest that the results obtained from the ANOVA are sounds and are valid for the preceding analysis. In order to quantify the effectiveness of the GPS-BM, a plot of the observed control traffic generated for all routes is illustrated in Figure 5.9. Through a close analysis we find that in the 1000m2 environment it was observed that 79 of the 100 routes with a median value of -17.5 packets benefited by having less control traffic
88
Texas Tech University, Ivan G. Guardiola, December 2007
Versus Fits Standardized Residual
Normal Probability Plot 99.99 Percent
99 90 50 10 1
5.0 2.5 0.0 -2.5 -5.0
0.01
-5.0
-2.5 0.0 2.5 Standardized Residual
5.0
0
Histogram Standardized Residual
Frequency
300 450 Fitted Value
600
Versus Order
240 180 120 60 0 -4.5 -3.0 -1.5 0.0 1.5 3.0 Standardized Residual
150
5.0 2.5 0.0 -2.5 -5.0 1 50 0 0 50 00 5 0 00 5 0 0 0 50 0 0 50 0 0 5 0 00 5 0 00 1 1 2 2 3 3 4 4 5 5 6 6 7 7 8
4.5
Observation Order
Figure 5.8. Residual Plots for the Control Packets Generated
generated. In the 750m2 environment it was observed that 70 of the 100 routes with an associated median value of -21 packets benefited by having less control traffic. This can be easily seen in Figure 5.9, since in both (a) and (b) the GPS depicted by the solid line is often lower than the dashed line depicting the exclusion of the GPS-BM. Thus, the statistical significance corresponds to a decrease in control traffic. This supports the notion that the GPS-BM was capable of establishing better routes which broke or failed less often, which resulted in less maintenance activities throughout the entire network. The results related to the response variable of average hop nodes per route suggest that the effects of topology, route, and fading are the most significant with all of these effects obtaining a p-value=0. This suggests that the major driving factors are not all associated with the GPS-BM. This means that the GPS-BM is not influencing the number of nodes needed to form routes within these two 89
Texas Tech University, Ivan G. Guardiola, December 2007
350
Control Packets Generated
300
250
200
150
100 GPS No-GPS
97 10 0
91 94
82 85 88
76 79
70 73
64 67
58 61
52 55
43 46 49
37 40
31 34
25 28
16 19 22
7 10 13
4
1
50
Route
(a). 1000m2 Topology Size 450 GPS No-GPS
350
300
250
200
150
Route
(b). 750m2 Topology Size Figure 5.9. Observed Control Traffic Generated
90
97 10 0
91 94
82 85 88
76 79
70 73
64 67
58 61
52 55
43 46 49
37 40
31 34
25 28
16 19 22
10 13
7
4
100
1
Control Packets Generated
400
Texas Tech University, Ivan G. Guardiola, December 2007
environment sizes. Previously it had been through incorporating such a mechanism that the number of nodes needed to form a route would increase, however, the results of the ANOVA suggest otherwise. The significance of the topology, route, and fading are as expected. The larger the network, the more intermediate nodes are necessary to form routes across larger operating environments due to the transmission and receiving characteristics inherent within the antenna. The statistical significance of the route effect, which correspond to the mobility model being employed, suggest that mobility can be influential to the average number of hop nodes for a given route. The fading effects also make intuitive sense since fading tends to attenuate or amplify the signal. If the fading model amplifies the signal, then less hop nodes will be necessary to form a route. In contrast, if fading degrades the signal strength then more hop nodes will be necessary for a given route to form within the MANET. Thus, fading is highly influential to this performance measure. In order to assure that the ANOVA is sound, we visually analyze the residuals associated with this response which are shown in Figure 5.10. Through this inspection we have no reason to believe that the assumptions of the ANOVA are being violated. The residuals inherit a random distribution pattern suggesting constant variance is present. The histogram and normality probability plots both suggest normality. Further, no pattern suggesting nonlinearity or correlation is present in the residual plots. Thus, the analysis of the average number of hop nodes is sound. Figure 5.11 (a) and (b) show the observed average number of hop nodes per route as observed from the simulation experiments. It is easy to notice that there is no difference in performance across both environmental sizes. Through a close inspection of the data we find that in both the 1000m2 and 750m2 environments 54 of the 100 routes benefited by needing less intermediate nodes within routes with median values of 0.02 nodes and 0.15 nodes respectively for each of the environment sizes. Hence, the impact of implementing the GPS-BM resulted in equal performance across both environment sizes. This equal performance can be seen in Figure 5.11 by noting that in both environment sizes the inclusion of GPS-BM shows the solid line follows closely to that of the dashed line, which denotes the exclusion of the GPS-BM. It is only a few routes that either have less or more
91
Texas Tech University, Ivan G. Guardiola, December 2007 Versus Fits Standardized Residual
Normal Probability Plot 99.99 Percent
99 90 50 10 1
4 2 0 -2 -4
0.01
-4
-2 0 2 Standardized Residual
4
0.0
Standardized Residual
Frequency
Histogram 100 75 50 25
1.2
2.4 3.6 Fitted Value
4.8
Versus Order 4 2 0 -2 -4
0 -3
-2 -1 0 1 2 Standardized Residual
1 50 00 50 0 0 5 0 0 0 5 0 00 50 00 5 0 0 0 5 0 0 0 50 00 1 1 2 2 3 3 4 4 5 5 6 6 7 7 8
3
Observation Order
Figure 5.10. Residual Plots for the Number of Intermediate Nodes
intermediate nodes within the route. Hence, we note that average number of hop nodes is neither significantly increase or decreased by employing the GPS-BM, which supports previous propositions before mentioned in this document. The last performance measure of interest is that of the average delay encountered by the communicating nodes within the MANET. Similarly to the results found for the number of hop nodes. Where it was observed from the resulting ANOVA that topology, Route, and fading are the most significant effects toward the response with all three possessing p-values=0. In contrast, trace and GPS are both highly statistically insignificant with respective p-values of 0.938 and 0.856. Perhaps the most interesting result is that the GPS-BM is highly insignificant with a p-value=0.856, which suggests that the inclusion of the additional overhead to the node participants does not impact the delay performance measure. This supports the inclusion of the GPS-Blocking Mechanism further, implying that the additional overhead does not cause significant delays in communication within a deployed 92
Texas Tech University, Ivan G. Guardiola, December 2007
4.5
GPS No-GPS 4
Average Number of Hop Nodes
3.5
3
2.5
2
1.5
1
97 10 0
91 94
85 88
79 82
70 73 76
64 67
58 61
52 55
46 49
40 43
34 37
28 31
22 25
16 19
7 10 13
1
4
0.5
Route
(a). 1000m2 Topology Size 3.5
Average Number of Hop Nodes
3
2.5
2
1.5
1
GPS No-GPS 0.5 1
5
9
13
17
21
25
29
33
37
41
45
49
53
57
61
65
69
73
77
81
85
89
Route
(b). 750m2 Topology Size Figure 5.11. Observed Average Number of Hop Nodes
93
93
97
Texas Tech University, Ivan G. Guardiola, December 2007 Normal Probability Plot Standardized Residual
Versus Fits
99.99
5.0
Percent
99
2.5
90 50
0.0
10
-2.5
1
-5.0
0.01
-5.0
-2.5 0.0 2.5 Standardized Residual
5.0
0.0
1.5
3.0 Fitted Value
4.5
6.0
Versus Order Standardized Residual
Histogram 5.0
240
2.5
180
0.0
120
-2.5
60
-5.0
0 -4.5 -3.0 -1.5 0.0 1.5 3.0 Standardized Residual
1 50 0 0 50 00 5 0 00 5 0 0 0 50 0 0 50 0 0 5 0 00 5 0 00 1 1 2 2 3 3 4 4 5 5 6 6 7 7 8
4.5
Observation Order
Figure 5.12. Residual Plots for the Average Delay
mobile wireless ad-hoc network. Hence, in order to assure that these results are sound a visual inspection of the residuals of this response is performed. In Figure 5.12, the residual associated with the average delay performance measure are displayed. It appears that the residuals are randomly distributed and do not show dispersion trends that would suggest that the assumptions of the analysis of variance are being violated. There are a few outliers present, which can be attributed to the fact that the distributions seem to possess heavy tails. This heavy tail characteristic can be observed in the histogram plot and the normal probability plots. However, the residuals versus order do not show any form of patterns that would suggest non-linearity or non-constant variance. Thus, the analysis of variance and its corresponding p-values are sound and allow for proper interpretation. In order to quantify the statistical significance of the inclusion of the GPS-BM, a plot of the observed values for the average delay performance measure are concatenated for both environment sizes in Figure 5.13, where (a) is the 1000m2 and (b) is the 750m2 results. It can be observed that in the 1000m2 environment 58 of 94
Texas Tech University, Ivan G. Guardiola, December 2007
6 GPS No-GPS 5
Average Delay
4
3
2
1
97 10 0
94
88 91
82
85
79
76
73
67 70
64
61
58
55
49 52
43
46
37
40
28
31 34
25
22
19
13 16
10
7
1
4
0
Route
(a). 1000m2 Topology Size 4.5
GPS No-GPS 4
3.5
2.5
2
1.5
1
0.5
Route
(b). 750m2 Topology Size Figure 5.13. Observed Average Delay
95
94 97 10 0
88 91
82 85
76 79
70 73
64 67
58 61
52 55
46 49
40 43
34 37
28 31
19 22 25
10 13 16
7
4
0 1
Average Delay
3
Texas Tech University, Ivan G. Guardiola, December 2007
the 100 routes benefited from the employment of the GPS-BM with a median value of -0.09 seconds. In contrast, in the 750m2 environment only 45 of the 100 routes benefited from the GPS-BM with a median value of 0.02 seconds. Thus, it is interesting to note from these results that larger networks benefit more from the GPS-BM than smaller networks. In Figure 5.13, this result can be seen by noticing that in the 750m2 environment the GPS line is often above the No-GPS line for a large number of routes. 5.4 Chapter Conclusions Through a thorough statistical analysis we were able to not only quantify the performance of the GPS-Blocking Mechanism, but have also derived a great deal of insight concerning which variables affect which responses. Hence, it was found through the analysis presented in this chapter that the GPS-Blocking Mechanism contributes in an improvement in the performance measures of route reliability, packet throughput, and control traffic reduction. In addition, it was also found that the average number of hop nodes within routes and communication delay are not greatly impacted by the GPS-Blocking Mechanism. Thus, we are able to validate the additional overhead to the node participants as it will result in an overall improvement of the MANET. The analysis pertaining to a four-stage nested factorial design allowed us to gain a great deal of insight towards not only how the inclusion of the GPS-Blocking Mechanism boosts the overall performance of the MANET, but also how each of the nested components effect the response of interest. The analysis of variance allowed for the determination of whether mobility, nodes, environment size, and fading are significant to the responses of received packets, control traffic, delay, reliability, and average number of hop nodes in routes. It was found through this analysis of variance that factor effect varies from response to response with no evident ranking capabilities. Hence, we are able to derive to the conclusion that fading and network size are consistently significant for all of the responses previously stated. The factors of mobility model, GPS, and routes vary in significance from one response to the next. Thus, it is through the experimental results presented in this chapter that we are able to support previous propositions and hypotheses stated in the preceding chapter of this document.
96
Texas Tech University, Ivan G. Guardiola, December 2007
CHAPTER 6 CLOSING DISCUSSIONS The mobile wireless ad-hoc network is a highly perplexing research problem, which encompasses and expands across many academic fields of study. However, it is through incremental experimentations that support scientific hypotheses that will result ultimately in a MANET that is reliable and robust and therefore resulting in a viable communication solution. While the applications of MANETs continue to grow, the problems encompassed within a MANET are staying consistent and has spawned a great deal of scientific endeavors within the academic and industry communities. The problems of limited bandwidth, constrained and or limited power, complex mobility, and stochastic effects of fading will always be inherent within a MANET. Thus, it is through experiments and analysis like those presented here that we are able to grasp the complexity of such a communication system. This dissertation showed that additional control overhead is unnecessary, as its addition does not yield noticeable results above protocols with minimal or no additional overhead in the presence of fading. In particular, it has been shown through simulation that the AODV protocol does not outperform the AODvjr protocol, which is a comparison of a high control overhead protocol versus one that has minimal control overhead. The experimentation and scientific endeavors of this dissertation culminated in clearly showing that the proposed GPS-BM is significant. It increased reliability, decreased control traffic, and showed no deterioration of regular throughput measures (i.e. packet received). In contrast, The simulation analysis also showed that the GPS-BM is insignificant in both the hop-count and delay measures. The preceding chapter simulations, and their results, support these notions vigorously. 6.1 Future Research The future directions of the research presented in this dissertation include validation of the GPS-Blocking Mechanism in more popular protocols such as AODV, DSR, and TORA. In addition, further investigation into the significance of fading in the wireless communication medium should be done. Thus, rather than
97
Texas Tech University, Ivan G. Guardiola, December 2007
implementing fading from a statistical distribution, real world data collection should be undertaken. This data collection will allow researchers to use real world signal behavior within a simulation environment, thus greatly increasing the fidelity of current simulation packages. Moreover, it through this real-world experiment that great insights about fading can be made. In addition, other preventative methods for encountering and mitigating the effects of fading should be explored.
98
Texas Tech University, Ivan G. Guardiola, December 2007
REFERENCES Bai, F., & Helmy, A. (2007). A survey of mobility modeling and analysis in wireless ad-hoc networks. In (chap. Submitted for Publication). Kluwer Academic Publishers. Bai, F., Sadagopan, N., & Helmy, A. (2003). The important framework to systematically analyze the impact of mobility on performance of routing protocols for ad hoc networks. Ad Hoc Networks Journal, 1 (4), 383-403. Baker, D., & Ephemides, A. (1981). The archetectural organization of a mobile radio network via a distibuted algorithm. IEEE Transactions on Communications, 19, 1694-1701. Banerjee, A., & Khuller, S. (2002). A clustering scheme for hierarchal control in multi-hop wireless networks. In Proceedings of ieee infocom’02. Basangi, S., Chlamatac, I., Syrotiuk, V., & Woodward, B. (1998). A distance routing effect algorithm for mobility (dream). In In proc. 4th annual acm/ieee int. conf. on mobiloe computing and networking (p. 76-84). Dallas TX. Bertoni, H. (2000). Radio propagation for modern wireless systems. Prentice Hall Inc. Bhatnagar, A., & Robertazzi, T. (1990). Layer net: A new self-organizing network protocol. In In proceedings of milcom’90. Blazevic, L. (2001). Self-organization in mobile ad-hoc networks: The approach of terminodes. IEEE Communications Magazine. Bolanis, C. (1997). Antenna theroy: Analysis and design. John Wiley and Sons Inc. Bravo, M. (2006). Implementation of the aodvjr protocol in ns2. (MAC 330 Computation Module at the University of Sao Paolo) Broch, J., Johnson, D., & Maltz, D. (1998). The dynamic source routing protocol for mobile ad-hoc networks. Internet Draft: draft-ietf-manet-dsr-00.txt. Calvin, D., Sasson, Y., & Schiper, A. (2002). On the accuracy of manet simulators. In Workshop on principles of mobile computing. Camp, T., Boleng, J., & Davies, V. (2002). A survey of mobility models for ad-hoc network research. WCMC: Special ISsues on Mobiole Ad-hoc Networking : Research Trends and Applications, 2 (5), 483-502.
99
Texas Tech University, Ivan G. Guardiola, December 2007
Capkun, S., Hamdi, M., & Hubaux, J. (2001, January). Gps-free positioning in mobile ad-hoc networks. In In proceedings of the hawaii international conference on system sciences. Chakeres, I., & Klien-Berndt, L. (2002). Aodvjr: Aodv simplified. ACM SIGMOBILE Mobile Computing and Communications Review, 3 (3), 100-101. Chen, B., Jamieson, K., Balakrishnan h., & Morris, R. (2001). Span: energy-efficient coordination algorithm for topology maintanence in ad hoc wireless networks. In Proc. of the 7th annual international conference on mobile computing and networking. Chen, B., Yang, J., Zhao, W., Ammar, M., & Zequra, E. (2006). Multi-casting in sparse manets using message ferrying. In Wireless communication and networking conference. Corson, M., & Macker, J. (1999). Mobile ad-hoc networking(manet): Routing protocol performance issues and evaluation considerations. Request for Comments 2501. Cox, D. (1995, April). Wireless personnal communications: What is it? IEEE Personal Communications, 20-35. Cuoto, D., Bicket, J., & Morris, R. (2005). A high-throughput metric for multi-hop wireless r0outing. Wireless Netowrks, 11 (4), 419-434. Das, B., Sivakumar, R., & Bharghavan, V. (1997). Routing in ad-hoc networks using a spine. In In proceedings of the 6th international conference on computer communications and networks. Las Vegas, NV. Das, S., Castaneda, R., & Yan, J. (2000, July). Simulation based performance evaluation of mobile, ad hoc network routing protocols. ACM/ Baltzer Mobile Networks and Applications Journal, 179-189. El-Rabbanny, A. (2002). Introduction to gps: The global positioning system. Boston, MA: Artech House. El-Rabbany, A. (1994). The effect of physical correlations on the ambiguity and accuracy estimation in gps differential positioning. Fredicon, Brunswick, Dept. of Geodesy and Geamatics Engineering. Fall, K., & Varadhan, K. (2002). The ns-2 manual (Technical Report, The VINT Project). UC Berkeley.
100
Texas Tech University, Ivan G. Guardiola, December 2007
Frenzel, L. (2006). The cell phone-simply irresistable. Electronic Design, 54 (1), 90-61. Ganesan, D., Krishnamachari, B., Woo, A., Culler, D., Estrin, D., & Wicker, S. (2002). Complex behavior at scale: An experimental study of low power wireless sensor networks. UCLA/CSD-TR 02-0013. Green, E. (1989, December). Path loss signal variability analysis for microcells. In 5th ieee international conference on mobile radio and personal communication (p. 38-42). Warwick, U.K. Guardiola, I., & Matis, T. (2007a). On the utility of supplementary control overhead in mobile ad-hoc protocols. In In proc. of the 2007 networking and electronic commerece research conference. Riva Del Garda, Italy. Guardiola, I., & Matis, T. (2007b). A statistical viewpoint in the use of gps information in wireless ad-hoc networks. International Journal of Mobile Network Design and Innovation, 2 (2). Haas, Z., & Tabrizi, S. (1998). On some challenges and design choices in ad hoc communications. In Ieee milcom’98. Bedford, MA. Hauspie, M., Simplot, J., & Carle, J. (2003). Partition detection in mobile ad-hoc networks. In In proceedings of the 2nd mediterranean workshop on ad-hoc networks. Tunisia. Hofmann-Wellenhof, B., Lichtenegger, H., & Collins, J. (2001). Global positioning system: Theory and practice (5th ed.). Springer-Verlag. Hong, X., Gerla, M., Pei, G., & Chiang, C. (1999). A group mobility model for ad hoc wireless networks. In Acm/ieee mswim ’ 99. Seattle, Washington. Hou, T., & Li, V. (1986, January). Transmission range control in multihop packet radio networks. IEEE Transactions on Communications, 34 (1), 38-44. Howard, R. (2007, July). The fuss about fading. Communication Systems Design. Jacquet, P., Muhlethaler, P., Qayyum, A., Laouiti, A., Viennot, L., & Clausen, T. (2001, September). Optimized link state routing protocol. Internet Draft. Jardosh, A., Belding-Royer, E., Almeroth, K., & Suri, S. (2003). Towards realistic mobility models for mobile ad hoc networks. In Mobicomm’03. San Diego, California. Jiang, M., Li, J., & Tay, Y. (1999). Cluster based routing protocol (cbrp) functional
101
Texas Tech University, Ivan G. Guardiola, December 2007
specification. Internet Draft: draft-ietf-manet-cbrp-spec-01.txt. Johnson, D. (1994). Routing in ad-hoc network of mobile hosts. In Ieee workshop on mobile computing systems and applications. Johnson, D., & Maltz, D. (1996). Dynamic source routing in ad-hoc wireless networks. Kluwer Academic Publishers. Khelil, A., Marron, P., Dietrich, R., & Rothermel, K. (2005). Evaluation of partition-aware manet protocols and applications with ns-2. In In proceedings of the international symposium on performance evaluation of computer and telecommunication systems. Ko, Y., & Vaidya, N. (1998). Location-aided routing (lar) in mobile ad hoc networks. In Proceedings of mobicom’98. Dallas, TX. Kotz, D., Newport, C., & Elliot, C. (2003). The mistaken axioms of wireless network research. (Darmouth College, Computer Science Dept.) Krishna, P., Vaidya, N., Chatterjee, M., & Pradhan, D. (1997). A cluster-based approach for routing in dynamic networks. Computer Communications Review, 27. Laasonen, K. (2003, September, 22). Radio propagation modeling. Algorithms for Ad-Hoc Networking Seminar. LaMarie, R., Krishna, A., & Bhatwat, P. (1996, August). Wireless lan and mobile networking standards and future directions. IEEE Communications Magazine. Leiner, B., Neilson, D., & Tobagi, F. (1987). Issues in packet radio network design. In Proceedings of the ieee. Lenders, V., Wagner, J., & May, M. (2006). Analyzing the impact of mobility in ad-hoc networks. In Realman 06. Florence, Italy. Lin, J. (2004). Controversy over cellular mobile-telecommunication base-station-antenna installations. IEEE Antennas and Propagation Magazine, 46 (1), 155-156. Lin, R., & Gerla, M. (1997). Adaptive clustering for mobile wireless networks. Journal on Selected Areas in Communications, 15 (7). Linnartz, J. (1993). Narrowband land-mobile radio networks. Boston, Massachussets: Artch House. MacDonald, V. (1979). The cellular concept. The Bell Systems Technical Journal,
102
Texas Tech University, Ivan G. Guardiola, December 2007
58 (1), 15-43. Mauve, M., Widmer, J., & Hartenstein, H. (2001, November). A Survey on Position-Based Routing in Mobile Ad-Hoc Networks. IEEE Network Magazine, 15 (6), 30-39. McDonald, A., & Znati, T. (1999). A mobility-based framework for adaptive clustering in wireless ad-hoc networks. IEEE Journal on Selected Areas of Communications, 17, 1466-1487. Mukherjee, A., Bandyopadhyay, S., & Saha, D. (2003). Location management and routing in mobile wireless networks (Vol. 3-10). Boston: Artech House. Mullen, J., Matis, T., & Rangan, S. (2004). The receiver’s dilema. In Mobile and communications networks: Proceedings of the ifip 06 wg6.8 conference on mobile and wireless communication networks. Paris, France. Neskovic, A., Neskovic, N., & Paunovic, G. (2000). Modern approaches in modeling mobile radio systems propagation environments. IEEE Communications Surveys, 2-12. Nidd, M., Mann, S., & Black, J. (1997). Using ray tracing for site-specific indoor radio signal strength analysis. In Ieee vehicular technology conference. Noerpel, A., & Lin, Y. (1998, June). Wireless local loop: Architecture, technologies and services. IEEE Communications Magazine. Padgett, J., Gunther, C., & Hattori, T. (1995, January). Overview of wireless communications. IEEE Communications Magazine, 28-41. Park, V., & Corson, M. (1997). Temporally-ordered routing algorithm (tora) version 1: Functional specifiction. Internet Draft: draft-ietf-manet-tora-00.txt. Parkingson, B., & Gilbert, S. (1983). Navstar: Global positioning system - ten years later. In Proceedings of the ieee (Vol. 71, p. 1177-1186). Perkins, C. (1997a). Ad-hoc on demand distance vector (aodv) routing. Internet Draft: draft-ietf-manet-aodv-00.txt. Perkins, C. (1997b, May). Mobile ip. IEEE Personal Communications Magazine. Perkins, C. (2000). Ad-hoc networking (1st ed.). Addison-Wesley. Perkins, C., & Bhagwat, P. (1997). Highly dynamic destination sequenced distance-vector (dsdv) for mobile computers. In Sigcomm’ 94 conference on communication architectures, protocols and applications.
103
Texas Tech University, Ivan G. Guardiola, December 2007
Prakash, R. (1999). Unidirectional links prove costly in wireless da-hoc network. In Proceedings of the 3rd international workshop on discrete algorithm and methods for mobile computing and communications. ACM Press. Punnoose, R., Nikitin, P., & Stancil, D. (2000). Efficient simulation of ricean fading within a packet simulator. In Proc. of ieee vehicular technology conference (p. 764-767). Rappaport, T. (2002). Wireless communications: Principles and practices (2nd ed.). Prentice Hall. Robertson, P., & Kaiser, S. (1999). The effects of doppler spreads in ofdm(a) mobile radio systems. In Ieee conference on vehicular technology. Rodoplu, V., & Meng, T. (1999). Minimum energy mobile wireless networks. IEEE Journal of Selested Areas of Communications, 17 (8). Royer, E., & Toh, C.-K. (1999, April). A review of current routing protocols for ad hoc wireless networks. IEEE Personal Communications, 90-100. Shaw, M., Sandhoo, K., & Turner, D. (2000). Modernization of the global positioning system. GPS World, 11 (9), 36-44. Sheth, A., & Han, R. (2002). A mobility-aware adaptive power control algorithm for wireless lans a short paper. IEEE CAS Low Power Workshop. Sollacher, R., & Greiner, M. (2006). Impact of interference on the wireless ad-hoc networks capacity and topology. Wireless Networks, 12, 53-61. Toh, C. (2002). Ad hoc wireless networks: Protocols and systems. Prentice Hall. Varshney, U., & Vetter, R. (2000). Emerging mobile and wireless networks. Communications of the ACM, 43 (6), 73-81. Wieseltheir, J., Nguyen, G., & Ephremides, A. (2001). Algorithms for energy-efficient multicasting in static ad hoc wireless networks. Journal on Special Topics in Mobile Networking and Applications, 43 (6), 53-61. Xu, Y., Heidemann, J., & Estrin, D. (2006). Adaptive energy conserving routing for multihop ad hoc networks. (Submitted for publication, Internet Draft)
104
Texas Tech University, Ivan G. Guardiola, December 2007
APPENDIX A: MODIFICATION OF NS-2.31 SOURCE CODE /* Modification was done to the wireless_phy.cc file */ #include #include #include #include using std::cout; using std::endl; ... int WirelessPhy::SendUp(Packet *p) { ... if(propagation_){ s.stamp((MobileNode*)node(),ant_,0,lambda_); Pr=propagation_->Pr(&p->txinfo_,&s,this); /* This is GPS Euclidean code */ float CommRange=160.0;// sets nominal range struct hdr_cmn* pty=HDR_CMN(p);//header of p if(pty->ptype()==PT_AODVjr){//check if AODVjr p struct hdr_aodvjr* aodvjr=HDR_AODVjr(p); double Xt,Yt,Zt,Xr,Yr,Zr; s.getNode()->getLoc(&Xr,&Yr,&Zr);//loc of receiver p->txinfo_.getNode()->getLoc(&Xt,&Yt,&Zt);//loc of trans double dx=fabs(Xr-Xt);
105
Texas Tech University, Ivan G. Guardiola, December 2007
double dy=fabs(Yr-Yt); float Dist=sqrt(dx*dx+dy*dy);//distance if(aodvjr->tipo_hdr==AODVjr_RREQ || aodvjr->tipo_hdr==AODVjr_RREP){ //check if control packet type if (Dist>CommRange){ pkt_recvd=0; \\resets packet flag; cout