www.nature.com/scientificreports
OPEN
Mixed Linear Model Approaches of Association Mapping for Complex Traits Based on Omics Variants
received: 23 September 2014 accepted: 07 April 2015 Published: 30 July 2015
Fu-Tao Zhang*, Zhi-Hong Zhu*, Xiao-Ran Tong, Zhi-Xiang Zhu, Ting Qi & Jun Zhu Precise prediction for genetic architecture of complex traits is impeded by the limited understanding on genetic effects of complex traits, especially on gene-by-gene (GxG) and gene-by-environment (GxE) interaction. In the past decades, an explosion of high throughput technologies enables omics studies at multiple levels (such as genomics, transcriptomics, proteomics, and metabolomics). The analyses of large omics data, especially two-loci interaction analysis, are very time intensive. Integrating the diverse omics data and environmental effects in the analyses also remain challenges. We proposed mixed linear model approaches using GPU (Graphic Processing Unit) computation to simultaneously dissect various genetic effects. Analyses can be performed for estimating genetic main effects, GxG epistasis effects, and GxE environment interaction effects on large-scale omics data for complex traits, and for estimating heritability of specific genetic effects. Both mouse data analyses and Monte Carlo simulations demonstrated that genetic effects and environment interaction effects could be unbiasedly estimated with high statistical power by using the proposed approaches.
Both natural and experimental populations harbor an array of phenotypic variations because of the complicate genetic architecture underlying quantitative traits. It is well documented that the genetic basis responsible for phenotypic variability consists of individual causal genes and interacting networks, with their specific effects in multiple environmental conditions. Gene-by-gene (epistasis or GxG) and gene-by-environment (GxE) interactions, such as chicken comb type1, animal coat color, and the ABO blood group in humans, are confirmed to exist2. Complex traits are controlled by multiple loci, which harbor polymorphisms that give rise to phenotypic variation in a population. Complex traits cannot be studied by testing a single locus at a time, especially when the contribution of each locus is small3. To understand the genetic architecture of variation for complex traits, we need to perform system level analyses that encompass genome-wide SNPs, transcripts, proteins, and metabolites by considering the effects of GxG and GxE interactions. In the past decades, an explosion of new high throughput technologies enables omics studies at multiple levels (such as genomics, transcriptomics, proteomics, and metabolomics). At each level it is possible to construct interaction networks associated with complex traits (including diseases)4. These large-scale omics data provide great opportunity for biological understanding, but integrating the diverse omics data and environmental effects in the analyses has remained a challenge. New computational methods need be developed to understand these complex heterogeneous omics data5–9. The analysis of large omics datasets, especially two-loci interaction analysis, involves intensive computation. Heterogeneous computational environments including graphic processing units (GPUs) system can provide effective solutions for large-scale data sets analysis10. CPU-GPU heterogeneous parallel computing is very common nowadays. Linkage analyses and association analyses are two genetic mapping approaches used to assess the relation between the genotypic and phenotypic variations on a population scale. Taking advantage of conventional molecular markers, efficient statistical methods of QTL (Quantitative Trait Locus) mapping have become pervasive11 since the landmark approach (interval mapping) developed by Lander and Botstein12. Since then, several methods have been developed for searching epistasis13–17 and GxE interactions18–21. Institute of Bioinformatics, Zhejiang University, Hangzhou, China. *These authors contributed equally to this work. Correspondence and requests for materials should be addressed to J.Z. (email:
[email protected]) Scientific Reports | 5:10298 | DOI: 10.1038/srep10298
1
www.nature.com/scientificreports/
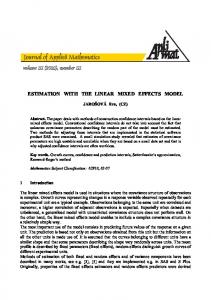
Figure 1. A combined platform for linkage and association analyses (a) GxG plot generated by QTX mapping. Circle= additive effect locus; Line between two circles= epistasis effect of two loci; Red color= main effect; Green color= environment-specific effect; Blue color= both main and environment-specific effects; Black color= involving epistasis but with no individual locus effect; (b) GxE plot generated by QTX mapping. The left axis is the values of genetic effects, and the bottom axis is the SNP ID for loci; Red column= main effect, green line= environment-specific effect; A= additive effect; AA= additive-by-additive epistasis effect; (c) Linkage mapping for quantitative trait loci of independent variants of phenotype (QTL), transcript (eQTL), protein (pQTL), and metabolite (mQTL). (d) Association mapping for phenotypic variation due to independent variants of quantitative trait SNP (QTS), quantitative trait transcript (QTT), quantitative trait protein (QTP), and quantitative trait metabolite (QTM). (e) Association mapping for different independent variables to dependent variables among phenotypic and 4 omics variants.
Mixed linear model-based composite interval mapping (MCIM)22–24 could detect both GxG and GxE interactions by experimental data involving multiple environments (or treatments). However, with the recent development of high-throughput genotyping technologies, genetic association analyses have become common tools for uncovering causal genetic variants and networks at the whole-genome level25. In 1947, Fisher first used linkage disequilibrium (LD) information to map casual loci for human blood types26. So far, many mapping studies of human diseases and complex traits by genetic association analyses have revealed plenty of novel loci and provided insight into the biology of diseases. Several methods have been published for exhaustive epistasis analysis27–31. However these methods cannot integrate other omics data except genome data. Because associating DNA (Deoxyribonucleic Acid) polymorphism with phenotypic variation omits all of the intermediate steps in the chain of causation from genetic perturbation of variation in quantitative traits, the intermediate molecular variables such as transcript abundance could allow us to interpret the causal networks32. The RNA expression microarray has been combined with other experimental approaches to find the key mechanism of complex traits33. One such technique considers the transcript abundance as a quantitative trait, known as expression quantitative trait locus (eQTL)34. Other approaches are to identify significantly expressed transcripts underlying complex traits by using a Pearson correlation coefficient35 and multiple linear regression36, in which the GxG and GxE at transcript levels are ignored. Despite intensive efforts to explain genetic variation of quantitative traits, which have identified a great number of genetic variants and transcripts for various complex traits, we still fall short of understanding the mechanism of the genetic architecture of complex traits. In this study, mixed linear model approaches are proposed to identify genetic effects of individual loci, epistasis effects of pair-wise loci (Fig. 1a), as well as GxE interaction (Fig. 1b), which is applicable Scientific Reports | 5:10298 | DOI: 10.1038/srep10298
2
www.nature.com/scientificreports/ for genome-wide association studies (GWAS). Our approaches consist of four steps in statistical analyses: (1) one-dimension search for individual loci; (2) exhaustive two-dimension search for epistasis loci; (3) stepwise search for fitting a full genetic model, including candidate loci with main effects, epistasis, and GxE interaction; and (4) estimating gene effects of individual and epistasis loci detected in previous process by method of Monte Carlo Markov Chain via Gibbs Sampling24,37. All these processes have been implemented in a GPU-based mapping software, named QTXNetwork. With the massive parallel nature of multi-GPUs, association analyses can be performed for detecting loci on large-scale omics data for complex traits, and for estimating variance components of genetic effects. QTXNetwork consists of three functional modules: quantitative trait locus (QTL)38 for QTL analyses (Fig. 1c), quantitative trait SNP (QTS) for genome analyses and quantitative trait transcript/protein/metabolite (QTT/P/M) for transcriptome, proteome, or metabolome analyses (Fig. 1d). Association analyses can also be conducted for networks among four omics variants (Quantitative Trait X for SNPs, Transcripts, Proteins, and Metabolites) (Fig. 1e). By analyzing mouse datasets on anxiety and Monte Carlo simulations for linkage mapping of QTLs, association mapping of QTSs and QTTs, we demonstrated that unbiased estimation could be obtained for genetic effects of causal genes. The package QTXNetwork can be downloaded at the following website http://ibi.zju.edu.cn/software/QTXNetwork.
Results
Analysis of mouse data. We applied our proposed statistical methods for mapping QTLs, QTSs, and QTTs to searching for the genetic mechanism of anxiety in 71 BXD recombinant inbred (RI) strains of mice (n = 528 mice). Differences in the phenotypes are evident in the parental strains. For example, the maternal strain C57BL/6J exhibits lower anxiety- and fewer stress-related effects than the paternal strain DBA/2J, which exhibits greater fear-related responses39. Animals of 71 BXD RI strains, 60 to 120 days old, were used. These strains were derived by crossing C57BL/6J (B6) and DBA/2J (D2) strains in the 1970s (BXD1-32; 26 strains) and 1990s (BXD33-42; 9 strains)40. Genotypes of the BXD strains were generated at the University of Tennessee Health Science Center. A total of 3795 markers covering 19 autosomal chromosomes and one sex chromosome were genotyped, including 3,033 SNPs and 762 SSRs (Simple Sequence Repeats). Many adjacent markers had identical strain distribution patterns. Therefore, we selected 2,320 markers for the subsequent analysis (1,814 SNPs and 506 SSRs). On the other hand, there were 46,643 transcripts in total. Because many of them appeared to show no or little variation, we selected 4,193 transcripts with relatively large variance (coefficient of variation CV > 1.0%). Anxiety-related behavior was examined in the closed quadrants of an elevated zero maze, a standard tool for testing anxiety41, under five conditions: 1) animals acutely restrained and receiving ethanol; 2) animals acutely restrained and receiving saline; 3) animals receiving only a saline injection; 4) animals receiving only an ethanol injection; and 5) animals not restrained or receiving any injection. Acutely restrained animals were placed in an immobilization tube for 15 minutes. Animals receiving injections were given either ethanol (1.8 g/kg) or saline and were returned to their home cages. The activities of the test session were recorded in the closed quadrants. As shown in Fig. 2 and Table 1, there were three QTLs detected by linkage analysis on chromosomes 1 and 11, of which Q1 (within 25.2 Mb ~ 27.1 Mb) and Q2 (within 169.1 Mb ~ 169.8 Mb) were on chromosome 1, and Q3 (within 44.6 Mb ~ 53.9 Mb) was on chromosome 11. These three loci were confirmed by QTS association analysis with precision location (Q1 at 27.1 Mb, Q2 at 169.1 Mb, and Q3 at 52.8 Mb). Two extra QTS sites were also discovered on chromosome 11 (Q4 at 35.3 Mb and Q5 at 36.5 Mb). The QTS mapping matched well with exact position of identified SNP and higher power than QTL mapping. For the three loci detected by QTL and QTS mapping, only one was confirmed by QTT mapping (Q2 at 169.1 Mb), but another one was revealed nearby (Q6 at 155.5 Mb). It is apparent that QTT mapping can only discover transcript loci at the time when they are expressed. As shown in Table 2, the epistasis loci QQ1 was identified with similar predicted effects by both QTL mapping (D1Mit291 × rs3659789) and QTS mapping (D1Mit291 × rs3717220). Compared with the QTL mapping, QTS mapping appeared to have higher statistical significance. Because no transcription QQ1 was detected on chromosome 1, there might have been no significant association of transcript epistasis QQ1 at the time when the tissue used for mRNA extraction was collected. There was another transcript epistasis QQ2 (ILM100060136 × ILM1740047) that was detectable only by QTT mapping.
Monte Carlo simulations. A simulation study with 200 replications was conducted. The BXD mouse genetic map was used to generate three simulated populations for mapping QTLs, QTSs, and QTTs. Initially, we generated a simulated population for QTS mapping with 200 RIL genotypes consisting of 2,320 SNPs covering 2,037.6 cM. Five QTSs (denoted Q1, Q2, Q3, Q4, and Q5) were assumed to control the simulated trait. Four of the five QTSs were involved in the three pairs of two-way interactions, denoted QQ1 for Q1 × Q3, QQ2 for Q1 × Q4, and QQ3 for Q3 × Q4. The whole-genotype individuals were investigated in three environments. The individual SNPs and interactions were set to account for as much as 20% in total heritability (hG2+ GE ). Detailed genetic information is listed in Table S2 and Table S3. For 200 simulations, we can detect significant individual QTLs/QTSs and pair-wise epistasis QTLs/QTSs. Power (%) was calculated as the percentage of true loci significantly detected. Mean of estimated genetic Scientific Reports | 5:10298 | DOI: 10.1038/srep10298
3
www.nature.com/scientificreports/
Figure 2. F-statistic plots from 1D genome scans by QTL linkage analysis, QTS and QTT association analysis on the 1st chromosome (a) and the 11th chromosome (b) (a) F-statistic plots from 1D genome scans by QTL, QTS, and QTT analyses on chromosomes 1. (b) F-statistic plots from 1D genome scans by QTL, QTS, and QTT analyses on chromosomes 11.
Method QTL
QTS
QTT
Chromosome (Position, Mb)
SNP Name
q
qe1
qe2
qe3
qe4
Q1: Chr1 (25.2-27.1)
mCV22980985
30.8‡
–18.7*
27.6‡
–19.8*
25.6†
Q2: Chr1 (169.1-169.8)
D1Mit145
–33.4‡
Q3: Chr11 (44.6-53.9)
rs13481018
30.6‡
–28.3†
35.3‡
–24.0**
29.5†
Q1: Chr1 (27.1)
mCV22980985
Q2: Chr1 (169.1)
D1Mit145
Q4: Chr11 (35.3)
rs13480963
Q5: Chr11 (36.5)
rs3724175
qe5
4.2+ –19.3‡
6.5
*
Q3: Chr11 (52.8)
rs13481027
Q6: Chr1: (155.5)
ILM780091
61.3‡
Q2: Chr1: (169.1)
ILM104050068
45.5
–41.6‡
36.5‡
30.1
–21.2**
45.9
23.2
‡
‡
‡
–23.1‡ 29.4
*
19.0*
†
32.8‡
–18.0
**
Table 1. Estimated positions and effects of individual loci detected by QTL linkage analysis, QTS and QTT association analyses. Note: q = additive effect of QTL and QTS, individual transcript loci effect of QTT; qe = locus by environment interaction effect; Signal after the effects, *α EW