Page 1 ... Mixed simulation-optimization technique for complex water resource system analysis under drought conditions. 3 module communicates model ...
MIXED SIMULATION-OPTIMIZATION TECHNIQUE FOR COMPLEX WATER RESOURCE SYSTEM ANALYSIS UNDER DROUGHT CONDITIONS GIOVANNI M. SECHI & ANDREA SULIS CRIFOR – UNICA, University of Cagliari - Italy
Abstract
The paper illustrates a Decision Support System (DSS) for multi-reservoir water resource systems, named WARGI (Water Resources system optimization aided by Graphical Interface). WARGI was upgraded in the SEDEMED II Project to implement a mixed approach that uses optimization and simulation techniques to select the best combination of proactive and reactive measures under drought conditions. The DSS aims to predict in advance the consequences of management assumptions in a predefined system configuration. The optimization module considers future hydrological and demand scenarios to modify the set of decision variables to be adopted by the simulation module. Lastly, WARGI’s application to the water resource system of Southern Sardinia (Italy) is illustrated. Key words: Simulation and optimization of water resource systems; Drought management.
1. Introduction Appropriate management of complex water supply systems, when operating under water scarcity conditions, requires adoption of modelling tools helping decision-makers identify sets of actions able to mitigate the impact of drought on users. Usually, mitigation actions translate into variations in management rules and structural actions on system configuration, following either a reactive or a proactive approach to the drought phenomenon (see for instance Yevjevich et al., 1983; Rossi, 2000). The reactive approach consists in measures adopted both during and after the drought period, once its consequences are perceived. While this approach is still today the most common response to drought emergencies, obviously, the actions undertaken are as a rule of brief duration and non-structural in nature, entail high economic and environmental costs for the community and often do not reduce the system’s vulnerability to similar future events. The proactive approach consists in a series of measures which may also include
Giovanni M. Sechi & Andrea Sulis
2
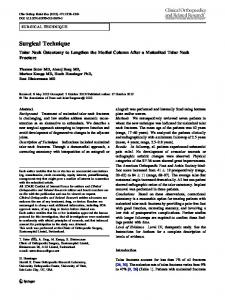
structural actions on the system, coherently developed in a planning strategy; they are designed well in advance of the start of the drought period, and implemented also during and after. The aim of such measures is to reduce the system’s vulnerability and increase its reliability under drought conditions. Identification of proactive measures requires availability of appropriate modelling tools organized in Decision Support Systems (DSS). Implementation of the proactive approach for identifying actions to be adopted, both in the short and long term, is developed by considering alterative options whose effectiveness is evaluated with comparative analysis procedures. Usually, assessment of system performance under a predefined infrastructural setup and with assigned management techniques is as a rule achieved by means of simulation models, while optimization models are employed to assess “theoretical” system efficiency when management is hypothetically implemented by an ideal manager. In previous works (Sechi and Zuddas, 2000; Sechi et al., 2004; Sechi and Sulis, 2005; Sulis, 2006) we illustrated how, in developing the WARGI DSS we had attempted to analyze complex water systems under different scenarios in a userfriendly manner thanks to implementation of a specialised graphical interface. WARGI combines possibilities of evaluating system efficiency by adopting a representation adhering to reality, as allowed by simulation models, with the exploratory potential afforded by optimization models. The structure of WARGI consists of various independent macro-modules (some of which were already described in Sechi et al., 2004) linked together through transfer of encoded variables (Figure 1). The toolkit is implemented in Linux environment and encoded in C++ and Tcl/Tk. As was illustrated in (Manca et al., 2004; Sechi and Sulis, 2005), the system initialisation and input module (Initialization and Hydrologic Data Input) handles value definition of the main parameters and the creation and possible modification of system elements. This module processes data coming from the Graphical User Interface module, transfers data required for formulating the optimization module (WARGI-OPT) and implements the simulation algorithm (WARGI-SIM). Software construction by means of independent modules also makes it possible to use the toolkit either for system optimization alone (WARGI-OPT) or for simulation alone (WARGI-SIM). If, moreover, analysis with scenario optimization is required, the Scenario Generation module passes to the WARGI-OPT module (Pallottino et al., 2005) parameters for model construction. Water supply system analysis with the use of non-conventional resources is implemented in the WARGI-QUAL module (Salis et al., 2005) which links use of resources available to compliance with quality requirements. The procedure associated with solution of the optimization model determines creation of a standard .mps (mathematical programming standard) file, which is used as interface with the solving code. The WARGI-OPT
Mixed simulation-optimization technique for complex water resource system analysis under drought conditions
3
module communicates model structure to the Solver module, responsible for connection with the user-selected software for resolving the optimization problem and enables management of information pertaining to results obtained. The user is able to view results in graphic format through the information visualised in the Graph Plotting module.
Fig. 1. WARGI toolkit components The application potential of WARGI has been tested on some real systems in the framework of previous European Projects WAMME (WAMME, 2003) and SEDEMED (SEDEMED, 2003). The WARGI-SIM simulation module was also used in the Water-Basin Plan (Piano Stralcio di Bacino) of the Region of Sardinia (RAS, 2005) to identify supply possibilities of multi-sector systems and the deficits associated with various use types in the drought-prone hydrological scenarios taken as reference for the Plan. In the rest of this paper, we will limit description of the WARGI toolkit to those aspects regarding interaction between the simulation module (within which infrastructural setup and management preferences are defined) and the optimization module which, with regards to different hydrological and demand scenarios, identifies short and medium-term actions as proactive measures to be implemented in system management. We will briefly recall the methodological context and the scientific literature, thereafter, we illustrate interactions between the two modules and analysis of results obtained on the Flumendosa-Campidano system, used as a test-case in the SEDEMED II Project.
Giovanni M. Sechi & Andrea Sulis
4
2. Interaction between Simulation and Optimization in water resource system modelling In recent decades simulation models have been extensively applied to real case water resource systems and are indeed still the mainstay for these analyses (Hufschmidt and Fiering 1966; Yeh 1985; Loucks and van Beek 2005). In contrast, the use of optimization models for real-case water resource system management is rare. Nevertheless, optimization modelling is well documented in academic and research literature (Loucks et al. 1981; Yeh 1985; Labadie 2004). In general terms simulation models provide the response of a system with an assigned set of resource characteristics, resource availabilities and demands and predefined operating rules. Therefore, simulation models are mainly used to assess the economic benefits which may be generated by alternatives that are examined in a sequence of simulation steps. Again in general terms, simulation models do not define optimal operating rules to be used in system management; for their identification it is necessary to use iterative procedures of the trial-and-error type. The search for optimal operating rules may thus prove rather time consuming, in view of the large number of alternative scenarios to be explored. It is desirable to use a modelling approach combining the representational flexibility of simulation models with the efficient state exploration of mathematical optimization models. In research-oriented applications, various strategies are employed to combine simulation and optimization (Wurbs 1993). Dorfman (1965) argued that using optimization to screen the full range of alternatives offers significant economies in the analysis of large river basin systems. Jacoby and Loucks (1972) analyzed the difficulties and advantages of the joint use of these two types of models in both static and dynamic planning problems. Stendinger et al. (1983) presented a brief state-of-the-art review of screening models developed over the last two decades, analyzing their ability to identify cost-efficient designs. Simonovic (1992) made a review of state-of-the-art analysis techniques for reservoir management and operation in large scale, complex problems highlighting the gap existing between research studies and their practical application to real systems. In the search for effective operating policies for multi-purpose multi-reservoir systems, Karamouz et al. (1992) generalized a dynamic programming model already described by Karamouz and Houck (1982) for application to single reservoirs. Lund and Ferreira (1996) presented a network flow based optimization model (HEC-PRM by USACE) coupled with a simplified simulation model for refining and testing operating rules. Oliveira and Loucks (1997), and subsequently Ahmed and Sarma (2005), used genetic algorithm. Randall et al (1997) described a linear programming model embedded in a month-by-month simulation model to be used for water supply planning. Nalbantis and Koutsoyiannis (1997) proposed and tested a parametric rule for a system of reservoirs. The parameters are estimated by optimization, using simulation to evaluate the objective function value for each
Mixed simulation-optimization technique for complex water resource system analysis under drought conditions
5
trial set of parameter values. Sinha et al. (1999), and Neelakantan and Pundarikanthan (2000) developed non-linear programming models for the solution of the linked optimization-simulation model useful for solving reservoir operation and design problems. The process employing optimization to reduce the range of designs and policies requiring simulation and more in-depth evaluation is often called “preliminary screening” (Loucks and van Beek, 2005). Simulation models overcome the limits inherent in optimization models, but they work well only when a relatively small number of alternative combinations of physical facilities and operating procedures needs to be evaluated. Unfortunately, in a complex water resource system the number is quite large and the ‘trial and error’ process of simulation becomes very time consuming. The use of preliminary screening techniques, which couple analysis with an optimization model to shrink the range of alternative scenarios, highlights the limits of the optimization model (which is simplified so as to be mathematically tractable and computationally efficient in large-size systems) in effectively representing a real-scenario system and clearly indicate the best options. Indeed, we cannot be certain that the two models (simulation and optimization), when applied to the same system, will produce comparable performance index values. Coming down to details, there is no correspondence between the operating rules obtainable from optimum flows given by an optimization model and those we must introduce in a simulation model. On the other hand, although one cannot univocally formulate interactions between optimization and simulation, clearly, simple reliance on simulation based on the “common sense” and experience of the manager in the choice of operating rules is fraught with danger, and may impair objective assessment of potential system efficiency. 3. The coupled simulation-optimization approach in WARGI As an alternative to the simulation-only approach, which requires ‘a priori’ definition of operating rules, or to the off-line use of optimization for preliminary screening of operating rules to be adopted in simulation, in developing WARGI we have adopted a modelling format based on full integration between simulation and optimization modules. As regards the simulation module, this approach does not require the input of precise operating rules, but simply definition of preferences and priorities by the manager. The preliminary requirement for this approach is to achieve in the input phase an adequately detailed description of all components of the water system. This enables the model to identify all implicitly present functional constraints. Thanks to the graphical interface of WARGI-GUI, the user can show the physical
Giovanni M. Sechi & Andrea Sulis
6
system in the form of an oriented graph consisting of nodes and arcs, using maskwindows to enter data on the characteristics of each component. Definition of preferences by the manager implies for each demand node the possibility of providing an ordered list of resources from which a supply flow may be activated to meet the demand. These preferences may be based on physical, economic, legal, contractual or quality considerations, and at all events are subject to assessment of other conditions that make transfer admissible and cost-effective. These conditions can be easily exemplified with reference to reservoir resources for which the manager can define a “target storage”, which may also be differentiated according to periods, and constraints on volumes to be set aside for specific uses. Constraints on volumes may be activated when reservoir status drops below critical levels which the user may associate with the reservoir, thus defining “reserved volumes” for specific use types. Optimal “target storage” and “reserved volume” values are defined through a specific WARGI procedure. Preference criteria may also be assigned to the resource: for instance, we can ensure that supply from flowing water is given priority in use over water that can be collected in reservoirs. Definition of priorities by the manager enables subdivision of the volume required by each use type into priority bands by means of percent rates. Priority bands are identified for each demand node. The supply procedure identifying the volumes transferred in the network from resources to demands thus takes place following established priority levels. When water available is scarce, this makes it possible to avoid imbalances in meeting demands. Once transfer from resources to demands in the simulation time-step has been completed, the definition of resource targets enables WARGI-SIM to activate supplementary flows which make it possible to minimise deviation from the target configuration. Thus, resourcedemand flows are activated in the simulation module through implementation of instruction sequences using a combination of procedures identified, first and foremost, on the basis of the preference and priority criteria established by the manager. Secondly, transfer amounts are defined through interaction between simulator and optimization modules. Use of the optimization module interacting with simulation basically refers to two aspects. The first aspect is linked to identification of the optimal path (essentially the minimum cost path on the oriented system graph) to transfer water to demands having equal priority from resources having equal preference. For resolution of this problem in WARGI we used a modified version of Dijkastra’s algorithm (Dijkastra, 1959). The user can associate with each arc of the graph representing the system the costs, benefits and constraints on transfer possibilities. The constraints are the capacity thresholds of transfer pipelines and plants present in the
Mixed simulation-optimization technique for complex water resource system analysis under drought conditions
7
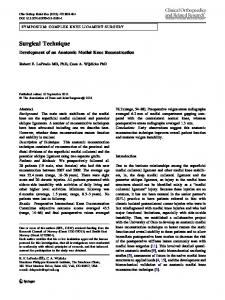
system. Transfer costs or benefits may be dependant on transfer methods (e.g. gravity flow pipelines or pumping systems) or on the manager’s preferences. Economic values and constraints associated with arcs determine the optimal path for flow transfers. Once the lowest cost path has been saturated, an alternative path is searched out on the graph (of gradually increasing cost) between the same resource and demand nodes. If resource-demand transfer is not possible, the lowerpreference resource is sought. As already mentioned, flow transfers are always activated considering decreasing demand priorities. The aim being, in the event deficits arise, to prevent them from affecting higher priority bands in demand nodes. The second interaction aspect with the optimizer regards definition of programmed reductions in supply to demands. For this purpose, flow configurations provided by the WARGI-OPT optimization module can be seen as a reference target for the simulation phase. In a predefined hydrological and demand scenario, flow configuration obtained in optimization can in fact be seen as being that obtained by an ideal manager with perfect knowledge of future events; thus the simulator can operate so as to minimize overall system management costs on the entire time horizon of the scenario (Sechi et al., 2004). This aspect is essential for implementation of mixed optimization-simulation modelling and makes it possible to determine the best combination of proactive and reactive drought mitigation measures. In view of the specific aims of the SEDEMED II project, in the section below we will provide further details on interaction between optimization and simulation with reference to the latter aspect, felt to be especially relevant in the management of water resource systems under drought conditions. 4. Identification of operating rules under resource shortage conditions The aim of DSS WARGI is to define proactive changes to system management operating rules to mitigate the impact of droughts on users. These changes, which anticipate the occurrence of resource shortages, are defined by processing in the simulation module the forecasts provided by the optimization module, based on the assumption of reference hydrological scenarios. Figure 2 plots the interaction between the WARGI-OPT optimization module and the WARGI-SIM simulation module in the analysis of a system on a time horizon covering T periods. During the simulation process (at synchronization instants τi between the simulator and the optimizer) WARGI-OPT defines a system evolution hypothesis on a time horizon ∆, reduced with respect to the overall simulation time horizon T. For this reduced time horizon, on which the optimizer operates, we assume a hydrological scenario (resource input) and a demand scenario (resource output). With regards to these scenarios, the flow configuration provided by the optimizer may be considered as
Giovanni M. Sechi & Andrea Sulis
8
that set by an ideal manager of the system. Based on the information provided by the optimizer, starting from synchronization instant τi the simulator is able to define a set of proactive measures which alter the value of decision variables in the subsequent period. At all events, these measures do not extend beyond the subsequent synchronization step. Thus, simulation explores the system’s response with a set of operating rules modified so as to handle resource shortage situations identified in the optimization phase. The time parameters (defined by the users by means of the graphical interface) in the simulator-optimizer interaction, are as follows: •
T:
time horizon of simulation for overall system analysis;
•
Δ:
time horizon of optimization;
•
t=1,T:
unit simulation step;
•
∂=1, Δ:
unit optimization step;
•
τ =τ1, τn:
instants of simulation-optimization synchronization.
The optimization time horizon Δ must be representative of hydrological variability and demand trends. In particular, in the multi-reservoir systems examined in the SEDEMED II project, its extension is linked to the regulation capacity of the surface reservoirs present in the system. In WARGI, the user defines the system’s configuration and operating procedures by means of graphical interface, specifying his preference and priority criteria as illustrated in the previous paragraph. The most immediate response from interaction of simulation with the optimizer consists in the adoption of limitation procedures for demands with lower priority levels. However, procedures modifying the values of reserved volumes or of target storages in reservoirs may also be adopted. We should point out that in the optimization module, simulation preference and priority criteria are transformed into attribution of transfer-costs and operating constraints along the graph of the system, guiding the solver towards an optimal flow configuration in line with priority and preference criteria provided by the manager. Moreover, due to the above, the system configuration inputted to the optimizer must have a level of adherence to reality similar to that used for simulation.
Mixed simulation-optimization technique for complex water resource system analysis under drought conditions
9
Fig. 2. Interaction between the optimization model and simulation in WARGI Other aspects requiring special attention regard definition of the forecast hydrological scenarios on which the optimizer works and assignment of costs associated with possible deficits, differentiated by priority bands. These two aspects – hydrological criticality and deficit costs – will be expanded on below and in the following sections, illustrating analyses performed on a real case. What emerges from the above discussion is that changes to the operating rules in WARGI-SIM mainly consist in redefinition of the demand configuration. Other proactive actions may however be introduced by the user acting on preference and priority criteria. At each synchronization instant τi, WARGI-OPT defines a set of possible demand reductions in the various centres of the system, in accordance with the preference criteria and critical level of the adopted hydrological and demand scenario. This demand reduction action allows definition of programmed deficit volumes and is a proactive procedure in water crisis management. This consumption measure is based on assessment of the magnitude of water shortage and aims to minimise the vulnerability of higher priority demands in the water resource system during drought periods. On closing the simulation procedure, the overall benefit in resource use can be graphically represented as the area enclosed below the marginal benefit curve identified by the volume supplied. In a predefined situation of admissible elasticity of demand, essentially linked to the programmed reduction period, the loss in benefits consequent on reduction in demand can be expressed by the following integral formula:
Giovanni M. Sechi & Andrea Sulis
10
(1) where Qs indicates request for complete demand satisfaction, Ps the resource’s marginal cost under conditions of completely fulfilled demand, Qr reduced supply during the drought period. To calculate D we need one point of the demand-curve and elasticity E of demand in relation to the programming period. Several static or dynamic models for evaluation of the water demand law (see for instance Agthe and Billings, 1980) and for estimating elasticity (e.g. Moncur, 1987) in the various use types are found in literature. Elasticity is a function of demand type and of proactive or reactive approach. Clearly, E will be very low for demands in high priority bands (e.g. urban uses), where demand varies only slightly in relation to price; also, as a rule the value of elasticity in a short term demand curve is lower than in a long-term curve. Thanks to use of a post-processor integrated in DSS WARGI, we can define for each priority level the losses in unit benefit with respect to long-term demand (identified by WARGI-OPT) and to short-term demand (identified by WARGISIM) which are defined, respectively, as “programmed deficit cost” and “nonprogrammed deficit cost”. As already stated, a second level of interaction between optimization and simulation may involve redefinition of reserved volumes in surface reservoirs as well as redefinition of operating rules. This further level of interaction is subsequent to the above mentioned cost considerations. The assignment of reserved volumes is generally effective on time horizons covering up to a number of years. In real-case applications, which we will address in the following section, we operate with WARGI-OPT in a forecasting context associated with hydrological scenarios of different levels of criticality. Moreover, we work on an optimization time horizon Δ that must be significant with respect to the possibility of system regulation. The correct assumption on time horizon Δ is a critical aspect in defining configuration of the reserved volumes for demands with higher priority.
Mixed simulation-optimization technique for complex water resource system analysis under drought conditions
11
5. Application of the mixed approach to the water resource system of southern Sardinia As explained in the introduction, the application potential of mixed simulationoptimization techniques for analysis of complex water resource systems was assessed in the framework of the SEDEMED II Project considering the water resource system of Southern Sardinia, as defined in the Water-Basin Plan (Piano Stralcio di Bacino) of the Region of Sardinia (RAS, 2005). This system has a storage capacity from surface reservoirs totalling 723•106 m3; aggregate residential demand of 100•106 m3/year; aggregate irrigation demand of 234•106 m3/year; aggregate industrial demand of 19•106 m3/year. Time horizon T in the system analysis is set at 54 years, in line with hypotheses made by the Regional Authorities (RAS, 2005). As regards the system, hydrological inflow data on 19 selected sections are available on a monthly basis. Table I. Hydrological scenarios assessed on the basis of critical observed annual flow (106 m3/year) in the system Optimization Scenario 1 Year 2 Years
3 Years
1st Year 1st Year 2nd Year Average 1st Year 2nd Year 3rd Year Average
1st Critical Case 134.8 223.8 134.8 179.3 214.9 265.9 164.1 215.0
3rd Critical Case 176.3 211.6 208.0 209.8 134.8 300.7 267.7 234.4
5th Critical Case 208.0 134.8 300.7 217.8 309.8 211.6 208.0 243.1
7th Critical Case 211.6 176.3 298.4 237.3 290.8 239.4 221.8 250.7
9th Critical Case 214.9 214.3 290.8 252.6 498.2 223.8 134.8 285.6
11th Critical Case 221.8 312.8 215.9 264.3 298.4 364.5 232.0 298.3
13th Critical Case 232.1 300.7 267.7 284.2 479.2 176.3 298.4 318.0
Based on the observed hydrological series, we can define hydrological scenarios with different extension and criticality (in terms of water shortage) to be considered in the optimization module. Critical hydrological series covering between one and three years, evaluated as the sum of inflows to reservoirs and to diversion sections are listed in Table I . Before applying the mixed simulation-optimization technique, we carried out a simulation-only analysis using the WARGI-SIM module alone. System simulation was implemented considering a time horizon T=54 years divided into unit time intervals t of one month each. Results obtained provide an assessment of the system’s capability to meet water shortage situations when no programmed supply reduction measures are implemented in the system to mitigate drought impacts. This phase thus provides an element of comparison allowing assessment of the benefits of the proactive measures adopted in the following mixed optimizationsimulation approach.
Giovanni M. Sechi & Andrea Sulis
12
Numerous criteria may be used to quantify levels of system performance obtained by the system using predefined operating rules (Hashimoto et al., 1982a; Hashimoto et al., 1982b). These criteria may be obtained from individual indices or from combinations of different indices. Using simulation alone, estimation of was made starting from the following performance indices for the various uses (residential, industrial and irrigation): 1. vulnerability, expressed as percent value of maximum annual deficit on the total value of annual demand; 2. time reliability, expressed as percent value of the months in which deficit is less than predefined thresholds (15% and 25%); 3. volumetric reliability, expressed as deficit rate on the demand value for the entire period of analysis. To simplify analysis, but also in agreement with hypotheses contained in (RAS, 2005), all residential demand was placed in the higher priority band; the second priority band grouped all industrial demand, while irrigation uses were placed in the third band. Results obtained with WARGI-SIM, using simulation alone, are summarised in Table II. Table II. Values of performance indices relative to simulation alone Max annual deficit (% Demand) Time reliability (% Months) Deficit ≤ 15% Time reliability (% Months) Deficit ≤ 25% Volumetric reliability (% Demand)
Residential 34.36
Industrial 40.69
Irrigation 70.94
94.50
94.65
93.40
94.65
94.65
93.40
96.12
94.82
91.85
As a consequence of breakdown into priority bands, most of the system’s resource deficit will concern irrigation use. Moreover, the prolonged periods of drought present in the hydrological series, associated with lack of adequate measures for protecting higher priority resources will engender intolerable stress conditions for residential uses (maximum annual deficit of 34.36% and 34 months in which mean monthly deficit exceeds the 25% threshold). In the mixed simulation-optimization technique, the optimization module is recalled by the simulation at yearly intervals (synchronization interval of one year) and with synchronization instant τ placed at the start of the irrigation period (1st of April). The optimization time interval ∂ is also established as one month. As shown in Table I, the optimization time horizon Δ has been varied from 1 to 3 years. Time
Mixed simulation-optimization technique for complex water resource system analysis under drought conditions
13
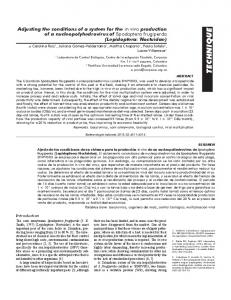
horizon and criticality of hydrological scenario are essential parameters for defining the type and degree of proactive measures for facing up to system failures. Indeed, by considering different optimization horizons and scenarios we can determine the effectiveness of mitigation measures during the drought period seen in the light of immediacy of intervention. System performances indexes were expanded also considering the reduced volumetric reliability, obtained as percent value of non-programmed deficit on demand reduced according to the consumption containment measures adopted under the proactive measures fixed by the optimization module. Tables III show performance index values generated by the mixed approach, when the simulation adopts demand reduction rules deriving from optimization associated with different hydrological scenarios. More critical scenarios establish greater supply reductions in the lower priority bands (essentially irrigation demand) as a proactive measure to lessen the vulnerability of residential uses to future drought periods. Any assumption of highly pessimistic scenarios engenders excessively drastic irrigation consumption containment actions, and conversely, over-optimistic scenarios provide no information useful for the adoption of prevention measures. Optimal combination of prevention measures cannot be based only on previous quantitative performance indices, but must also be supported by analysis of the economic impact of implementation of these actions on different demand categories. However, the consequences of failure to fulfil demand can prove difficult to measure in purely economic terms (e.g.: ecologic, environmental, social). In our application of WARGI to the Southern-Sardinia system, we carried out prior sensitivity analysis of overall system performance value associated with varying configurations of programmed and non-programmed unit deficit costs. A summary of the results obtained is contained in Figure 3 which shows the trend in the Objective Function (OF), with varying criticality of the optimization scenario and the ratio between programmed and non-programmed deficit costs. Based on results obtained with sensitivity analysis and available demand elasticity values, we then defined short and long-term demand curves for the various types of water uses. The system’s economic performance was evaluated including in the OF, besides deficit costs, management and operating costs linked to demand satisfaction of different water use types. As was to be expected, as the ratio between non-programmed and programmed deficit cost increases, the system's optimal configuration is obtained by means of a combination of proactive and reactive measures associated with hydrological scenarios of growing criticality. Moreover, an increase in deficit costs for residential water demand, if considering a fixed ratio between programmed and non-programmed costs, worsens the system’s economic performance level when lower criticality scenarios are adopted.
Giovanni M. Sechi & Andrea Sulis
14
Table III.a. Performance index values using hydrological scenarios with different criticality and annual optimization horizon 1st Critical case Res Ind Irr Max annual deficit (% Demand) Time reliability (% Months) Deficit ≤ 15% Time reliability (% Months) Deficit ≤ 25% Volumetric reliability (% Demand) Reduced Volumetric reliability (% Programmed demand)
1.91
55.78
90.81 6.94
5th Critical case Res Ind Irr
7th Critical case Res Ind Irr
22.82 77.41 15.94 23.59 68.66 15.99 23.61 69.92
99.84 96.23 66.04 99.37 95.75 67.92 98.74 98.74 71.38 98.74 98.43 71.38
100.0 96.23 66.04 99.37 99.37 71.54 98.74 98.90 73.11 98.74 98.58 73.11
99.96 98.45 80.84 99.58 98.97 83.21 98.78 97.97 85.04 98.58 97.73 85.29
99.96 100.0
100.0 99.63 99.43 99.72 98.78 98.90 99.78 99.13 98.66 99.06
9th Critical case Res Ind Irr Max annual deficit (% Demand) Time reliability (% Months) Deficit ≤ 15% Time reliability (% Months) Deficit ≤ 25% Volumetric reliability (% Demand) Reduced Volumetric reliability (% Programmed demand)
3rd Critical case Res Ind Irr
11th Critical case Res Ind Irr
13th Critical case Res Ind Irr
Average year Res Ind Irr
15.99 30.81 69.93 21.66 30.56 72.27 21.72 24.85 73.50 34.35 40.69 70.94 98.58 89.62 71.38 98.43 83.81 71.38 97.96 97.96 71.38 94.34 94.65 93.40
98.74 98.58 73.11 98.43 98.11 73.11 98.11 98.11 75.00 94.65 94.81 94.30
99.00 96.98 85.18 97.41 95.82 86.36 97.96 96.94 86.40 96.22 94.84 91.86
99.11 98.68 99.06 98.99 98.30 98.80 98.76 98.18 98.58 96.22 94.84 91.86
Mixed simulation-optimization technique for complex water resource system analysis under drought conditions
15
Table III.b. Performance index values using hydrological scenarios with different criticality and biennial optimization horizon
Max annual deficit (% Demand) Time reliability (% Months) Deficit ≤ 15% Time reliability (% Months) Deficit ≤ 25% Volumetric reliability (% Demand) Reduced Volumetric reliability (% Programmed demand)
1st Critical case Res Ind Irr
3rd Critical case Res Ind Irr
0.00
6.88
0.00
71.76
62.79 6.91
47.49
7th Critical case Res Ind Irr
60.16 15.71 18.13 62.78
100.0 100.0 52.83 99.69 99.69 60.38 99.69 97.96 62.26 99.21 99.21 66.04
100.0 100.0 58.49 99.69 99.69 66.04 99.69 97.96 66.04 99.21 99.21 71.70
100.0 100.0 77.83 99.74 99.61 82.63 99.78 98.72 82.79 99.45 98.90 84.65
100.0 100.0 100.0 99.79 99.69 99.78 99.79 99.75 99.72 99.48 99.22 99.46
9th Critical case Res Ind Irr Max annual deficit (% Demand) Time reliability (% Months) Deficit ≤ 15% Time reliability (% Months) Deficit ≤ 25% Volumetric reliability (% Demand) Reduced Volumetric reliability (% Programmed demand)
12.15
5th Critical case Res Ind Irr
11th Critical case Res Ind Irr
13th Critical case Res Ind Irr
Average year Res Ind Irr
17.82 27.67 67.53 19.00 29.83 68.31 26.22 28.13 71.77 34.36 40.22 70.95 98.74 98.43 66.04 98.58 98.43 66.04 97.64 97.64 69.65 94.50 94.65 93.40
98.90 98.43 73.58 98.90 98.43 73.58 97.80 97.64 75.16 94.65 94.65 93.40
98.94 98.15 85.66 98.98 97.87 85.81 98.23 97.17 87.65 96.24 94.85 91.86
99.23 98.64 99.07 99.13 98.55 98.99 98.36 97.71 97.71 94.24 94.85 91.86
Giovanni M. Sechi & Andrea Sulis
16
Table III.c. Performance index values using hydrological scenarios with different criticality and triennial optimization horizon 1st Critical case Res Ind Irr Max annual deficit (% Demand) Time reliability (% Months) Deficit ≤ 15% Time reliability (% Months) Deficit ≤ 25% Volumetric reliability (% Demand) Reduced Volumetric reliability (% Programmed demand)
0.00
0.00
60.06 3.89
34.44
5th Critical case Res Ind Irr
56.76 6.93
7th Critical case Res Ind Irr
10.88 51.91 7.06
15.21
53.09
100.0 100.0 35.85 99.84 98.11 49.06 99.69 99.53 54.72 99.53 99.37 56.60
100.0 100.0 58.49 99.84 98.11 64.15 99.69 99.53 66.04 99.53 99.37 66.04
100.0 100.0 75.75 99.93 99.35 79.76 99.72 99.44 82.16 99.64 99.30 82.75
100.0 100.0 100.0 99.93 99.89 99.92 99.78 99.54 99.63 99.67 99.40 99.57
9th Critical case Res Ind Irr Max annual deficit (% Demand) Time reliability (% Months) Deficit ≤ 15% Time reliability (% Months) Deficit ≤ 25% Volumetric reliability (% Demand) Reduced Volumetric reliability (% Programmed demand)
3rd Critical case Res Ind Irr
11th Critical case Res Ind Irr
13th Critical case Res Ind Irr
Average year Res Ind Irr
23.85 27.09 65.09 32.37 38.89 70.46 34.21 37.48 71.10 34.36 40.22 70.95 98.43 98.43 66.04 96.70 97.17 69.65 95.91 96.23 74.84 94.50 94.65 93.40
98.43 98.43 73.58 96.86 97.17 76.57 96.23 96.38 94.65 94.65 94.65 93.40
98.76 98.17 86.55 97.04 95.81 88.83 97.08 95.39 89.85 96.24 94.86 91.86
98.84 98.43 98.27 98.07 97.50 97.09 97.40 96.58 95.62 96.24 94.86 91.86
Mixed simulation-optimization technique for complex water resource system analysis under drought conditions
17
Fig. 3. Sensitivity analysis of the system’s economic performance with varying deficit costs
Giovanni M. Sechi & Andrea Sulis
18
Results illustrated in Figure 4 show the trend of economic performance, expressed as OF value, with varying criticality levels of the hydrological scenario used in the WARGI-OPT optimization model. In these analyses too, we based our calculations on a forecast horizon of one year, and expressed scenario criticality as the ratio between aggregated hydrological inflows in the scenario and mean inflow in the overall simulation horizon. In particular, in Figure 4 we can see how implementation of deficit prevention measures based on overly pessimistic hypotheses on future hydrology formulated in WARGI-OPT determines, in the simulation phase, the adoption of excessively cautious system management rules with respect to actual water availability in the system. On the other hand, excessively optimistic hydrological scenarios engendering insufficient long-term prevention measures and hence requiring implementation of short term measures, lead to significant penalisations and a consequent increase in OF values. The at times irregular trend in the OF (in particular when flows-ratio value is close to 0.5) indicates that, in a complex multi-use and multi-resource system, prevention measures should be better identified by using scenarios characterization that consider hydrological criticality not only in terms of mean annual value of total inflow in the system, but also as regards its space and time variability.
Fig. 4. Economic performance trend relative to varying criticality of annual forecasting in hydrological scenario in WARGI-OPT
Mixed simulation-optimization technique for complex water resource system analysis under drought conditions
19
The mixed technique applied to the water resource system of Southern Sardinia shows that the best combination of short and long-term drought mitigation measures can be obtained with reference to a hydrological forecasting scenario with annual inflow close to 40% of historical series mean annual inflow. There follows from the above discussion that another key parameter in simulation-optimization interaction is extension Δ of the forecasting time horizon adopted in the optimization module. Again for the Southern-Sardinia system, in Figures 5 and 6 we show economic performance trends when the optimization time horizon Δ is extended to cover two and three-year periods. Clearly, as the time horizon is extended, we can consider more optimistic hydrological scenario in order to define proactive measures. Optimal management in simulation is obtained by considering in the system a mean hydrologic inflow in the two-year and threeyear periods amounting to, respectively, 46% and 49% of mean annual value in the reference historical series. However, it should be noted that extension of the forecasting period also generates increased slope in the cost function when minimum value is exceeded. This factor should alert us to the need to avoid making excessively optimistic hydrologic scenario assumptions.
Fig. 5. System economic performance trends relative to varying criticality in the two-year forecasting scenario
Giovanni M. Sechi & Andrea Sulis
20
Figure 6. System economic performance trends relative to varying criticality in the three-year forecasting scenario.
CONCLUSIONS Results obtained indicate that the mixed simulation-optimization technique implemented in WARGI DSS provides effective support in the definition of optimal operating rules for the management of complex water resource systems. In particular, the mixed approach makes it easy to add to the model sets of proactive actions (programmed deficits) aimed at mitigating drought impact on higher priority demands. The technique developed in WARGI DSS requires the manager to define his preference criteria to resources and priority criteria to demands. Updating of the operating rules is carried out by the optimization module which makes forecasts on synthetic hydrologic inputs scenario sets. Effectiveness of drought mitigation actions is conditional on the criticality and extension of scenarios adopted in this phase. The report highlights the fact that application of this technique to real cases requires careful sensitivity analysis in assuming related values.
Mixed simulation-optimization technique for complex water resource system analysis under drought conditions
21
REFERENCES Ahmed, J.A., and Sarma, A.K. (2005) Genetic Algorithm for Optimal Operating Policy of a Multipurpose Reservoir. Water Resources Management 19(2): 145-161. Agthe, D.E. and Billings, R.B. (1980) Dynamic models of residential water demand. Water Resources Research 16(3): 476–480. Dijkstra, E. (1959) A note of two problem in connexion with graph. Numeriche Mathematik 1: 269– 271. Dorfman, R. (1965), Formal models in the design of water resource systems. Water Resources Research 1(3): 329-336. Hashimoto, T., Loucks, D.P. and Stedinger, J.R. (1981) Robustness of Water Resources Systems. Water Resources Research 18(1): 21–26. Hashimoto, T., Stedinger, J.R. and Loucks, D.P. (1981) Reliability, Resiliency, and Vulnerability Criteria for Water Resource System Performance Evaluation. Water Resources Research 18(1): 14–20. Hufschmidt, M.M. and Fiering, M.B. (1966) Simulation Techniques for the Design of Water Resource Systems, Harvard University Press, Cambridge, Mass.. Jacoby, H.D. and Loucks, D.P. (1972) Combined Use of Optimization and Simulation Models in River Basin Planning. Water Resources Research 8(6): 1401-1414. Karamouz, M. and Houck, M.H. (1982) Annual and Monthly Reservoir Operating Rules Generated by Deterministic Optimization. Water Resources Research 18(5): 1337-1344. Karamouz, M., Houck, M.H. and Delleur, J.W. (1992) Optimization and Simulation of Multiple Reservoir Systems. Journal of Water Resources Planning and Management 118(1): 71-81. Labadie, J.W. (2004) Optimal Operation of Multireservoir Systems: State-of-the-Art Review. Journal of Water Resources Planning and Management 130(2): 93-111. Loucks, D.P., Stedinger, J.R. and Haith, D.A. (1981) Water Resource Systems Planning and Analysis, Prentice-Hall, Englewood Cliffs, NJ. Loucks, D.P. and Van Beek, E. (2005) Water Resources systems Planning and Management: an Introduction to Methods, Models and Applications, UNESCO Press, Paris. Lund, J.R. and Ferreira, I. (1997) Operating Rule Optimization for Missouri River Reservoir System. Journal of Water Resources Planning and Management 122(4): 287-295. Manca, A., Sechi, G.M., Sulis, A. and Zuddas, P. (2004) Complex water resources system optimization tool aided by graphical interface. In: P. Liong and Babovic (eds), 6th International Conference of HydroInformatics, World Scientific Publishing Company. Moncur, J.E. (1987) Urban water pricing and drought management. Water Resources Research 23(3): 393–398. Nalbantis, I. and Koutsoyiannis, D. (1997) A parametric rule for planning and management of multiple-reservoir systems. Water Resources Research 33(9): 2165-2177. Neelakantan, T.R. and Pundarikanthan, N.V. (2000) Neural Network-Based Simulation-Optimization Model for Reservoir Operation. Journal of Water Resources Planning and Management 126(2): 57-64. Oliveira, R. and Loucks, D.P. (1997) Operating rules for multireservoir systems. Water Resources Research 33(4): 839-852. Pallottino, S., Sechi, G.M., and Zuddas, P. (2005) A DSS for Water Resources Management under Uncertainty by Scenario Analysis. Environmental Modelling&Software 20: 1031-1042. Randall, D., Cleland, L., Kuehne, C.S., Link, G.W. and Sheer, D.P. (1997) Water Supply Planning Simulation Model Using Mixed-Integer Linear Programming “Engine”. Journal of Water Resources Planning and Management 123(2), 116-124. RAS (2005) Piano Stralcio di Bacino della Regione Sardegna per l’Utilizzo delle Risorse Idriche. Autonomous Region of Sardinia, Convention RAS-UNICA-EAF.
Giovanni M. Sechi & Andrea Sulis
22
Rossi, G. (2000) Drought mitigation measures: a comprensive framework. In J. V. Vogt and F. Somma (eds) Drought and drought mitigation in Europe, Kluver, pp. 233–246. Salis, F., Sechi, G.M., Sulis, A. and Zuddas, P. (2005) Un modello di ottimizazione per la gestione di sistemi idrici complessi con l’uso di risorse convenzionali e marginali. L’Acqua 3: 33–52. Salis, F., Sechi G.M., and Zuddas, P., (2005) Optimization model for the conjunctive use of conventional and marginal waters, Drought Management and Planning for Water Resources, J. Andreu, G. Rossi, F. Vagliasindi and A. Vela eds., Taylor&Francis, 73-117. Sechi, G.M. and Sulis, A. (2005) A mixed optimization-simulation technique for complex water resource systems analysis. 8th International Conference on Computing and Control for the Water Industry, Exeter, UK. Sechi, G.M., Sulis, A. and Zuddas, P. (2004) Una tecnica mista di ottimizzazione-simulazione per l’analisi di sistemi idrici complessi. IXXX Convegno di Idraulica e Costruzioni Idrauliche, Trento, Italy. Sechi G.M. and Zuddas, P. (2000) WARGI: Water Resources System Optimization Aided by Graphical Interface. In: W.R. Blain and C.A. Brebbia (eds.) Hydraulic Engineering Software, WIT-PRESS, pp. 109-120. SEDEMED (2003) Drought and desertification in Mediterranean basins, INTERREG IIIB MEDOCC Asse 4 - Ref. 2003-03-4.4-I-010. Simonovic, S.P. (1992) Reservoir Systems Analysis: Closing Gap between Theory and Practice. Journal of Water Resources Planning and Management 118(3): 262-280. Sinha, A.K., Rao, B.V. and Lall, U. (1999) Yield Model for Screening Multipurpose Reservoir System. Journal of Water Resources Planning and Management 125(6): 325-332. Stedinger, J.R., Sule, B.F., and Pei, D. (1983) Multiple Reservoir System Screening Models. Water Resources Research 19(6): 1383-1393. Sulis, A. (2006) Un approccio combinato di ottimizzazione e simulazione per l’analisi di sistemi complessi di risorse idriche, PhD Thesis, University of Cagliari. WAMME (2003) Water Resources Management Under Drought Conditions, INCO-MED (DGXIII) Program, Contract N. ICA3-CT-1999-00014. Wurbs, R.A. (1993) Reservoir-System Simulation and Optimization Models. Journal of Water Resources Planning and Management 119(4): 455-472. Yeh, W.W.-G. (1985) Reservoir Management and Operation Models: A State-of-the-Art-Review. Water Resources Research 21(12): 1797-1818. Yevjevich, V., Hall, W. and Salas, J. (1983) Coping with Drought, Water Resources Publication, Littleton, Colorado.