MLS IMPULSE RESPONSE MEASUREMENTS FOR UNDERWATER BOTTOM PROFILING Angelo Farina Industrial Engineering Dept. - University of Parma - Via delle Scienze - 43100 PARMA – ITALY - E-MAIL
[email protected] This work describes the use of the MLS (Maximum Length Sequence) signal for the measurement of impulse responses, in alternative to the traditional techniques based on the use of impulsive sources. The mathematical theory for the generation of the MLS signal and for the deconvolution of the system’s impulse response are first described. Then a software implementation of the measurement method, based on the creation of plug-ins for a shareware waveform editor on a low cost PC is demonstrated. Some preliminary experiments conducted under controlled conditions show that the proposed technique produces images of the bottom profile with higher signal-to-noise ratio and better spatial resolution than those obtainable with the impulsive technique. Furthermore, the new technique seems superior also for some practical aspects connected with the very nature of the MLS signals, which makes it almost inaudible and makes the sound source barely localizable: this is very important for military applications. 1.
INTRODUCTION
Impulsive techniques are used from the beginning of the Underwater Acoustic science, to evaluate the distance of objects and to plot the profile of the sea bottom. Although the use of impulses has many advantages, it causes also some problems: to obtain high signal-to-noise ratios very large impulse amplitudes are needed. These can be generated efficiently only through resonating transducers, which have of course only limited bandwidth. When wide-band pulses are required, usually a high power sparker is employed. Anyway also this kind of source has some well known defects: it requires a large equipment, it is expensive, and the pulses produced are not very repeatable. In this work the use of an alternative approach is presented: a small wide-band piezoelectric transducer is used as an underwater loudspeaker, being fed with continuous MLS (maximum length sequence) pseudo random signal [1,2,3]. A second transducer (a wide band
hydrophone) is used as the receiving sensor, located near the sound source. The couple of source and receiver is moved on a straight line at constant depth, scanning the bottom profile. A personal computer samples the signal coming from the hydrophone, and through the well known Hadamard transform it deconvolves a series of impulse responses in real time. A standard visualization tool is then used to map the sequence of impulse responses (with logarithmic amplitude) in pseudo-color plots, which enables the direct visualization of the sea bottom profile. Through a proper synthetic aperture focalization algorithm, the transducer directivity can be greatly increased. Furthermore, the vertical resolution can be improved employing a modified version of the MLS signal, preconvoluted with the inverse impulse response of the transducers, in such a way that the emitted signal deconvolves to an almost perfect Dirac’s Delta function., as suggested by Mommertz [4]. The paper presents the theory behind the process stated above, and the first experimental results obtained in a real, highly reverberant environment. The comparison with experiments conducted employing the same experimental setup but with impulsive signals, shows that the novel technique greatly reduces the noise contamination of the signals, making it possible to work with lower power and without any averaging.
2. THEORY The MLS signal is well known since at least two decades [1,2,3]: it is a binary sequence, in which each value can be simply 0 or 1, obtained by a shift register as the one shown in fig. 1. The obtained signal is periodic, with period of length L given by: L = 2 N −1
(1)
in which N is the number of slots in the shift register, also called the order of the MLS sequence. Thus an order N=16 means a sequence with a period of 65535 samples. In this work, a software MLS generator is employed: it can produce sequences up to order 21, which correspond to 2,097,151 samples, or 47.55 s at a sampling rate of 44.1 kHz.
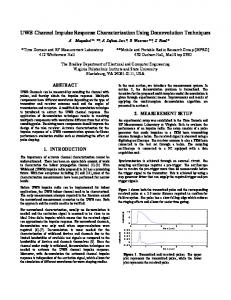
N stages
k stages XOR x’(n)
Fig. 1 – Shift register for the creation of the MLS signal Another very important point is the position of the tap inside the shift register: it is possible to generate MLS sequences also with multiple taps, and the position of the taps influences the behavior of the sequence, particularly when it is used for the excitation of system which are not perfectly linear. The work of Vanderkooy [5] suggests that some
sequences are better than others, reporting a list of known taps positions which works reliably for various orders of the MLS sequence. All these are included in the software module, and the user can choose between the various available sequences for any order. After having sampled the response of the system to the excitation signal, this response has to be processed, for extracting the system’s IR. Thanks to the favourable mathematical properties of the MLS excitation signal, the deconvolution of the IR can be made with the well known Fast Hadamard Transform (FHT), as originally suggested by Alrutz [1], and clearly explained by Ando [2] and Chu [3]. The Ando formulation was employed here. The process is very fast, because the transformation happens “in place”, and requires only addition and subtractions. The computations are done in floating point math. Here a brief description of the method is presented. When the periodic MLS signal m(j) [j=0..L-1] is applied at the input of a linear system, characterized by an impulse response h(i) [i=0..P], in which P