Science Series Data Report
Vol 4, No. 12;Dec 2012
Mobile Banking Utilizations, Satisfaction and Loyalty: A Case Study of Malaysian Consumers Mohamad Noorman Masrek (Corresponding Author) Accounting Research Institute/Faculty of Information Management, Universiti Teknologi MARA Puncak Perdana Campus, Section U10, 40150 Shah Alam Selangor Malaysia Tel: 603-79622134 E-mail:
[email protected] Normah Omar Accounting Research Institute, Universiti Teknologi MARA 40450 Shah Alam Selangor Malaysia Tel: 603 5544 4924 E-mail:
[email protected] Nora’ayu Ahmad Uzir Faculty of Information Management, Universiti Teknologi MARA Puncak Perdana Campus, Section U10, 40150 Shah Alam Selangor Malaysia Tel: 603-79622056 E-mail: nora’
[email protected] Irni Eliana Khairuddin Faculty of Information Management, Universiti Teknologi MARA Puncak Perdana Campus, Section U10, 40150 Shah Alam Selangor Malaysia Tel: 603-79622172 E-mail:
[email protected] The research is financed by Accounting Research Institute under Ministry of Higher Education Malaysia. Abstract The rapid proliferation of mobile phones and other electronic gadgets has created a new channel for banking known as mobile banking. The literature unveiled that very few have attempted to study the impact of mobile banking utilizations. Drawing on the research gap, this study proposes the following research questions: (i) Does mobile banking utilization predict user satisfaction? and (ii) Does satisfaction in mobile banking predicts loyalty? Adopting a survey research methodology involving 312 respondents, the findings of this study showed that that mobile banking utilization is positively related to satisfaction but not loyalty. Also it is found that satisfaction significantly predicts loyalty. Keywords: Mobile banking usage, Satisfaction, Loyalty, Malaysia 1. Introduction The rapid proliferation of mobile phones and other electronic gadgets has not only transformed the way people live, but also created a new channel for banking known as mobile banking. According to Ewe & Yap (2012), the mobile banking phenomenon, has significantly impacted the bank’s operational efficiency, value delivery and also customer services. While it has received a great deal of attention in developed nations, its adoption among developing nations including Malaysia is still very low. Recent report by the Central Bank of Malaysia unveiled that as of March 2012, mobile banking subscribers recorded at 1.73 million equivalents to only 4.7% of total mobile phone users in Malaysia (Bank Negara Malaysia, 2012). In
20
[email protected]
Science Series Data Report
Vol 4, No. 12;Dec 2012
comparison, developed country like America, 21% of mobile phone owners have used mobile banking in 2011 (Board of Governors of Federal Reserve Systems, 2012). These statistics simply suggest that there is a huge gap between developing countries and developed countries in terms of mobile banking adoptions or utilizations. Driven by this realization many researchers have attempted to investigate the reasons or factors that could influence users to utilize mobile banking (Goswami & Raghavendran, 2009; Gu et al., 2009; Daud et al., 2011; Cheah et al. 2011). However, mining the literature unveiled that very few have attempted to study the impact of mobile banking utilizations. Drawing on the research gap, this study proposes the following research questions: (i) Does mobile banking utilization predict user satisfaction? And (ii) Does satisfaction in mobile banking predicts loyalty? 2. Literature Review 2.1 Mobile Banking Utilization The Federal Reserve of US defines mobile banking as using a mobile phone to access bank account, credit card account, or other financial account (Board of Governors of Federal Reserve Systems, 2012). The mobile banking is similar to Internet banking in that it provides a fast and convenient way of performing common banking transactions (Bank Negara Malaysia, 2012). In order to enjoy the benefits of mobile banking, a user needs a mobile phone that is equipped with the features required by the bank that provides this service (Bank Negara Malaysia, 2012). Once a user obtained a registered account for mobile banking from the banking institution, he or she would be able to do banking transactions from anywhere. The mobile banking can be done either by accessing the bank’s web page through the web browser on the mobile phone, via text messaging, or by using an application downloaded to the mobile phone (Board of Governors of Federal Reserve Systems, 2012). Recent study released by The Federal Reserve of US unveiled that 11% of those not currently using mobile banking think that they will probably use it within the next 12 months and the most common use of mobile banking is to check account balances or recent transactions (90% of mobile banking users). In addition, the study also found that transferring money between accounts is the second most common use of mobile banking (42% of mobile banking users). 2.2 Mobile Banking Satisfaction The importance of customer satisfaction in financial services has been extensively discussed in the literature. Compiling from previous studies, Arbore & Busacca (2009) summarized that determinants of customer satisfaction in a banking services include (i) functional quality – reliability, speed, accuracy, functionality (ii) relational quality – responsiveness, assurance, friendliness, courtesy, commitment, communication (iii) convenience – opening hours, travel distance, queuing time, parking places, ATM availability (iv) economics – interest rates, price quality, ratio, price fairness (v) tangibles – physical layout and furniture, physical facilities, decoration of branch environment, atmosphere of branch environment, cleanliness, size and furnishing of customer space, dress of the personnel (vi) problem – handling and recovery. In the context of mobile banking, Saleem & Rashid (2011) found that antecedents of mobile banking satisfaction are organizational factors, technological factors, strategic factors and functional factors. According to Gaffar (2009), mobile banking may help increase customer satisfaction ratio by adopting the following means (i) innovative “anywhere, anytime” services customized for individual preferences and the current geographical location of the customer provide value-added to the customer, (ii) more attention and better consulting for individual customers due to automation of routine processes, and (iii) streamlining of business processes to increase efficiency. In a survey involving 500 respondents in Malaysia showed that 48% indicated that their confidence in the banking industry in Malaysia has increased in the last 12 months (Ernst & Young, 2012). However, the same study also concluded that 21% of customers want their bank to improve the online and mobile banking services. 2.3 Mobile Banking Loyalty Customer loyalty refers to a consumer's behavioural tendency or willingness to use the same product or service over and over again. Jones & Sasser (1995) defined customer loyalty as a feeling of attachment to or affection for a company’s products, services and people. A loyal customer is a customer who
21
[email protected]
Science Series Data Report
Vol 4, No. 12;Dec 2012
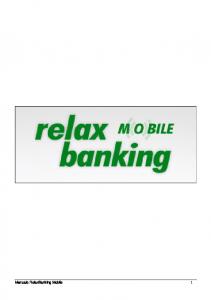
repurchases from the same service provider whenever possible, who continues to recommend and who maintains a positive attitude towards the service provider (Kandampully & Suhartanto 2000). Rowley (2005) categorized customer into four namely captive, convenience-seekers, contented and committed. The author further elaborated that captive and convenience-seeker are representatives of inertial consumer attitudes, whereas contented and committed are considered to be representatives of positive attitudes. It is argued that captive customers demonstrate loyalty by patronizing a specific brand, but they only make repeat purchases because they are limited in their choice. In the case of the convenience-seeker, their loyalty is determined by various factors such convenience of access, convenience of product and convenience of service. Contented customers continue as a customer, but do not extend their involvement with the brand by subscribing to additional services or expanding their expenditure on products or services linked with the brand. Committed consumers exhibit the maximum degree of customer loyalty, which means that they make repeat purchases in the long-term and are ready to give good product and service recommendations to their relatives and friends. According to Szuts & Toth (2006) over the last decades bankers have experimented with a multitude of programs and tactics to strengthen customers' bonds of loyalty to their institutions. In the process, these banks are confronted with the following problems (i) banks continue to struggle with loyalty programs: how to create them, how to measure loyalty, what rewards are appropriate, (ii) measuring customer loyalty means quantifying customer attitudes and behaviors accurately, which can be difficult (iii) retail banks rarely have the competency and capability to accurately measure the profitability of their customers and (iv) a sophisticated loyalty program should be based on the concept of a fair value exchange between or among partners and (iv) retail banks need to move away from product-centric loyalty programs toward those that reward an entire relationship. 2.4 Theoretical Framework and Hypotheses Figure 1 depicts the theoretical framework used in this study. The framework is conceptualized based on the Information Systems (IS) Success Model developed by Delone & Mclean (1992, 2003). The original IS success model consists of six constructs namely information quality; system quality; information systems usage; satisfaction; individual impact and organization impact. The revised version of the model comprises of information quality, system quality; service quality; information systems usage; satisfaction; net benefit. In this study only several constructs of the IS success model were adopted which are information system usage, satisfaction and the net benefit which is operationalized as loyalty. Based on the IS Success Model, utilization is hypothesized to have positive relationship with satisfaction and net benefit. Study by Asfar et al. (2010) and Hafeez & Muhammad (2012) in the context of retail banking found that satisfaction are strongly correlated with loyalty. To this effect, the following hypotheses are derived: H1: Mobile banking utilization is positively related to mobile banking satisfaction H2: Mobile banking satisfaction is positively related to mobile banking loyalty H3: Mobile banking utilization is positively related to mobile banking loyalty
Mobile Banking Utilizations Mobile Banking Loyalty Mobile Banking Satisfaction Figure 1. Theoretical Framework
22
[email protected]
Science Series Data Report
Vol 4, No. 12;Dec 2012
3.0 Research Method The study employed the survey research methodology. The population of the study was the mobile banking users living in the Klang valley area. Simple random sampling was used for selecting the sample of the study. According to Saunders et al. (2012), simple random sampling is a probability sampling procedure that ensures each case in the population has an equal chance of being included in the sample. A personally administered questionnaire was used to collect the data. Sekaran (2003) noted that the main advantage of using this method is that the researcher can collect all the completed responses within a short period of time. Prior to actual data collection, the questionnaire was pre-tested with a group of experts and also perspectives respondents so as to ensure that the questionnaires is well understood by the respondents and also fulfills the validity and reliability requirements. Several items were used to measure both satisfaction and loyalty variables and for each item, a corresponding Likert Scale with anchors ranging from 1 as “Strongly Disagree” and 5 as “Strongly Agree” was used. However, for the utilization variable, the anchors used are labeled as 1 for “Never Use” and 7 for “Extensively Use”. For each item listed, the respondents were required to mark any of the five options available. The collected data were analyzed using statistical computer programs known as IBM SPSS version 20 and Analysis of Moment Structures (AMOS) version 20. SPSS was used for descriptive analysis while AMOS was used for Structural Equation Modeling (SEM). SEM can be used to test causal relationship between construct employing multiple measurement items. According to Bowen & Guo (2012), SEM is highly recommended for social science researchers who use or develop multiple item measures. Hence, using SEM will improve the quality and credibility of results as well as strengthening the contribution of studies to the social work literature. It is because of these reasons, this study used SEM for the data analysis. Following the two step-approach suggested by Anderson & Gerbing (1988), the study first assessed the measurement model to test reliability and validity and followed by the structural model to test research hypotheses. 4.0 Findings 4.1 Demographic Profiles of Respondents A total of 312 respondents involved in this study and out of this number, 101 or 32.4% are males while the remaining are female. In terms of age group, the majority belong to age group between 21 and 25 (44.6%) while the minority (1.9%) reported to be aged between 6 and 20. With regard to their mobile banking experience, the majority indicated they have been using mobile banking for the about one year (31.4%). The rest have indicated to have been using the mobile banking services for about three years (19.3%) and less than one year (16.3%). 4.2 Reliability and Validity of Measurement Items Internal consistency reliability refers to consistency of agreement across a number of measures of the same construct, usually multiple items on a self-report item (Warner, 2012). The most widely adopted measure for internal consistency reliability measure is the Cronbach’s Alpha. As shown in Table 2, all scores of Cronbach’s Alpha surpass the recommended values of 0.7 as suggested by Hair et al. (1998). According to Warner (2012), construct validity is the degree to which a variable really measures the construct that is supposed to measure. Two most commonly used techniques for examining construct validity is using Exploratory Factor Analysis (EPA) and Confirmatory Factor Analysis (CFA). In this study, CFA was used to evaluate the construct validity which is further divided into two, namely, convergent validity and discriminant validity. Convergent validity is the degree to which a new measure correlates with an existing measure that is supposed to measure the same construct (Warner, 2012). Following Anderson & Gerbing (1988), this study used factor loadings, composite reliability (CR) and average variance extracted (AVE) to measure the convergent validity. Factor loading is a statistical estimate of the path coefficient depicting the effect of a factor on an item or manifest variable (Bowen & Guo, 2012). The literature suggests that the desirable factor loading should not below 0.5 and as depicted in Table 2, all the factor loadings fulfilled this requirement. In terms of composite reliability, all the scores also surpassed the cut off value of 0.7 as
23
[email protected]
Science Series Data Report
Vol 4, No. 12;Dec 2012
suggested by Hair et al. (2010). By definition, composite reliability (CR) is a measure of scale reliability that assesses the internal consistency of a latent variable (Fornell & Larcker, 1981). The average variance extracted (AVE) is a measure of the amount of variance captured by a construct from each scale. According to Fornell & Larcker (1981), AVE is a more conservative measure than composite reliability and suggested that the acceptable level should be more than 0.5. Table 1: Convergent Validity Construct
Items
Standardized Loadings
Mobile Banking Utilization
MBU1 MBU2 MBU3 MBS1 MBS2 MBS3 MBL1 MBL2 MBL3 MBL4
0.751 0.760 0.722 0.809 0.881 0.840 0.809 0.881 0.840 0.801
Mobile Banking Satisfaction Mobile Banking Loyalty
Composite Reliability (CR) 0.789
Average Variance Extracted (AVE) 0.554
Alpha Value
0.881
0.712
0.881
0.876
0.638
0.875
0.785
As noted previously, besides examining the convergent validity, the study also examined the discriminant validity. According to Sekaran (2003), discriminant validity is established when two variables are theorized to be uncorrelated and the scores obtained by measuring them are indeed empirically found to be so. Fornell & Larcker (1981) explained that AVE can also be used to measure discriminant validity. Hence, to examine the discriminant validity of the construct, the square root of AVE of the construct should be greater than the correlation between the constructs and all other constructs. As illustrated in Table 2, the AVE values are well above the correlation values, hence suggesting that the instrument used in the study meets the discriminant validity requirement. Table 2: Discriminant Validity Mean Mobile Banking Utilization (MBU) 3.53 Mobile Banking Satisfaction (MBS) 3.54 Mobile Banking Loyalty (MBL) 3.48 ** Correlation is significant at 0.01 level
Standard Dev. 0.75 0.66 0.66
MBU
MBS
MBL
0.744 0.570** 0.458**
0.843 0.678**
0.798
4.3 Assessment of Overall Model Fit According to Gowen & Guo (2012), the first thing many researchers look for upon obtaining the results of the SEM analysis is the output related to goodness-of-fit. Hair et al. (2010) noted that the goodness-of-fit of the SEM is indicated by how well it reproduces the observed covariance matrix among the indicator items. Hence, the goodness of fit can be divided into following four categories: (i) Chi-square measures including chi-square, degree of freedom (df) and probability, (ii) measures of absolute fit which include the Goodness-of-Fit Index (GFI), Root Mean Square Error of Approximation (RMSEA) and Root Mean Square Residual (RMR) (iii) incremental fit measures which include the Normed Fit Index (NFI) and the Comparative Fit Index (CFI) and (iv) parsimony fit measures which include the adjusted Goodness-of-Fit index (AGFI),and the Parsimony Normed Fit Index (PNFI). Gowen & Guo (2012) noted that Chi Square (χ2) is the most basic and common fit statistic used to evaluate SEM. As shown in Table 4, the χ² statistic suggests that the data do not fit the model well (χ² = 55.46, df = 33, p-value < 0.05). However, because χ² is easily affected by sample size, the χ² statistic is not always an
24
[email protected]
Science Series Data Report
Vol 4, No. 12;Dec 2012
appropriate measure of a model's goodness-of-fit. Therefore other fit indices as shown in Table 4 will be used to measure the model's goodness-of-fit. This normed chi-square test statistic ratio (χ2 /df), which appears as CMIN/DF in AMOS is a measure of absolute fit (Joreskog & Sorbom, 1986; Hayduk, 1987) and model parsimony complexity in SEM literature because as it is not sensitive to sample size (Byrne, 2001; Tabachnick & Fidell, 2001). The recorded value meets the benchmark value of less than three as suggested by Kline (1998). The goodness-of-fit test is a test performed to compare observed data with theoretically predicted distribution (Howell, 2004). A value greater than 0.9 or close to 1.0 reflects a good fit. In this study, the GFI value id 0.96. Root Mean Square Error of Approximation (RMSEA) is used to measure the descriptive fit of the model. The Root Mean Square Residual (RMR) is a measure of the average of the fitted residuals and can only be interpreted in relation to the sizes of the observed variances and covariances in the sample data (Joreskog & Sorbom, 1996). In a well fitting model the values of both RMSEA and RMR should be less than 0.05 and as shown in Table 3, these requirements are fulfilled. The Normed Fit Index (NFI) represents the incremental fit measure as recommended by Bentler & Bonnett (1980), which compares the proposed model to the null model. In other words, the NFI compares the fit of the null model to the fit of the theoretical model. Almost similar to NFI is the Comparative Fit Index (CFI) which compares the fit of a target model to the fit of an independent model. The benchmarks values for both NFI and CFI should be above 0.9 (Bentler, 1992; Gerbing & Anderson, 1992). The recorded values for of SEM model are well above the recommended value. In terms of parsimony fit measure, two indexes were evaluated, namely, the Adjusted Goodness of Fit Index (AGFI) and Parsimonious Normed Fit Index (PNFI). Adjusted GFI is an alternate GFI index in which the value of the index is adjusted for the number of parameters in the model. On the other hand, Parsimonious Normed Fit Index (PNFI) is an index that reflects both the fit and the parsimony of the model simultaneously (Hatcher, 1994). The value for the AGFI of the SEM model is well above the recommended value of 0.8. Likewise the value of PNFI also fulfils the recommended value of 0.5. Table 3: Fit Indices of Structural Model Fit Criteria Chi Square (χ2) Degrees of freedom P-value (probability) Absolute fit measures CMIN (χ2)/DF GFI (Goodness of Fit Index) RMSEA (Root Mean Square Error of Approximation) RMR (Root Mean Square Residual) Incremental fit measures NFI (Normed Fit Index) CFI (Comparative Fit Index) Parsimony Fit Measures AGFI (Adjusted Goodness of Fit Index) PNFI (Parsimonious Normed Fit Index)
≥ 0.5
SEM Value 55.46 33 0.008
3 ≥ 0.9 ≤ 0.05 ≤ 0.05
1.681 0.966 0.047 0.021
≥ 0.9 ≥ 0.9
0.969 0.987
≥ 0.8 ≥ 0.5
0.944 0.710
4.4 Testing The Hypothesized Structural Model As all the fit indices of the structural model meet the recommended criteria, the study proceeds by examining the path coefficients of the structural model which is shown in Table 4. As for H1, the hypothesis is supported, justified by the p-value which is less than 0.05. The R2 value is 0.682 which suggest that 68.2% variance in satisfaction is explained by utilization. With regard to H2, the hypothesis is also supported as the recorded p value is also less than 0.05. The recorded squared multiple correlation is 0.757 implying that 75.7% variance in loyalty is explained by satisfaction. The p-value for the path between utilization and loyalty is 0.67 suggesting that the relationship between both of these variables is not significant. Hence, this study failed to support this hypothesis
25
[email protected]
Science Series Data Report
Vol 4, No. 12;Dec 2012
Table 4: Results of Path Analysis Hypothesis
Path
Estimate
S.E.
C.R.
P value
H1
Satisfaction ⇠ Utilization Loyalty ⇠ Satisfaction Loyalty ⇠ Utilization
0.618
0.067
9.179
p < 0.05
Hypothesis Testing Supported
0.791 0.035
0.090 0.073
8.832 0.487
p < 0.05 P > 0.05
Supported Not Supported
H2 H3 5. Discussion
Various studies employing the IS success model have found strong support between utilization and satisfaction. For instance, Masrek, Jamaludin & Mukhtar (2010) found that satisfaction was found to be strongly correlated to individual impact in the context of library portal. In an earlier study, Masrek et al. (2008) also showed that utilization had significant relationship with task productivity and task innovation in the context of corporate portal. Just as the findings of previous studies, the finding of this study is also consistent, where utilization positively predicts satisfaction. In today’s working environment, where everyone in most of the time so occupied with their work task, it is very difficult to allocate time queuing in the banks for doing banking transactions. Due to this reason, mobile banking has become the preferred choice for doing banking transaction such as checking account balance or transferring of funds to another account. By adopting the mobile banking mode, users can save much of their time for doing banking transactions. Perhaps, due to this reason, the utilization as indicated by respondents in this study lead towards satisfaction. The revised edition of the IS Success Model combines the individual impact and organization impact constructs into one, which is the net benefit. As mentioned in previous section, this study operationalized net benefit as the loyalty of the mobile banking users. Numerous studies involving retail banking as well as other business setting have shown the positive effect of customer satisfaction on loyalty (e.g.; Chiou et al., 2002; Yang & Peterson, 2004; Ismail et al., 2006; Da Silva & Syed Alwi, 2006; Asfar et al., 2010; Hafeez & Muhammad, 2012). When consumers are satisfied with the mobile banking services, they are more likely to recommend the services to others. In addition, they would be less likely to switch to other alternative services, and in this case would be the traditional banking or the non-mobile internet banking. Considering that the available choices for banking are limited to three only, and comparing across the three available modes i.e. mobile banking, traditional banking and non-mobile internet banking, the mobile banking is apparently the best choice in terms of convenience and time-saving. Perhaps due to this reason, customers are more likely to be satisfied and loyal to the mobile banking services. Both the earlier and latest IS Success Model postulate that utilization of IS would have impact on the user and in this study the impact is assessed in terms of their loyalty. Contrary to the IS Success Model, this study did not find any support on the connection between utilization and loyalty. In other words, the users will not simply be loyal just by utilizing the mobile banking services. It is only when they are satisfied, then only they would be loyal to the mobile banking services. 6. Conclusion The conduct of this study has been to investigate the relationship between mobile banking utilization and satisfaction. In addition it also seeks to investigate the relationship between (i) mobile banking utilization and loyalty and (ii) mobile banking satisfaction and loyalty. The findings have shown that mobile banking utilizations are positively related to satisfaction but not loyalty. Also it is found that satisfaction significantly predicts loyalty. In essence this findings have further strengthen the IS Success Model which has already been empirically tested in diverse IS implementation setting. The findings of this study should be useful to both practitioners and researchers. As for the banking practitioners, the findings have empirically shown the importance of mobile banking services and its influence towards customer satisfaction. In the context of Malaysia, not all banks have implemented mobile banking. Hence this finding should alert banking practitioners that in line with the
26
[email protected]
Science Series Data Report
Vol 4, No. 12;Dec 2012
advancement of the ICT, they have no other choice but to embrace and implement mobile banking or otherwise they would risk of losing their customers. As for the researchers, besides replicating this study in countries that have implemented mobile banking, they can exploit the limitation of the study for future studies. One of the limitations is that the study has excluded the contributing factors towards mobile banking. Combining both the antecedents and impacts of mobile banking utilization in one study would definitely provide a better and clearer understanding of mobile banking phenomenon. Alternatively, future researchers should also consider employing a different research approach, such as qualitative approach so as to get richer and deeper on the situation of mobile banking utilization among users. The framework used in the study could be used as the conceptual framework guiding such researches. References Anderson, J. C. & Gerbing, D. W. (1988). Structural Equation Modeling in Practice: A Review and Recommended Two-Step Approach, Psychological Bulletin, 103 (3), 411-423. Arbore, A. & Busacca, B. (2009). Customer satisfaction and dissatisfaction in retail banking: Exploring the asymmetric impact of attribute performances. Journal of Retailing and Consumer Services, 16, 271–280. Bank Negara Malaysia (2012). Internet Banking and Mobile Banking Subscribers. [Online] Available: http://www.bnm.gov.my/payment/statistics/pdf/04_internet_banking.pdf (November 15. 2012) Bentler, P. M. (1992). On The Fit Of Models To Covariance And Methodology To The Bulletin. Psychological Bulletin, 112, 400-404. Bentler, P.M. & Bonett, D.G. (1980). Significance tests and goodness-of-fit in the analysis of covariance structures, Psychological Bulletin, 88(3), 588-606. Board of Governors of Federal Reserve Systems (2012). Consumer and Mobile Financial Services: March 2012. Washington, Board of Governors of Federal Reserve Systems. Bowen, N.K. & Guo, S. (2012). Structural Equation Modeling. New York, Oxford University Press. Byrne, B. M. (2001). Structural equation modeling with AMOS: Basic concept application and programming. London: Lawrence Erlbaum Associates. Cheah, C.M. et al. (2011). Factors Affecting Malaysian Mobile Banking Adoption: An Empirical Analysis, International Journal of Network and Mobile Technologies. 2(3). Chiou, J. S., Droge, C., & Hanvanich, S. (2002). Does customer knowledge affect how loyalty is formed? Journal of Service Research, 5(2), 113–124. Da Silva, R. V., & Syed Alwi, S. F. (2006). Cognitive, Affective and Cognitive Behavioral Responses In Retail Corporate Branding. Journal of Product and Brand Management, 15(5), 293–305. Daud, M.N., Kassim, N.E.M., Wan Mohd Said, W.S.R., & Noor, M.M.M. (2011). Determining Critical Success Factors of Mobile Banking Adoption in Malaysia, Australian Journal of Basic and Applied Sciences, 5(9): 252-265. Delone, W.H. & McLean, E.R. (2003). The DeLone and McLean Model of Information Systems Success: A Ten-Year Update, Journal of Management Information Systems, 19(4), 9-30. Delone, W.H., & Mclean, E.R. (1992). Information Systems Success: The Quest for the Dependent Variable," Information Systems Research 3(1), 60-95. Ecob, R. & Cuttance, P. (1987). An Overview of Structural Equation Modeling. In P. Cuttance & R. Ecobs (Eds), Structural Equation Modeling by Example: Application in Educational, Sociological and Behavioral Research. New York, Cambridge University Press. Ernst & Young (2012). The Customer Takes Control: Global Consumer Banking Survey 2012. Ewe, S.Y. & Yap. S.F. (2012). Exploring Motivations and Barriers for Mobile Banking Adoption: A Qualitative Approach. World Journal of Social Sciences, 2(4), 184 – 194
27
[email protected]
Science Series Data Report
Vol 4, No. 12;Dec 2012
Fornell, C. & Larcker, D.F. (1981). Evaluating Structural Equation Models with Unobservable Variables and Measurement Error, Journal of Marketing Research, 19, 39- 50. Gaffar, B. (2009). Prospects and Challenges of Mobile Banking In Ghana. Masters Theses. Institute Of Distance Learning, Kwame Nkrumah University of Science And Technology, Ghana. Gerbing, D.A. & Anderson, J.C. (1992). Monte Carlo Evaluations of Goodness of Fit Indices for Structural Equation Models, Sociological Methods and Research, 2(2) 132-160. Goswami, D. & Raghavendran, S. (2009). Mobile-banking: Can Elephants and Hippos Tango?, Journal of Business Strategy, 30(1), 14-20. Gu, J.C., Lee, S.C., & Suh, Y.H. (2009). Determinants of behavioral intention to mobile banking, Expert Systems with Applications, 36, 11605–11616. Hafeez, S. & Muhammad, B. (2012). The Impact of Service Quality, Customer Satisfaction and Loyalty Programs on Customer’s Loyalty: Evidence from Banking Sector of Pakistan. International Journal of Business and Social Science ,3 (16), 200-209. Hair, J. F., Black, B., Babin, B., Anderson, R. E. & Tatham, R. L. (2010). Multivariate Data Analysis: A Global Perspective. New Jersey, Pearson Education Inc.. Hatcher, L. (1994). A step-by-step Approach of Using SAS Systems for Factor Analysis and Structural Equation Modeling. Cary, NC, SAS Institute Inc. Hayduk, L.A. (1987). Structural equation modeling with LISREL: Essentials and advances, The John Hopkins University Press, Baltimore and London. Howell, D. C. (2004). Fundamental Statistics for the Behavioral Sciences (5th ed.). Belmont: Thomson Wadsworth. Ismail, I., Hasnah, H., Ibrahim, D. N., & Mohd Isa, S. (2006). Service Quality, Client Satisfaction, And Loyalty Towards Audit Firms. Perceptions Of Malaysian Public Listed Companies. Managerial Auditing Journal, 22(7), 738–756. Jones, T.O. & Sasser, E.W. (1995). Why satisfied customers defect. Harvard Business Review, 73 (6), 8899. Joreskog K, & Sorbom, D. (1986) LISREL 6: analysis of linear structural relationships by the method of maximum likelihood. Chicago: National Educational Resources. Kandampully, J, & Suhartanto, D. (2000). Customer loyalty in the hotel industry: the role of customer satisfaction and image. International Journal of Contemporary Hospitality Management 12 (6), 346-51. Kline, R.B. (1998). Principles and Practices of Structural Equation Modeling. New York, Guilford Press. Masrek, M.N., Jamaludin, A. & Mukhtar, S.A. (2010). Evaluating academic library portal effectiveness: a Malaysian case. Journal of Library Review, 59(3), 198-212. Masrek, M.N., Karim, N.S.A., & Hussein, R. (2008). The utilization and effectiveness of intranet: a case study at selected Malaysian organizations. Communications of the IBIMA, 4 (27), 200-206. Rowley, J. (2005). The four Cs of Customer Loyalty, Marketing Intelligence & Planning, 23(6), 574-581. Saleem, Z. & Rashid, K. (2011). Relationship between Customer Satisfaction and Mobile Banking Adoption in Pakistan, International Journal of Trade, Economics and Finance,2(6), 537-544. Saunders, M., Lewis, P., & Thornhill, A. (2012). Research Methods For Business Students, 6 th ed. Harlow, Pearson. Sekaran, U. (2003). Research Method For Business: A Skill Building Approach, 4 th ed. New York, Jon Wiley & Sons. Szűts, I. & Tóth, Z. (2006). Customer Loyalty Problems in Retail Banking. Proceeding of the MEB 2008 6th International Conference on Management Enterprise and Benchmarking. May 30-31, 2008, Budapest, Hungary, 355-361. Tabachnik, B.G. & Fidell, L.S. (2007). Using multivariate statistics (5th ed.). Boston: Pearson Education.
28
[email protected]
Science Series Data Report
Vol 4, No. 12;Dec 2012
Warner, R.M. (2012). Applied Statistics: From Bivariate Through Multivariate Techniques, 2 nd ed. London, Sage Publication. Yang, Z., & Peterson, R. (2004). Customer Perceived Value, Satisfaction, And Loyalty: The Role Of Switching Costs. Psychology and Marketing, 21(10), 799–822.
29
[email protected]