is the history of the fixed line telephone. The early phone, like the mobile, was designed for business and professional purposes. The major use of the landline ...
The Impact of the Mobile Phone on Work/Life Balance Phase 1 Final Report Preliminary draft v.6 – 11 March 2008
RESEARCH TEAM Professor Judy Wajcman, Australian National University Professor Michael Bittman, University of New England Dr Lynne Johnstone, Australian National University Jude Brown, University of New England Dr Paul Jones, University of New South Wales
Australian Research Council Linkage Project
- TABLE OF CONTENTS 1.
EXECUTIVE SUMMARY ....................................................................................................... 1
2.
RESEARCH AIMS AND BACKGROUND ............................................................................. 5
3.
RESEARCH METHODS .......................................................................................................... 7 3.1 Survey design and sample .................................................................................................. 7 3.2 Profile of the internet-connected households ...................................................................... 9 3.2.1 Representativeness of sample......................................................................................... 9 3.2.2 Number of workers and proportions by occupation ........................................................ 9 3.2.3 Technologies used ....................................................................................................... 10
4.
MOBILE PHONES, USE AND SERVICES .......................................................................... 12 4.1 4.2 4.3 4.4 4.5 4.5.1 4.5.2 4.6 4.6.1 4.6.2 4.7 4.8 4.9 4.10
5.
ACTUAL USE BASED ON MOBILE PHONE LOG DATA ................................................ 18 5.1 5.2 5.3 5.4
6.
Perceived reasons for mobile phone use ........................................................................... 23 Reasons for making calls and sending SMS messages on the mobile phone ...................... 23 Reasons for „turning off‟ your phone ................................................................................ 24 Current and expected access to internet services using the mobile phone .......................... 25 Internet services currently accessed by mobile phone .................................................. 25 Perceived future use of mobile phone to access internet services ................................. 25
MOBILE PHONE USE FOR WORK .................................................................................... 28 7.1 7.2 7.2.1 7.2.2 7.2.3 7.3 7.4 7.5
8.
Calls made - Who do they talk to? .................................................................................... 19 Text messages sent ........................................................................................................... 20 Frequency of calls ............................................................................................................ 21 Patterns in time of calls .................................................................................................... 22
REPORTED REASONS FOR MOBILE PHONE USE ........................................................ 23 6.1 6.2 6.3 6.4 6.4.1 6.4.2
7.
Individual mobile phone use within households................................................................ 12 Occupation and mobile phone use .................................................................................... 12 Personal income and mobile phone use ............................................................................ 13 Mobile phone use by age .................................................................................................. 14 Money matters ................................................................................................................. 14 Who pays? .................................................................................................................. 14 What does it cost?....................................................................................................... 14 Purchasing decisions ........................................................................................................ 15 Choice of mobile phone .............................................................................................. 15 Choice of network service provider .............................................................................. 16 Choice of communication technology............................................................................... 17 Awareness of mobile broadband ....................................................................................... 17 Separate mobile phones for home and work ..................................................................... 18 Time since adoption of mobile phone technology ............................................................. 18
Regularity of mobile phone use for job ............................................................................. 28 Perceived use of mobile phone on workdays and non-workdays ....................................... 30 On a typical workday during normal work hours ......................................................... 30 On a typical workday outside normal work hours ........................................................ 31 On a typical non-workday ............................................................................................ 33 Perceived difficulty in doing job without a mobile phone ................................................. 34 „May be contacted‟ during holiday ................................................................................... 35 Impact on workload and productivity ............................................................................... 36
WORK-FAMILY ISSUES AND THE MOBILE PHONE .................................................... 36 8.1 8.2 8.3 8.4
Maintaining contact with extended family ........................................................................ 36 Using the mobile phone to facilitate family/household coordination ................................. 37 Effect of mobile phone on work and home/family/personal life balance ........................... 37 Mobile phones, parents and the security of their children ................................................. 38
8.5
Importance of mobile phone in routinely separated couple relationships ........................... 38
9. PERCEIVED COSTS AND BENEFITS OF MOBILE PHONE OWNERSHIP ...................... 39 9.1 9.2 9.3 9.4 9.5 9.6 10.
Can I live without my mobile phone? ............................................................................... 39 Increased sense of personal security ................................................................................. 40 Effect on time pressure ..................................................................................................... 40 Effect on stress ................................................................................................................. 40 Effect on quality of leisure ............................................................................................... 40 The technology I could most live without – TV, internet or mobile phone ........................ 41 INTERNET, CONNECTEDNESS, USE AND SERVICES .............................................. 43
10.1 Individual‟s use of internet services accessed via a computer ........................................... 43 10.2 Time since adoption of internet technology ...................................................................... 46 10.3 Frequency of internet use ................................................................................................. 47 10.4 Amount of time spent using the internet for work or study ............................................... 48 10.4.1 Typical workday...................................................................................................... 48 10.4.2 Typical non-workday............................................................................................... 48 10.5 Amount of time spent using the internet for personal interests .......................................... 49 10.5.1 Typical workday...................................................................................................... 49 10.5.2 Typical non-workday............................................................................................... 51 10.6 Can I live without the internet? ......................................................................................... 52 11. 11.1 11.2 11.3 12.
WORK-FAMILY ISSUES AND THE INTERNET .......................................................... 54 Perceived effect of internet on work/life balance .............................................................. 54 Perceived effect of internet on time spent with family and friends .................................... 56 Perceived effect of internet on time spent on “other pastimes” .......................................... 57 QUALITY OF WORK LIFE ............................................................................................. 59
12.1 Preferred hours of work .................................................................................................... 59 12.2 Flexibility of work starting and finishing times................................................................. 60 12.3 Working “unsociable” hours............................................................................................. 60 12.4 Job security ...................................................................................................................... 61 12.5 Working quickly or to tight deadlines ............................................................................... 62 12.6 Never enough time? ......................................................................................................... 63 12.7 Change in the effort I put into my job compared to three years ago................................... 64 12.7.1 Overall.................................................................................................................... 65 12.7.2 How affected by mobile phone use .......................................................................... 65 12.7.3 How affected by e-mail............................................................................................ 66 12.7.4 How affected by all other internet use ..................................................................... 66 12.8 Work-related stress........................................................................................................... 67 12.8.1 Frequency of work-related stress ............................................................................ 67 12.8.2 Change in levels of work-related stress ................................................................... 67 13.
LIFE ISSUES IN HOUSEHOLDS - GENERAL............................................................... 67
13.1 Feeling rushed or pressed for time .................................................................................... 67 13.2 Family success at managing work and family responsibilities ........................................... 69 13.3 Perceived effects of having both work and home/family responsibilities........................... 69 13.3.1 “Makes me a more rounded person”....................................................................... 69 13.3.2 “Gives my life more variety” .................................................................................. 69 13.3.3 “Makes me feel competent” .................................................................................... 69 13.4 Family support ................................................................................................................. 70 13.5 Social support .................................................................................................................. 72 14. 14.1 14.2 14.3 14.4 14.5 14.6
WORK-TO-FAMILY SPILLOVER .................................................................................. 74 Effects of my job on home/family life .............................................................................. 74 Effects of my partner‟s job on home/family life ................................................................ 74 Effects of my parent‟s job on home/family life ................................................................. 75 Effects of the jobs of other adults in household on home/family life ................................. 75 Missing out on home/family activities because of work responsibilities ............................ 76 Perceived effect of work responsibilities on quality of home/family time ......................... 77
15. 15.1 15.2 15.3
FAMILY-TO-WORK SPILLOVER .................................................................................. 77 Interference of my family life with my job ....................................................................... 77 Perceived effect of home/family responsibilities on my work opportunities ...................... 77 Perceived effect of home/family responsibilities on quality of time spent working ........... 78
- LIST OF TABLES Table 1: Comparison of survey sample with ABS population benchmarks ............................................ 9 Table 2: Occupation and handset ownership ....................................................................................... 13 Table 3: Income and handset ownership .............................................................................................. 13 Table 4: Reasons for choosing a communication modality .................................................................. 17
- LIST OF FIGURES – Figure 1: Occupation by gender .......................................................................................................... 10 Figure 2: Technology use .................................................................................................................... 11 Figure 3: Mobile phone costs per month (by gender) .......................................................................... 15 Figure 4: Factors influencing choice of handset .................................................................................. 16 Figure 5: Factors influencing choice of network service provider ........................................................ 16 Figure 6: Calls made by recipient ........................................................................................................ 19 Figure 7: Moderate to high volume “texting” by occupation on work and non-work days ................... 21 Figure 8: Frequency of calls made ...................................................................................................... 21 Figure 9: Frequency of calls by time of day ........................................................................................ 22 Figure 10: Respondents‟ use of phone functionality ............................................................................ 23 Figure 11: Proportion of people turning off their mobiles in each situation ......................................... 24 Figure 12: Currently accessed internet services ................................................................................... 26 Figure 13: Perceived future use of mobile phone to access internet services ........................................ 27 Figure 14: Frequency of mobile use for job (by gender) ...................................................................... 28 Figure 15: Frequency of mobile use for job (by occupation) ............................................................... 29 Figure 16: Frequency of mobile use for job (by age in years) .............................................................. 29 Figure 17: Job-related mobile calls during normal work hours (by occupation) ................................... 30 Figure 18: Job-related mobile calls outside normal work hours (by gender) ........................................ 32 Figure 19: Non-job-related mobile calls outside work hours on workday (by gender) ......................... 32 Figure 20: Non-job-related mobile calls on non-workday (by gender) ................................................. 33 Figure 21: Comparing average daily job-related mobile call patterns (by gender)................................ 34 Figure 22: Difficulty of doing job without a mobile phone .................................................................. 35 Figure 23: Teenagers staying out late with mobile (by gender) ............................................................ 38 Figure 24: Technology most prepared to give up (by gender) .............................................................. 41 Figure 25: Most prepared to give up TV, Internet and Mobile Phone (by age) ..................................... 42 Figure 26: Technology most prepared to give up (by occupation) ....................................................... 43 Figure 27: Internet services accessed via computer ............................................................................. 44 Figure 28: Years since first internet use (by occupation) ..................................................................... 46 Figure 29: Frequency of internet use (by occupation) .......................................................................... 47
Figure 30: Frequency of internet use (by age) ..................................................................................... 48 Figure 31: Average non-workday internet use for work and/or study (by gender) ................................ 49 Figure 32: Average workday internet use for personal interests (by age) ............................................. 50 Figure 33: Average workday internet use for personal interests (by occupation) ................................. 50 Figure 34: Average non-workday internet use for personal interests (by age) ...................................... 51 Figure 35: Average non-workday internet use for personal interests (by occupation) .......................... 52 Figure 36: How much I‟d miss the internet (by occupation) ................................................................ 53 Figure 37: How much I‟d miss my mobile compared to the internet .................................................... 54 Figure 38: How much the internet has affected work/life balance........................................................ 55 Figure 39: Internet has increased or not changed work/life balance (by occupation) ............................ 55 Figure 40: How much the internet has affected time spent with family/friends (by age) ...................... 56 Figure 41: How much the internet has affected time spent in other pastimes (by gender) .................... 57 Figure 42: How much internet has affected time spent in other pastimes (by occupation) .................... 58 Figure 43: How much internet has affected time spent in other pastimes (by age) ............................... 58 Figure 44: Frequency of individuals working unsociable hours ........................................................... 61 Figure 45: Individual sense of job insecurity (by age) ......................................................................... 62 Figure 46: Frequency of working to tight deadlines ............................................................................ 62 Figure 47: Working 75% or more of the time to tight deadlines (by occupation) ................................. 63 Figure 48: Comparing frequency of working to tight deadlines with time to get job done.................... 64 Figure 49: Effort put into job compared to 3 years ago ........................................................................ 65 Figure 50: Perceived change in work effort resulting from mobile phone ............................................ 65 Figure 51: Comparing perceived changes in work effort compared to 3 years ago ............................... 66 Figure 52: Reasons for feeling always or often rushed or pressed for time (by gender) ........................ 68 Figure 53: Comparing perceived effects of having both work and family responsibilities .................... 70 Figure 54: Satisfaction with quality of family interactions (by factor) ................................................. 71 Figure 55: Family satisfaction based on perceived impact of mobile phone on ability to balance work and family life ................................................................................................................ 72 Figure 56: Missing out on home/family activities due to work responsibilities .................................... 76
1.
EXECUTIVE SUMMARY
Background The AMTA/ARC study is an exciting collaboration to provide an evidence-based understanding of the social impact of the mobile phone on work/life balance. It is the first study that is specifically designed to provide nationally representative data on how mobile phones have become integrated into the everyday lives of Australians. This innovative project employs a purpose-designed questionnaire, a phone log and a time-diary. Together, this unique combination produces direct information about how people use their mobiles to manage and coordinate their lives. This final report of Phase 1 of our research presents data collected March to September 2007 from our sample of 2185 individuals, comprising 1905 individuals from 1435 on-line households and 280 individuals in 280 off-line households. Key Findings
Mobile phone use varies with age but it is so universally diffused that use is unaffected by income levels and occupation. Only 12% of 14 to 17 year olds do not have a mobile. The lowest number of owners (74%) is found among those aged over 60 years.
The majority of users are subscribers and pre-paid use is concentrated among those under 25 years.
Convenience of the mobile phone is the reason most frequently given for choosing to talk on a mobile rather than a landline. Cost is a major reason for preferring to talk using a landline rather than a mobile.
There is a very high awareness of 3G (86% of males and 73% of females). However, 61% of respondents indicate that they do not access internet services via their mobile phone . The lag in take-up is a topic for further research.
Logs of actual calls made and SMS texts sent show that the predominant use of the mobile is for contacting family and friends, with work-related reasons far less important. Men make more calls for business purposes, while women use the mobile for social connectivity.
Typically people spend between $10 and $30 per month using their mobiles. Occupationally, managers, trades people and production workers have the highest mobile costs, while 25-29 year olds are the highest spending age group.
One out of every four workers does not use a mobile phone in the course of his/her work; 20% of workers do not use e-mail for their jobs, while 22% do not use the internet.
Male are almost twice as likely to use their mobiles during normal work hours for job-related calls than are females, differences that can be largely accounted
Phase 1 Final Report draft 11-Mar-08
-1-
for by the gender distributions of high mobile use occupational groups in our sample.
Males are more likely than not to have job-related mobile calls outside of normal work hours on workdays, while the reverse is true for females. However, the volume of calls is typically low, with less than 10% overall having four or more calls.
Males and females have similar patterns of mobile usage for calls for that maintain family and social connectivity, both during work hours and outside of work hours.
Calls cluster by time of day, according to purpose. Most work-related calls are made in standard working hours. The rate of calls to family and friends is higher than work-related calls during working hours and peaks at the end of school hours and in the evening.
Asynchronous communication practices, such as turning off your mobile to avoid being disturbed, are common techniques. Ninety per cent of the respondents „normally‟ switch off their phone in the cinema, two-thirds switch off their phone at work meetings, and half turn off their phones in restaurants. Women are more reluctant than men to take their mobile phone on holiday „to talk to work colleagues‟.
A third of workers say that it would be difficult to do their job properly without their mobile. This is particularly the case for men.
Four in ten employed respondents think that mobiles increase their workload, for 55% the effect is neutral, and a few (5%) think mobiles reduce their workload. This is offset by productivity gains.
Time pressure of work is „the norm‟, with 71% of workers working to tight deadlines at least half the time and almost half of these workers also reported that they never have enough time to get everything done in their job. Despite these work pressures the majority of workers feel that neither the mobile phone, the internet, nor e-mail has contributed much to changing the effort they put into their jobs. Among those who feel that these technologies have contributed to an increase in work effort, the internet and/or e-mail are more likely to be the source of that increase than the mobile phone.
Over two-thirds of the respondents report that the mobile phone is an important medium for maintaining kinship ties, especially for women. It is very well suited to maintaining intimate relationships at a geographical distance.
Conveying information about „timing of the arrival at home‟ and „arranging to meet with other family members‟ are the major uses of the mobile phone for micro-coordination.
Phase 1 Final Report draft 11-Mar-08
-2-
More than half of the employed respondents believe that the mobile helps their work-life balance. Very few report that the mobile phone has a negative impact on it. More than half of mobile-owning workers who have high levels of satisfaction with their family interactions regard the mobile as having increased their ability to find work/life balance.
The mobile phone is an indispensable part of the everyday life of Australians. About nine in ten people report that their lives could not „proceed as normal‟ if they were suddenly without their mobile phone.
Carrying a mobile phone makes most people (75%) feel more secure.
When asked about the impact of the mobile phone on their sense of time pressure, 34% report that the mobile reduces time pressure, while 25% reported that it didn‟t reduce their sense of time pressure.
Most people (61%) find that the mobile phone does not affect their level of stress. Of those who report that it has some impact, three out of four say that it reduces their stress level.
Contrary to fears about the intrusive character of the mobile phone on leisure, few respondents (5%) report that the mobile reduces the quality of their leisure time.
Telephones, both mobile (90%) and landline (87%) are owned by more people than any other information and communication technology.
People aged 60 years or more are most likely to have a landline phone at home (96%) and the least likely to have adopted wireless broadband (3%). The reverse is true for people less than 25 years who are least likely to use a landline phone at home (88%), and 25-29 year olds who have the highest adoption of wireless broadband (20%).
About 26% of people send four or more text messages on workdays, but it increases to 35% among females and 33% among males on non-work days. Young people aged 14-17 years are the highest volume “texters” with 39% sending more than 12 messages per non-workday. This drops sharply to 14% among 18-24 year olds, and declines progressively in older age groups.
Overall, both males and females say that they would be more willing to give up their mobile phone(s) than television or the internet. However, people aged under 30 years will give up TV before their mobiles.
E-mail is the most used non-work-related internet service accessed by computer.
Two-thirds of people in internet-connected households engage in internet banking, while around 50% access weather information, engage in shopping, organizing travel, and access location services using an internet-connected computer. Despite the accessibility of internet services from locations other than home, and via wireless mobile, the number of people, overall, who access these
Phase 1 Final Report draft 11-Mar-08
-3-
services is substantially lower than that of people in internet-connected households.
Among the 49% of workers who feel that the internet has changed their ability to balance their work and home lives, more than four out of five feel it has increased their ability to find work/life balance.
Two-thirds of individuals, females more than males, believe that the internet has not changed the amount of time they spend with family and friends.
Similar proportions (14%) of people feel that the internet has increased their time for both „other pastimes‟ and family and friends, but more feel that it has decreased their time spent in „other pastimes‟ (34%) than feel it had eroded time spent with family and friends (21%). This suggests that, in time-stretched lives in which using the internet has quickly become „the norm‟, more people are willing to forego other pastimes than time with family/friends.
Phase 1 Final Report draft 11-Mar-08
-4-
2.
RESEARCH AIMS AND BACKGROUND
No other device has been diffused as rapidly as the mobile phone, but its social impact is unknown. This project aims to provide a sound empirical research base for assessing the impact of the mobile phone on work/life balance. In particular, it examines the ways in which the mobile phone affords perpetual social contact. The project is based on collaboration between university-based researchers and the peak organization of mobile phone service providers, the Australian Mobile Telecommunication Association (AMTA), under the umbrella of the Australian Research Council Linkage grant scheme. AMTA‟s mission is „to promote an environmentally, socially and economically responsible and successful mobile telecommunications industry in Australia‟. The collaboration follows a workshop held in May 2004, jointly sponsored by AMTA and the Academy of the Social Sciences in Australia. The invention and diffusion of information and communication technologies are said to be revolutionising work and family life. Wireless mobile devices increase the scope for work and family flexibility by enabling the micro-coordination of time, tasks, and schedules. This is particularly significant as people are now working at times and places outside of the traditional workday and place. It is widely believed that technologies like the mobile phone and e-mail are blurring boundaries between personal life and the workplace. While for some commentators these developments represent a threat to the quality of modern life, for others they represent new opportunities for integrating the spheres of work and family. To date, social research on the mobile phone and other contemporary mobile communication technologies has been limited and has yet to be consolidated into a body of evidence about its social impact. Worldwide there are now over 1.7 billion mobile phones, even more than fixed line phones. The overseas research focus up to now, however, has largely been on the internet and little research of any kind into digital technologies has been done in Australia. This project will, for the first time in Australia, empirically examine the social impact of mobile technologies at work and at home. It will therefore fill a significant gap in the evidence base for the development of industry and social policy. A more informed understanding of the conditions that have been conducive to this highly successful industry depends upon Phase 1 Final Report draft 11-Mar-08
-5-
high quality research on how Australians benefit from owning mobile technologies. The research findings have the potential to influence the type and range of wireless services that will best serve Australians in the future. The effects of technological innovation are often less than straightforward. If there was ever a clear illustration of the inherent unpredictability of technological change, it is the history of the fixed line telephone. The early phone, like the mobile, was designed for business and professional purposes. The major use of the landline by women as a tool for maintaining social ties was unanticipated, as was the heavy use of mobiles by adolescents exchanging SMS text as well audio messages. In both cases, it was consumers rather than designers who discovered what was to become the typical pattern of use. Like other technologies, the mobile phone is flexible and contains contradictory possibilities. The future impact of the mobile phone on how Australians balance their work and home lives is thus unknown and ripe for empirical investigation. The team of researchers brought together for this project combine leading-edge expertise in the social aspects of information and communication technologies, the study of time-use, and communications policy. This report is based on data from our sample of 2185 individuals, made up of 1905 individuals from on-line households and 280 individuals from households that are not internet connected, who completed the Phase 1 survey comprising a questionnaire, a mobile phone log, and a „light time diary‟. Phase 2 of the study began in late 2007 and, as new data become available, there will be further communications of relevant findings. After explaining the methods used in the survey and assessing its representativeness, the report proceeds with a preliminary analysis of a number of relevant topics. We believe that our project will provide, for the first time, hard data on mobile phone use in the Australian context that will be of interest both to the industry and to those studying the social impact of technological innovation. It begins with an examination of the pattern of, and influences on ownership and service use, the choice of modality of communication, awareness of 3G capabilities, and take-up of 3G services. The report continues by presenting some preliminary analysis of the unique data on actual phone use, retrieved from respondents‟ own handsets. We then present an analysis of
Phase 1 Final Report draft 11-Mar-08
-6-
respondents‟ perceptions of their patterns of mobile phone use and preliminary data on the importance of mobile phones in the workplace and for managing their personal lives (including work/family balance). This is followed by our exploration of how respondents feel about the relative balance of the social costs and benefits of mobile phone technology. The report shifts focus to internet connectedness, internet services used, and time spent using the internet on workdays and non-workdays for work/study and other pastimes. In so doing we explore the social impact of the internet in the domains of work/life balance and time spent with family and friends and in other pastimes. The final four sections of the report present some background on the work and private life experiences of our respondents, the emphasis being on family and social support, work-to-family spillover, and home-to-work spillover. In so doing we explore their views about the impact of mobile phone, e-mail and the internet on various dimensions of their work and private lives.
3.
RESEARCH METHODS
The research project has two phases: Phase 1 – A sample survey of all Australian adults living in private dwellings. Phase 2 – A study of the use of mobiles in work settings. This report deals with the analysis of Phase 1 data. 3.1
Survey design and sample
Seventy-five per cent of the Phase 1 sample was recruited from the „Your Voice‟ online panel maintained by ACNielsen. This panel is recruited using off-line methods (gathering respondents from other face-to-face and telephone surveys conducted by the ACNielsen). The characteristics of the panel match those of the total Australian population which is on-line. At the time of determining our sample size the most upto-date ABS data indicated that in 2005-06, 60% of Australian households had home internet access. The advent of broadband was expected to increase the proportion of on-line households to closer to 75% but, after opting for a 75:25 on-line:off-line household sample, the release of the 2006 Australian census data revealed that only 63% of Australian dwellings have access to the internet. The on-line sample was collected from March to May 2007, and the off-line sample was collected during June to September 2007. Both samples comprise all available
Phase 1 Final Report draft 11-Mar-08
-7-
individuals in households aged 15 years and older. On-line panellists (and additional household members) were invited via email to complete the survey on-line, while offline panelists (and additional household members) were recruited using a telephone call to first establish that the panellist‟s household was not internet connected. Households were compensated for their time with financial incentives. Households completing the survey on-line were given a period of one week to complete the survey. It is difficult to calculate conventional response rates for internet surveys. Of the 3,469 households contacted by email, 19% of households started the survey but failed to complete it while 51% completed the survey. This gave a total sample of 1905 individuals from 1435 households. Households completing the survey off-line were mailed hardcopies of the survey in sufficient numbers for all available adults, and were asked to return the completed and return the survey to ACNielsen within 4 weeks. A total of 280 individuals from offline households participated constituted 13% of our sample. The survey consists of three components - a questionnaire, a phone log and a light time diary. The questionnaire asked respondents about the following areas: ownership and use of mobile phones; the perceived impact of mobile phone use on work and life balance (including measures of the quality of life); perceived effects on work and work/family spillover; effects on social support networks; and the phone‟s role in coordination and control. The mobile phone log asked respondents to give details about their ten most recent phone calls and text messages, both those that they made and those they received. Information was collected on whom the call/text message was to or from (for example, spouse, work colleague, service provider), the gender of the caller, and the date and time of the call. The third component of the survey was a 24 hour light time diary, consisting of a grid format with a list of 30 predetermined activities and a range of context indicators in the rows, and time, divided into 15 minute intervals, in the columns. Activities were grouped under the headings: personal care, eating, housework, work for paid job, education, voluntary work, care for others, leisure and travel. Context indicators were used to describe where the person was (home, main place of work, other indoors, outdoors), who they were with (alone, spouse, other adult, child) and whether they
Phase 1 Final Report draft 11-Mar-08
-8-
used a piece of technological equipment (landline, mobile phone, email, internet, Blackberry). For each 15 minute interval, respondents could choose up to three activities. The diary covered a 24 hour period beginning at 4am. Respondents chose the day that the diary was to be completed.
3.2
Profile of the internet-connected households
3.2.1 Representativeness of sample In this section the character of the sample is described and compared to the best available population benchmarks. Table 1 shows that the sample under-represents people aged 55 years or more and slightly over-represents people aged 35-54 years…[To be completed when ABS LFS data are updated] Table 1: Comparison of survey sample with ABS population benchmarks Sample (%)
Sample (weighted)%
Sex
ABS LFS April 2007 (%) [Jude to update]
Males
50.3
48.4
49.3
Females
49.7
51.6
50.7
14-34 years
37.5
33.7
34.2
35-54 years
36.7
37.0
35.2
55 or more years
25.8
29.3
30.5
63.6
61.1
62.0
4.2
4.3
2.9
32.2
34.7
35.1
Age
Employment status Employed Unemployed Not in the labour force
Since April is the month in the middle of the data collection period and census data is currently only available for 2001, the Australian Bureau of Statistics (ABS) Labour Force Survey (LFS) of April 2007 was chosen as the appropriate benchmark against which to judge the representativeness of the sample. The method of sampling reproduces the sex ratio of the Australian population in 2007 with a very slight bias (1%) towards female, as shown in Table 1. 3.2.2 Number of workers and proportions by occupation The occupational breakdown of employed respondents is as follows: Professionals (n=394); Clerical (n=361); Managers (n=280); Associate Professionals (n= 123); Phase 1 Final Report draft 11-Mar-08
-9-
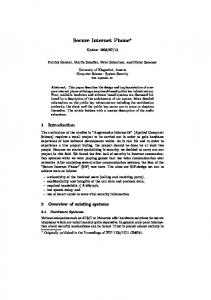
Trade (n=96); Labourers (n=86) and Production Workers (n=54). There are however, significant differences in occupation by gender. As shown Figure 1, the clerical occupations are heavily feminised, with more than twice as many women as men working in this category of employment. Men make-up the majority of the workers in trade and production occupations.
Figure 1: Occupation by gender
40 Males Females
Per cent
30
20
10
0 Clerical
Professional
Manager
Labourer
Associate Professional
Trade
Production
Occupation
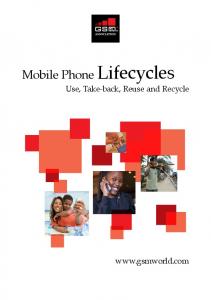
3.2.3 Technologies used All respondents were asked „Which of the following technologies do you personally use?‟ The list contained seventeen technologies, and Figure 2 portrays the relative market penetration of each in the sample of 2185 individuals. Telephones, both landline (90%) and mobile (87%) are owned by more people than any other technology. E-mail is used by 70% of people, while 67% of people own a desktop computer and 31% have a laptop. About 26% have Pay TV and 62% have a digital camera. We also found that two-thirds of individuals have free-to-air and/or pay TV, and a further 3% use only their computers to watch TV programs. People in non-internet connected households appear to be slower adopters of diverse technologies, from computers to digital cameras and MP3 players to pay TV.
Phase 1 Final Report draft 11-Mar-08
- 10 -
Figure 2: Technology use
100
Per cent
80 60 40 20 0 Landline
Email
Desktop PC
Broadband
Laptop
Technology
Phase 1 Final Report draft 11-Mar-08
- 11 -
VOIP
Dial up
PDA
Regarding communication and computer technologies, analysis by gender reveals that males appear to be earlier adopters than females of new technologies, evidenced by a 5% to 9% percent differential on VOIP, desktop, laptop, WebCam, MP3, PDA ownership. People aged 60 years or more are most likely to have a landline phone at home (96%) and the least likely to have a mobile phone (72%), pay TV (20%), computers (desktop 43%; laptop 10%), or broadband (31%) or wireless (3%) internet. On the other hand, people less than 25 years are less likely than most to use a landline phone at home (88%), while 25-29 year olds have the highest adoption of wireless broadband (20%). Moreover, the older the individual, the less likely he/she is to use e-mail, or have a Web Cam or MP3 player, and the more likely he/she is to use a landline phone. Analysis by households reveals that about 83% of internet-connected households have broadband.
4. 4.1
MOBILE PHONES, USE AND SERVICES Individual mobile phone use within households
More than 85% of individuals have at least one mobile phone in regular use, 16% have two phones, while few (1%) have more than two. two-thirds have used a mobile phone for more than 5 years. Nokia is the brand of choice for 30% of mobile phone users. Among the top five brands, substantially more females than females use Nokia, LG and Ericsson, while more males use Sony Ericsson, Motorola and „other brands‟. The dominant brand, Nokia, becomes more popular with each increasing age group (ranging from 41% among under 25s to 56% in people aged 55 years or more), while the trend is reverse for Motorola, Samsung and Sony Ericsson.
4.2
Occupation and mobile phone use
Mobile phones were initially marketed as business tools for managers whose time is very costly. When mobile phone use is analysed by occupation (see Table 2), the
Phase 1 Final Report draft 11-Mar-08
- 12 -
highest level is found not among managers but among professionals, of whom 92% have at least one mobile. Although more labourers and production workers than others do not have a mobile phone, mobile use is, nevertheless, widely diffused among all population groups, providing a first clue that the breathtaking diffusion of the mobile is not chiefly based on its business uses. Table 2: Occupation and handset use
None
One
Two
Three
Four +
Occupation
4.3
Manager
18.0
65.2
14.6
0.8
1.3
Professional Associate Professional
8.2
78.5
12.0
0.4
0.9
14.8
71.5
13.8
0.0
0.0
Trade
19.3
70.3
9.6
0.8
0.0
Clerical
12.3
74.8
12.0
0.5
0.4
Production
21.9
61.3
13.8
3.1
0.0
Labourer
25.3
59.1
15.7
0.0
0.0
Personal income and mobile phone use
Table 3 shows the association between income and numbers of handsets. Regardless of position in the income distribution, most Australians have at least one mobile phone in regular use. There are remarkable similarities across all incomes, the only exception being that people located in the second quintile are less likely than others to have only one mobile and more likely to have two. Table 3: Income and numbers of handsets None
One
Two
Three
Four +
Total
Income quintiles 1st
14.6
71.4
13.1
0.0
0.9
100
nd
15.9
59.0
24.2
0.4
0.5
100
3rd
16.3
73.4
9.5
0.5
0.3
100
4
th
15.0
70.8
12.8
0.7
0.7
100
5
th
12.7
71.1
14.5
0.8
1.0
100
2
Phase 1 Final Report draft 11-Mar-08
- 13 -
4.4
Mobile phone use by age
The lowest mobile phone use is found among those aged 60 years or more, followed by the youngest group in our sample (14-17 years), and then followed by middle-aged Australians (45-59 years). The highest levels of mobile phone use are found among those aged 18-39 years.
4.5
Money matters
4.5.1 Who pays? The majority of respondents under the age of 25 use „a pre-paid plan paid by me or my parents‟ while the majority between 26 and 60 years meet the cost of using their phone through „regular billing by my network paid by me or my parents‟. People 60 years and older are equally as likely to pay via a pre-paid plan or regular billing. Around a third of managers and a quarter of associate professionals claim „my employer pays my mobile phone bills‟, whereas for other occupations around 10% or less benefit from employer support. Females are more likely to use a pre-paid plan (45%) than males (36%), while males are four times more likely than females to have their employers pay for their mobiles usage. 4.5.2 What does it cost? Respondents were asked „How much does your mobile phone cost to use in an average month?‟. Response categories ranged from „under $10‟ to „over $100‟, with five categories in between. The eighth response option was „Don‟t know‟. We found that the median cost of using a mobile phone was in the range $20