sented to the contralateral eyecup using a Grass Instruments (Quincy,. MA) PS22D ..... (Ulinski PS, Jones EG, eds), pp 283â399. New York: Plenum. Wu J-Y ...
The Journal of Neuroscience, 1999, Vol. 19 RC3 1 of 7
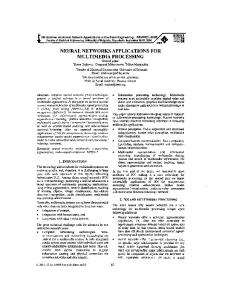
Modal Behavior of Cortical Neural Networks during Visual Processing David M. Senseman1 and Kay A. Robbins2 Cajal Neuroscience Research Center, Divisions of 1Life Sciences and 2Computer Science, The University of Texas at San Antonio, San Antonio, Texas 78249
The network behavior of cortical cells during the processing of a light flash was characterized in an isolated, but functionally intact, turtle visual system. Rapid changes in intracellular membrane potential were monitored optically using a voltagesensitive dye (VSD). Spatially coherent changes in membrane potential were determined by subjecting high-speed movies of the VSD signals to Karhunen–Loe´ve decomposition. In all experimental trials analyzed (n . 50), coherent activity was re-
stricted to a small number of similar spatial patterns or modes. At least four modes (M1,1, M1,2, M2,1, and M2,2) have an organizational structure similar to the normal modes of a vibrating membrane (drum). This empirical observation of modal activity provides a useful framework for analyzing the macroscopic behavior of cortical networks. Key words: cerebral cortex; visual cortex; pyramidal cell; neural network; voltage-sensitive dye; turtle
Relatively little is known about the basic principles governing the global behavior of cortical neural networks during the processing of sensory information. Much of our current insight has come from analyses of neurocomputational models (Suarez et al., 1995; Xing and Gerstein, 1996; Ulinski, 1998). This report describes the results of an empirical analysis of global activity evoked in the turtle cerebral cortex by brief light flashes. The turtle was selected for study because an usually complete and detailed record of global membrane potential changes can be obtained in this experimental preparation using high-speed optical imaging of voltage-sensitive dye (VSD) signals (Senseman, 1996, 1999; Prechtl et al., 1997). Senseman (1996) has also shown that the waveforms of cortical VSD signals correspond closely to the complex waveforms of compound postsynaptic potentials recorded currently in cortical pyramidal cells with conventional intracellular microelectrodes.
Animal C are and Use Committee and were performed within its established guidelines. V isual stimulation. Brief light flashes (;20 msec duration) were presented to the contralateral eyecup using a Grass Instruments (Quincy, M A) PS22D photostimulator coupled to a flexible light guide. For diff use illumination, the tip of a relatively large-caliber (2.5-mm-diameter) metal-clad light guide was positioned 1–2 cm from the eyecup to evenly illuminate the entire retinal surface. Spot illumination was achieved by bringing a smaller-bore (800-mm-diameter) metal clad fiber optic light guide to within 0.5–1 mm of the retinal surface. At this distance, the spot subtended ;15° of visual angle on the retinal surface, which is relatively small given an acceptance angle of 165–192° for the turtle eye (Northmore and Granda, 1991). Data anal ysis. For data analysis each detector in the 464-element photodiode array was treated as a pixel (picture element) in a 24 3 24 pixel video camera. An experimental trial thus consisted of a series of 24 3 24 pixel images (frames) forming a continuous movie. All movies were composed of 576 frames and were recorded at an effective frame rate of 353 frames per second. Individual movie frames were converted to vectors, and Karhunen –L oe´ve (K L) decomposition was performed on this collection of vectorized images to find a new coordinate basis using the eigenvectors of the autocorrelation matrix (Sirovich, 1987; Sirovich et al., 1996; Robbins, 1998). K L decomposition, principal component analysis, and singular value decomposition are related statistical procedures that have long been used for the analysis of signal waveforms of biological origin (Glaser and Ruchkin, 1976; Sirovich and Everson, 1992). Each eigenvector or mode is a 24 3 24 pixel image showing the locations of coherent changes in membrane potential within the cortical tissue. The relative importance of each of these spatial patterns to the overall cortical response is given by the corresponding eigenvalues of the autocorrelation matrix (Robbins and Senseman, 1998). K L decomposi-
MATERIALS AND METHODS E xperimental preparation and optical imag ing. E xperiments were performed on adult (shell length, 10 –21 cm) pond turtles (Pseudemys scripta elegans) obtained from a commercial supplier (William A. Lemberger, Oshkosh, W I). Surgical procedures used to isolate the eyes and brain from the cranium as well as the methods used to image the VSD signals with a 464-element silicon photodiode array have been described previously (Wu and Cohen, 1993; Senseman, 1996, 1999). The isolated visual system is intact in the sense that the normal afferent connections among the retina, lateral geniculate complex, and visual cortex are preserved (Kriegstein, 1987). Each of the 464 elements in the silicon photodiode array monitored a 150 3 150 3 700 mm volume of cortical tissue. All experimental protocols were approved by the university Institutional
Received Oct. 28, 1998; revised Feb. 11, 1999; accepted Feb 17, 1999. This work was supported by National Institutes of Health Grant G12 RR13646, National Science Foundation Grant ACI-9721348, Office of Naval Research Grant N00014-97-0029, and the University of Texas at San Antonio Office of the Provost. We thank L. Cohen for the generous donation of the data acquisition software and P. Ulinski for thoughtf ul criticism of an early version of this manuscript. Movies of the data and reconstructions can be found at http://vip.cs.utsa.edu/ cortex /JNS/index.html. Correspondence should be addressed to: David M. Senseman, Division of Life Sciences, The University of Texas at San Antonio, San Antonio, TX 78249. Copyright © 1999 Society for Neuroscience 0270-6474/99/190001-•$05.00/0
This article is published in The Journal of Neuroscience, Rapid Communications Section, which publishes brief, peerreviewed papers online, not in print. Rapid Communications are posted online approximately one month earlier than they would appear if printed. They are listed in the Table of Contents of the next open issue of JNeurosci. Cite this article as: JNeurosci, 1999, 19:RC3 (1–7). The publication date is the date of posting online at www.jneurosci.org. http://www.jneurosci.org/cgi/content/full/2981
2 J. Neurosci., 1999, Vol. 19
Senseman and Robbins • Modal Behavior of Cortical Networks
Figure 1. Intrinsic modes with the same structure are observed in different experimental preparations. Cortical response was evoked in both preparations by diffuse light flashes. A, The image at lef t shows a photograph of the experimental preparation in which the right cerebral cortex has been unfolded for optical recording. The image of mode M1,1 has been superimposed on the photograph to indicate the area imaged by the photodiode array. The dark circular object at the top lef t of the preparation is the attached eye. The anterior chamber has been removed to form an eyecup. The four photomicrographs at the top right show the locations of the most prominent cortical modes on the unfolded cortical sheet. For clarity the modes are also shown below each photomicrograph. B, Similar to A but showing the results obtained from the left cerebral cortex in a different experimental preparation. In both Figures 1 and 4, the modes are displayed as contour maps that were generated by Mathematica 3.0 (Wolfram Research Inc.) using standard bilinear interpolation. The meaning of the color bar is as follows. Cortical areas that were less than 6 10% of the maximum coherence were not colored and appear white or clear. Each color increment to the right of the central white box on the color scale indicates a 10% increase or decrease in the magnitude of coherent activity. tion is similar to Fourier analysis insofar as both procedures can be thought of as a rotation of a coordinate system. Although Fourier analysis rotates the coordinate system onto a predetermined basis consisting of sine and cosine f unctions, K L decomposition rotates the coordinate system onto a basis that minimizes the total mean square error.
RESULTS Modal character of coherent activity When cortical VSD signals were viewed as unprocessed movies, visually evoked responses usually appeared different in different experimental preparations. Even in the same preparation, cortical responses evoked by the same visual stimulus in sequential trials often exhibited differences in their spatiotemporal characteristics (Senseman, 1996, 1999). Despite this variability, K L decomposition revealed that the cortical responses could be decomposed into a small number (,10) of similar spatial patterns or modes. Figure 1 shows four spatial patterns (M1,1, M1,2, M2,1, and M2,2)
calculated from single trials in two different experimental preparations. We have adopted a naming convention for the modes based on their spatial organization. The first subscript indicates the number of maxima and minima that are aligned with the minor axis of the dominant mode. The second subscript indicates the number of maxima and minima that are aligned with the major axis of the dominant mode. The spatial pattern labeled M1,1 was always the most significant, capturing 70 –90% of the total response energy. M1,1 has an ovoid shape, with its major axis aligned tangentially at a 15–30° angle to the rostral 3 caudal axis. M1,1 is the only spatial pattern in which the coherent activity is unimodal, signifying that the changes in intracellular membrane potential captured by this mode always occur in the same direction irrespective of whether the network was depolarizing or repolarizing. Three additional patterns of spatially coherent activity (M1,2, M2,1, and M2,2) are also shown in Figure 1. Because these modes
Senseman and Robbins • Modal Behavior of Cortical Networks
collectively captured only 10 –25% of the response energy, their contributions were largely obscured by M1,1. M1,2 and M2,1 have antisymmetric bimodal distributions. The maximum and minimum of M1,2 are approximately circular, whereas the maximum and minimum of M2,1 are more elongated. The line separating the maximum and minimum of M2,1 is approximately parallel to the major axis of M1,1 and nearly perpendicular to the line separating the maximum and minimum of M1,2. The bimodal distributions of both M1,2 and M2,1 indicate that changes in cell membrane potential are inversely correlated across their respective axes. M2,2 is the most distinctive mode by virtue of its four-way antisymmetry having two maxima and two minima arranged opposite each other.
Relationship of the modes to the original data Figure 2 illustrates the relationship between the K L modes and the original data. The three largest modes (M1,1, M1,2, and M2,1) computed for a response evoked by a diff use light flash are shown in Figure 2 A, whereas the projections of the original data set onto these three modes are displayed as time series in Figure 2 B. We use the term “projection” to refer to a time series. The amplitude of each projection gives the relative contribution of the corresponding mode to the overall response at any given point in time. To illustrate the fidelity with which these three modes recreated the original response, selected frames from two movies are shown in Figure 2C. The images in the row labeled Orig were generated from the original VSD signals, whereas the images in the row labeled Eigen were reconstructed using only the three images in Figure 2 A and the three projections in Figure 2 B (Robbins and Senseman, 1998). Movies of the data and reconstructions can be found at http:// vip.cs.utsa.edu /cortex /JNS/index.html. As reported previously (Senseman, 1999), diff use retinal stimulation initially depolarizes cortical cells in the rostral pole of the visual cortex and then spreads into the caudal pole, giving the visual impression of a wave of excitation moving over the cortical surface. The spread of excitation is not captured by any single mode but, rather, is described by the temporal interactions between all three modes. The initial depolarization observed in the rostral pole at 181 msec after stimulation (Fig. 2 B, a) is largely attributable to contributions from M1,1 and M1,2 with relatively little contribution from M2,1. At 748 msec after stimulation (Fig. 2 B, d), M1,2 is almost solely responsible for the response, whereas the contributions from M1,1 and M2,1 are negligible. Between 181 msec (Fig. 2 B, a) and 343 msec after stimulation (Fig. 2 B, b), when the initial wave of depolarization is spreading caudally, all three modes make significant, time-varying contributions. It is important to remember that the modes represent patterns of correlated activity rather than membrane depolarization or hyperpolarization. Consequently, the projections presented in Figure 2 B should not be viewed as time records of membrane potential. Rather, each projection simply shows the time-varying weighting of its corresponding modal pattern in the overall response. For example, when the projection for bimodal mode, M1,2, changes from positive to negative, the red maximum in the top right corner goes from enhancing to suppressing the response, whereas the blue minimum in the bottom left corner goes from depressing the response to enhancing it. It should also be noted that each individual VSD signal reflects a local change in membrane potential involving a few hundred cortical cells. Each projection, on the other hand, reflects a global change in membrane potential taking place coherently in tens of thousands of cortical cells within the much larger cortical area encompassed by the mode.
J. Neurosci., 1999, Vol. 19 3
This ability of the KL modes and their projections to capture global relationships can be used to isolate and compare different aspects of an evoked cortical response. For example, in the response illustrated in Figure 2, several VSD signals exhibited oscillations (Fig. 3A). Visually evoked oscillatory activity has been observed in the cortices of both mammals (Singer and Gray, 1995; Castelo-Branco et al., 1998) and turtles (Prechtl et al., 1997). To analyze the complex patterns observed in response to looming stimuli, Prechtl et al. (1997) used taper filters to separate the response into frequency sub-bands. They then searched for spatial correlations within the different sub-bands. An alternative approach is to separate out the spatial correlations first and then perform a Fourier analysis on the resulting projections. Figure 3C shows the projection of mode M1,1 onto all 464 VSD signals recorded in this trial (including the eight signals shown in Fig. 3A). Fourier analysis performed on the portion of the projection between the dotted lines gave the spectrum shown in Figure 3D. The two sharp peaks indicate that mode M1,1 has two characteristic frequencies, 11 and 19 Hz. Prechtl et al. (1997) observed high-frequency activity with spectral peaks near 10 and 20 Hz in response to looming stimulus. However, the frequency distribution of the correlation they reported was obtained by computing correlations within frequency sub-bands and cannot be directly compared with Figure 3D.
Constancy of the spatial organization The spatial organization of modes was preserved when the parameters of the light flash were varied, as shown in Figure 4. Diffuse flashes of red and blue light evoked patterns of coherent activity similar to those evoked by white light (Fig. 4, top). Perhaps more surprisingly, the spatial organization of the modes is maintained when visual stimulation was switched from diffuse light flashes to small light spots projected onto different retinal locations (Fig. 4, middle). Although these changes in stimulus quality had little effect on the overall spatial organization of the cortical modes, we found that changing the stimulus parameters systematically altered the relative contributions of each of the modes made during the course of the response. These changes can be distinguished most easily by plotting the three projections against one another in a common coordinate system (basis), as shown in Figure 4, middle column, yellow curves. For this comparison, we used the modes generated by a diffuse white light flash as the common coordinate system, because this trial had VSD signals with the highest signalto-noise ratios. Each point on a curve represents the three values of the projections on M1,1, M1,2, and M2,1 for a particular frame. As a movie plays, the points corresponding to frame projections of the corresponding data set form a curve or response trajectory. By inspection, it can be seen that the projection curves have different shapes depending on the stimulus parameters. These shapes appear to be a stimulus signature and potentially provide a method of classification of responses. The response trajectories for diffuse light stimulation show an open loop shape independent of the spectral energy of the light flash. In contrast, the shapes of the trajectories for responses evoked by spot stimuli have a clearly different character that depends on the location of the retinal stimulation. The curves in Figure 4 were computed by projecting all of the trials onto the modes obtained from the diffuse white light flash trial. Projecting onto a common coordinate system is only meaningful if the common basis captures sufficient energy across all the data sets being compared. The stacked bar charts in Figure 4,
4 J. Neurosci., 1999, Vol. 19
Senseman and Robbins • Modal Behavior of Cortical Networks
Figure 2. Correspondence between the first three K L modes and the original data. A, Modes M1,1, M1,2, and M2,1 for a response evoked by a diffuse white light flash for trial 3404 as in Figure 1 B. B, Time series display of the projections of the original data set onto M1,1, M1,2, and M2,1. The time of stimulus onset is indicted by the small dot. C, Four frames from a movie generated directly from the VSD signals (Orig) compared with four images computed using only the first three modes (Eigen) in A and their projections shown in B at times 181 msec ( a), 343 msec ( b), 615 msec ( c), and 748 msec ( d) after stimulation.
Senseman and Robbins • Modal Behavior of Cortical Networks
J. Neurosci., 1999, Vol. 19 5
Figure 3. Power spectrum analysis of the projection of trial 3404 of Figure 2 onto mode M1,1 reveals characteristic frequencies at 11 and 19 Hz. A, VSD signals showing oscillatory changes in membrane potential in response to a diffuse white light flash. B, The recording locations of the photodiode array are shown superimposed on a photomicrograph of the preparation. The horizontal box indicates the recording locations of the VSD signal presented in A. C, Projection of the experimental trial onto mode M1,1. Vertical dotted lines show the time period used for the power spectrum analysis. D, The power spectrum of the waveform in C shows prominent peaks at 11 and 19 Hz. The asterisk indicates line noise contamination at 60 Hz. A 70 msec median filter was applied to the waveform in C before the power spectrum calculation. The small dots below the waveforms in A and C show the onset of the diff use light flash to the contralateral eyecup.
right, provide a quantitative assessment of the total response energy distribution. The orange column in each pair shows the fraction of energy captured by the three modes computed from each trial, whereas the green column in each pair shows the fraction of energy captured by the three modes computed from the diff use white light trial. In all experimental trials, M1,1, M1,2, and M2,1 captured at least 96% of the response energy when the trial was projected onto its own basis (Fig. 4, orange columns). As expected, less of the response was captured by projections onto the common basis (Fig. 4, green columns). However, in all cases the common basis still captured at least 90% of the total response energy (Fig. 4, dotted line).
DISCUSSION The main finding of this study is that neuronal networks in the turtle cerebral cortex behave in a modal manner during visual processing. We believe this is the first empirical evidence of modal behavior in a large-scale population of cortical cells. In our efforts to understand the f unctional significance of this modal behavior, we noticed an obvious resemblance in the spatial organization of our cortical modes with the normal modes of a vibrating membrane —the drum serving as the standard example in classical physics (Kac, 1966). Figure 4, bottom, compares M1,1, M1,2, M2,1, and M2,2 of the diff use white light trial with the
similarly named normal modes of a rectangular drum whose width (w) is 70% of its height (h). The drum modes are given by the equation Mm,n 5 sin(mpx/w) 3 sin(npy/h) for all positive integers m and n. Relating the global behavior of the cortical network to that of a drum was heuristically useful in analyzing and interpreting our experimental results. For example, the normal modes of a musical drum are intrinsic properties of the drum, being determined only by its physical characteristics (i.e., shape, tension, and material properties) and not by how the drum is struck (Kac, 1966). Musical drums produce different sounds when they are struck differently by changing the relative contribution each mode makes to overall response. This is precisely what we observed when we excited the cortex using different visual stimuli. That a basis computed from a single trial can capture .90% of the response energy for a series of responses evoked by a variety of visual stimuli suggests that M1,1, M1,2, and M2,1 are relatively stable, intrinsic properties of the global cortical circuitry in the turtle. It would not make sense to project the results obtained in one trial onto a basis computed from a different trial if the patterns of coherent activity (modes) changed significantly from one trial to the next. The ability to compare cortical responses evoked by a variety of stimuli by projecting them onto a common basis appears to be the most immediate benefit of this framework, because it provides 3
The green bar shows the trial’s projection onto the modes computed from the diff use white light flash. In each case the lightest section represents the energy captured by the projection on mode M1,1, the medium shade represents the energy captured by the projection on mode M1,2, and the darkest shade represents the energy captured by the projection on mode M2,1. The top section compares results for responses obtained with diff use light flashes composed of different spectral energies (colors). Each series of modes was calculated from a single experimental trial. The top row shows modes from trial 3404 as in the previous figures. The unfiltered output of a xenon lamp is labeled W hite. Red and Blue illumination were produced by passing the output of the xenon strobe through a bandpass interference filter (625 nm f ull width at half-maximum) centered at 650 or 400 nm, respectively. The middle section compares responses obtained with spot illumination at three retinal locations. To compensate for the lower signal-to-noise ratios of the VSD signals evoked by spot illumination, the modes were computed from two experimental trials combined into a single data set. However, the time course of the projections shown in the signature curves and the energy distribution of the projections shown by the bar charts are presented for the individual trials that were used to analyze the spot illumination. The bottom section compares the spatial organization of M1,1, M1,2, M2,1, and M2,2 for trial 3404 with the normal modes of a rectangular membrane (Drum).
6 J. Neurosci., 1999, Vol. 19
Senseman and Robbins • Modal Behavior of Cortical Networks
Figure 4. Comparison of modal organization across trials. All of the modes presented in this figure were obtained in the experimental preparation shown in Figure 1 B. Each row shows the modes calculated from a data set corresponding to a different stimulus condition. The curves in the middle column represent the projections of the corresponding data sets onto the coordinate system formed by the modes from the diffuse white light trial shown in the top row. Plotted in this way, each cortical movie appears as a curve in three-dimensional space. For one trial, the start ( S), finish ( F), and direction of travel (arrow) of the response trajectory have been indicated. The bar charts in the right column represent the fraction of energy captured by projecting a single experimental trial onto modes M1,1, M1,2, and M2,1. The orange bar shows the projections on the KL modes computed from the trial’s own data. (Figure legend continues)
Senseman and Robbins • Modal Behavior of Cortical Networks
guidance in how to conduct comparisons across experimental preparations. Because the shape and physical characteristics of the drum determine its modal morphologies, the normal modes of approximately similar drums will have approximately similar shapes. However, some variation in modal structure would be expected from drum to drum because of differences in construction and materials. Consequently, it seems more reasonable to compare a collection of drums not on the basis of their modal structure but, rather, on the basis of their sounds, i.e., their response signatures. It follows then that if the goal is to understand how a certain population of cortical neurons responds differentially to different stimuli, we should expect the intrinsic cortical modes to exhibit some degree of variability in their spatial organization from preparation to preparation because of genetic, developmental, and environmental differences. However, the qualitative shapes of the projection trajectories might be sufficiently similar that it will be possible to identif y species-specific response signatures for different sensory stimuli. In summary, cortical responses in the turtle, evoked by brief light flashes, exhibit a spatial organization of coherent activity that superficially resembles the normal modes of a drum. Because the modes calculated from one trial in a preparation appear to capture a significant portion of the energy of other trials, data sets from the same preparation can be projected onto a common coordinate system for comparison. The observation of modal behavior and the drum heuristic provide a usef ul framework in which to plan, organize, and interpret neurophysiological experiments designed to characterize the behavior of large-scale cortical networks during the processing of sensory information.
REFERENCES Castelo-Branco M, Neuenschwander S, Singer W (1998) Synchronization of visual responses between the cortex, lateral geniculate nucleus, and retina in the anesthetized cat. J Neurosci 8:6395– 6410. Glaser EM, Ruchkin DS (1976) Evoked potentials: principal components and varimax analysis. In: Principles of neurobiological signal
J. Neurosci., 1999, Vol. 19 7
analysis (Glaser EM, Ruchkin DS, eds), pp 233–290. New York: Academic. Kac M (1966) C an one hear the shape of a drum? Am Math Monthly 73:1–23. Kriegstein AR (1987) Synaptic responses of cortical pyramidal neurons to light stimulation in the isolated turtle visual system. J Neurosci 7:2488 –2492. Northmore DPM, Granda AM (1991) Ocular dimensions and schematic eyes of freshwater and sea turtles. Vis Neurosci 7:627– 635. Prechtl JC, Cohen L B, Pesaran B, Mitra PP, K leinfeld D (1997) Visual stimuli induce waves of electrical activity in turtle cortex. Proc Natl Acad Sci USA 94:7621–7626. Robbins K A (1998) Visualization of scientific video data using KL decomposition. I EEE Trans Visualization Comput Graphics 4:330 –343. Robbins K A, Senseman DM (1998) Visualizing differences in movies of cortical activity. I EEE Visualization ’98, pp 217–224. Senseman DM (1996) Correspondence between visually evoked voltagesensitive dye signals and synaptic activity recorded in cortical pyramidal cells with intracellular microelectrodes. Vis Neurosci 13:963–977. Senseman DM (1999) Spatiotemporal structure of depolarization spread in cortical pyramidal cell populations evoked by diff use retinal light flashes. Vis Neurosci 16:65–79. Singer W, Gray C M (1995) Visual feature integration and the temporal correlation hypothesis. Annu Rev Neurosci 18:555–586. Sirovich L (1987) T urbulence and the dynamics of coherent structures, Part I. Coherent structures, Part II. Symmetries and transformations, Part III. Dynamics and scaling. Q Appl Math 45:561–590. Sirovich L, Everson R (1992) Management and analysis of large scientific data sets. Intl J Supercomput Applications 6:50 – 68. Sirovich L, Everson R, Kaplan E, Knight BW, O’Brien E, Orbach D (1996) Modeling the f unctional organization of the visual cortex. Physica D 96:355–366. Suarez H, Koch C, Douglas R (1995) Modeling direction selectivity of simple cells in striate visual cortex within the framework of the canonical microcircuit. J Neurosci 15:6700 – 6719. Ulinski PS (1998) Neural mechanism underlying the analysis of moving visual stimuli. In: C erebral cortex: models of cortical circuitry, Vol 14 (Ulinski PS, Jones EG, eds), pp 283–399. New York: Plenum. Wu J-Y, Cohen L B (1993) Fast multisite optical measurement of membrane potential. In: Fluorescent and luminescent probes for biological activity (Mason W T, ed), pp 389 – 404. New York: Academic. X ing J, Gerstein GL (1996) Networks with lateral connectivity. I. Dynamic properties mediated by the balance of intrinsic excitation and inhibition. J Neurophysiol 75:184 –199.