Model-Based Clustering Toolbox for MATLAB Angel R. Martinez Naval Surface Warfare Center, Dahlgren Division Wendy L. Martinez1 Office of Naval Research
January 2003
Abstract: This documentation describes various functions for performing model-based clustering and associated tasks. These are written in MATLAB, version 6.5, but users should be able to run these in older versions of MATLAB. The MATLAB Statistics Toolbox is not required, except for displaying the dendrogram. This documentation includes a description of the model-based clustering methodology and detailed step-by-step instructions for using the MATLAB Model-Based Clustering Toolbox. We assume that the user has a basic understanding of how to use MATLAB. Disclaimer: This software and documentation are distributed in the hope that they will be useful, but they are distributed without any warranty and without even the implied warranty of correctness or fitness for a particular purpose. The federal government, in particular the Department of the Navy and the Office of Naval Research, disclaims all responsibility for this software and any outcome from its use. In addition, this software and documentation does not reflect the views of and is not endorsed by the federal government nor the Department of the Navy. The code has been tested with care, but is not guaranteed to be free of defects and is not guaranteed for any particular purpose. Bug reports and suggestions for improvements are always welcome at the address given below. Acknowledgements: We would like to acknowledge the following people for their assistance in this effort: Chris Fraley and Adrian Raftery (University of Washington), and Jeffrey L. Solka (Naval Surface Warfare Center, Dahlgren, VA). Wendy Martinez is also grateful for the support of the ONR ROPO program.
1. 800 North Quincy Street, BCT1, Code 311, Arlington, VA 22217-5660,
[email protected]
Documentation
January 2003
Table of Contents 1. Background Information on Model-Based Clustering ...................................................3 1.1 Model-Based Clustering in Detail ..................................................................3 1.2. The EM Algorithm ..........................................................................................5 1.3. Model-Based Clustering - Continued .............................................................6 2. Generating Data From a Finite Mixture ........................................................................9 3. Agglomerative Model-Based Clustering .....................................................................13 4. Model-Based Clustering ..............................................................................................16 4.1 The EM for Finite Mixtures ...........................................................................16 4.2 Model-Based Clustering Process ...................................................................17 5. Visualizing the Results ................................................................................................18 5.1. Plotting the BICs ...........................................................................................18 5.2. Rectangle Plots .............................................................................................18 5.3. ReClus Plots ..................................................................................................22 6. Future Improvements ...................................................................................................25 7. Installation Instructions ................................................................................................25 8. Function Reference ......................................................................................................27 agmbclust .....................................................................................................................27 genmix ............................................................................................................................27 mbcfinmix .....................................................................................................................27 mbclust ..........................................................................................................................28 mixclass .......................................................................................................................29 plotbic ..........................................................................................................................29 reclus ............................................................................................................................29 rectplot .......................................................................................................................30
References .........................................................................................................................31
2
Documentation
January 2003
1. Background Information on Model-Based Clustering For information on model-based clustering, see the following references: Jeffrey D. Banfield and Adrian E. Raftery (1993).” Model-based Gaussian and nonGaussian clustering.” Biometrics 49:803-821. Chris Fraley and Adrian E. Raftery, (1998). “How many clusters? Which clustering method? Answers via model-based cluster analysis,” Computer Journal 41:578-588. The model-based clustering method is based on finite mixtures, where the output model is a weighted sum of c multivariate normals: c
f(x) =
∑ pk φ ( x ; µk, Σk ) .
(1)
k=1
We describe model-based clustering in more detail later, but the general idea is to generate estimates based on Equation 1, where constraints are imposed on the covariance matrices. The best estimate and model (i.e., number of components, parameter estimates, and form of the covariance matrices) is chosen based on the model that yields the highest value of the Bayesian Information Criterion (BIC).
1.1 Model-Based Clustering in Detail A foundational assumption of model-based clustering is that the data are generated by a mixture of probability distributions in which each component represents a different group or cluster. That is, in the general case, given d-dimensional observations x 1, …, x n , let f ( x i θ k ) be the density of an observation x i from the k-th component, where θ k is a vector containing the parameters for the component. One way to model the composite of the clusters is via the mixture likelihood given by n
L ( θ 1, …, θ G ; τ 1, …, τ G x ) =
c
∏ ∑ τk fk ( xi θk ) ,
(2)
i = 1k = 1
where c is the number of components in the mixture, and τ k is the probability that an observation belongs to the k-th component.
3
Documentation
January 2003
In model-based clustering, the multivariate normal is used as the density for f k ( x i θ k ) , with θ k consisting of a vector of means µ k and a covariance matrix Σ k . Thus, the density has the form
1 T exp – --- ( x i – µ k ) Σ k ( x i – µ k ) 2 -. f k ( x i µ k, Σ k ) = ------------------------------------------------------------------------1⁄2 d⁄2 ( 2π ) Σk
(3)
Key to this method is the fact that the covariance matrix Σ k determines important geometric characteristics of the clusters. Banfield and Raftery [1993] developed a model-based clustering framework by parameterizing the covariance matrix in terms of eigenvalue decomposition, as follows T
Σk = λk Dk Ak Dk ,
(4)
where D k is the orthogonal matrix of eigenvectors, A k is a diagonal matrix whose elements are proportional to the eigenvalues of Σ k , and λ k is a scalar. By means of this decomposition of the covariance matrix Σ k , geometric characteristics of the distributions can be imposed and a suitable model can be generated. Orientation, volume and shape can be specified by using the models given in Table 1. The determination of the component parameters for each of the models is done via the ExpectationMaximization algorithm (EM), which is described in the following section [Dempster, Laird, and Rubin, 1977].
4
Documentation
January 2003
Table 1 Parameterizations for Model-Based Clustering Σk
Distribution
Volume
Shape
Orientation
λI
Spherical
Equal
Equal
NA
λk I
Spherical
Variable
Equal
NA
Ellipsoidal
Equal
Equal
Equal
Ellipsoidal
Variable
Variable
Variable
T
Ellipsoidal
Equal
Equal
Variable
T
Ellipsoidal
Variable
Equal
Variable
λDAD
T
T
λk Dk Ak Dk λD k AD k
λ k D k AD k
1.2. The EM Algorithm The EM algorithm is an iterative procedure that is started with an estimate of the number of components and an initial guess of the component parameters. In general, the following are the steps of the procedure. [Note that the update equation for the covariance matrices (Equation 9) will change in the model-based clustering case, depending on the constraints imposed on the components.] Step 1: This is the E step, where we determine the posterior probability for each component:
ˆ pˆ k φ ( x j ; ˆµ k, Σ k ) ˆτ = -----------------------------------; kj ˆf ( x ) j
k = 1, …, c ; j = 1, …, n ,
(5)
where c is the number of components (or clusters), n is the number of observations, τˆ kj is the
ˆ
ˆ
estimated posterior probability that the j-th point belongs to the k-th component, φ ( x j ; µ k, Σ k ) is the multivariate normal density for the k-th component evaluated at the j-th point, and c
ˆf ( x ) = j
ˆ
ˆ
∑ pˆ k φ ( xj ; µk, Σk ) k=1
5
(6)
Documentation
January 2003
is the finite mixture estimate at point x j . The mixing coefficient or weight is given by pˆ k .The estimate of the posterior probability is used in the following step to compute estimates of the parameters for each component and the mixing coefficients. Step 2: This is the maximization or M step. The following equations update the component mixing coefficients, the means and the covariances in each iteration. The mixing coefficient is updated using n
1 pˆ k = --- ∑ τˆ kj . n
(7)
j=1
The component means are updated next as follows: n
1 µˆ k = --- ∑ n j=1
τˆ kj -----. pˆ
(8)
k
Finally, the update for the covariance matrix (in the general, unconstrained case) is given by n T ˆ τˆ kj ( x j – µˆ k ) ( x j – µˆ k ) 1 Σ k = --- ∑ --------------------------------------------------- . n pˆ k
(9)
j=1
The next iteration begins with an updating of the estimate of the posterior probability for each datum and component using Equation 5, followed by updates using Equations 7 to 9. Iterations stop when a predefined tolerance is met, i.e., until the estimates for the parameters stop changing within the tolerance specified.
1.3. Model-Based Clustering - Continued Before we outline the steps of model-based clustering, we return to the issue of the constraints imposed on the covariance matrices that give rise to the various models (see Table 1). Our implementation of Banfield and Raftery’s method uses four of the possible models. These are outlined and described in Table 2. The update equations for these models can be found in Celeux and Govaert [1995]. Recall that the EM algorithm requires an initial guess at the component parameters, the mixing coefficients and knowledge of the number of components in the mixture. The same
6
Documentation
January 2003
information is needed for model-based clustering. In this method, we get an initialization of the EM algorithm by partitioning the data based on agglomerative clustering. In the typical application of agglomerative clustering [Everitt, 1993], each data point starts out in its own cluster. At each step of the algorithm, the two closest (in terms of some distance) clusters are merged. The definition of how clusters are determined to be close gives rise to the various flavors of agglomerative clustering (e.g., single linkage, complete linkage, etc.).
Table 2 Description of the Four Models Used in This Toolbox Model Number (M)
Covariance
Model
1
Spherical and equal
ˆ 2 Σk = σ I
• • •
Diagonal covariance matrices Same value in diagonal elements Covariance matrices are equal
2
Spherical and unequal
ˆ 2 Σk = σk I
• •
Diagonal covariance matrices Covariances are allowed to vary between components Same value in each diagonal element of individual covariance matrix
Description
• 3
Ellipsoidal and equal
ˆ Σk = Σ
• •
4
Ellipsoidal and unequal
ˆ Σk = Σk
• • •
Covariance matrices can have nonzero off-diagonal elements Covariance matrices are equal Unconstrained model described in Equation 9. Covariance matrices can have nonzero off-diagonal elements Covariance matrices can vary among components
In model-based clustering, we use a similar paradigm, where in this case the clusters are merged such that the likelihood is maximized, rather than the usual distance metric. Fraley [1998] describes the agglomerative model-based clustering algorithms for the four models described in Table 2. In our implementation, we use the unconstrained model of agglomerative model-based clustering to initialize all models. Fraley and Raftery [1998] show that this seems to be adequate as an initialization procedure for all models. The last piece that we need is a way to determine which estimate (number of components and covariance model) fits the data the best. As previously mentioned, the choice of the best model is made via the BIC, given by
BIC ≡ 2L M ( x, θˆ ) – m M log ( n ) ,
7
(10)
Documentation
January 2003
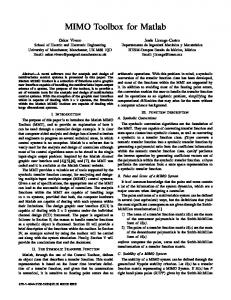
where m M is the number of parameters in model M and L M is the log likelihood. The final model and estimate deemed the best will be the one that corresponds to the highest value of the BIC. We now pull all of this together and list the steps of model-based clustering used in this program. 1. Apply the unconstrained agglomerative model-based clustering procedure to the data. This provides a partition of the data given a desired number of clusters. 2. Choose a model: M = 1, 2, 3, and 4 (see Table 2). 3. Choose a number of clusters or component densities, c. 4. Find the partition given by the agglomerative model-based clustering (step 1) for the given value of c. 5. Using this partition, find the mixing coefficients, means and covariances (based on the model from step 2) for each cluster. 6. Using the chosen c (step 3) and the initial values (step 5), apply the EM algorithm to obtain the final estimates. 7. Calculate the value of the BIC for this value of c and M. 8. Go to step 3 to choose another value of c. 9. Go to step 2 to choose another model M. These steps are shown in Figure 1.
Chosen Model
Agglomerative Model-Based Clustering
dendrogram
Initialization for EM: 1. Initial number of components 2. Initial values for parameters
Data
EM Algorithm BIC
Final Result – Estimated Model: 1. Number of components, c 2. Best model: M1 – M4 3. Parameter estimates
Highest BIC
Figure 1. This flowchart illustrates the MBC procedure.
8
Documentation
January 2003
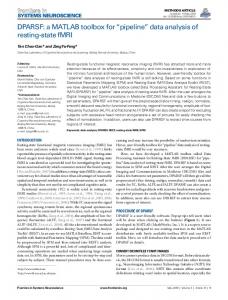
2. Generating Data From a Finite Mixture A useful tool to have is one that generates data from a given finite mixture, and one is provided with the Model-Based Clustering Toolbox. Because the input arguments for this function (weights, means and covariances) can be tedious to create on a command line interface, we provide this tool in a GUI format. The GUI is invoked by typing genmix at the command line and is shown in Figure 2.
Figure 2. This shows the GUI that is invoked with genmix. The various steps that must be taken are shown on the left side of the window.
The steps for entering the required information are listed on the left-side of the GUI window. We outline them below, and briefly describe how they work: Step 1:
Choose the number of dimensions.
9
Documentation
January 2003
This is a pop-up menu. Simply select the number of dimensions for the data. Step 2: Enter the number of observations. Type the number of points in the data set, i.e., the sample size n. Step 3: Choose the number of components. This is the number of terms or component densities in the mixture. Using the notation in Equation 1, this is the value for c. Step 4: Choose the model. Select the model for generating the data. The model numbers correspond to those described in Table 2. Step 5: Enter the component weights, separated by commas or blanks. Enter the corresponding weights for each term. These are the pk in Equation 1. These must be separated by commas or spaces and sum to 1. Step 6: Enter the means for each component - push button. Click on the button Enter means... to bring up a window for entering means, as shown below in Figure 3. There will be a different number of text boxes, depending on the number of components selected in Step 3. Note that you must have the right number of values in each text box; i.e., if you have dimensionality d = 3 (Step 1), then each mean needs 3 values.
Figure 3. This shows the pop-up window that is activated when the Enter means button is clicked on. There will be a text box for each of the component densities.
If you need to check the means that were used, then you can click on the View Current Means button. The means will be reflected in the MATLAB command window as shown here. HIT ANY KEY TO CONTINUE... The mean for component 1 is: 1 1
10
Documentation
January 2003
HIT ANY KEY TO CONTINUE... The mean for component 2 is: 2 2 Step 7. Enter the covariance matrices for each component - push button. Click on the button Enter covariance matrices... to activate a pop-up window. You will get a different window, depending on the model that was chosen in Step 4. Model 1: If you choose Model 1, then you only have to enter one variance as shown in Figure 4.
Figure 4. This is the pop-up window for Model 1. Since the component densities have equal variances, you only have to enter one value.
Model 2: For Model 2, you must enter a variance for each component. The window for this one is shown in Figure 5.
Figure 5. This is the pop-up window for Model 2. The component densities have unequal variances, so you have to enter a variance for each component.
Model 3: The component densities have equal covariances, where the covariances can have nonzero off-diagonal elements. If this option is selected in Step 4, the full covariance must be entered in the pop-up window. Enter the row of the covariance matrix in the corresponding text box in the window. An example of this window is shown in Figure 6.
11
Documentation
January 2003
Figure 6. The user must enter each row of the covariance matrix in the corresponding text box. Note that each row must have the d elements.
Model 4: In this case the covariance matrices are allowed to vary across component densities, and the off-diagonal elements can be non-zero. The same type of pop-up window as seen for Model 3 will be provided for each component (see Figure 7). So, if there are 4 components or terms in the mixture model, then 4 separate windows will be shown for the user to enter each covariance matrix. Similar to before, the user can push the View Current Covariances button to view the covariance matrices in the MATLAB command window.
Figure 7. Here are the windows to enter the covariance matrices for a 2-component mixture, with d = 2.
12
Documentation
January 2003
Step 8. Push the button to generate random variables. After all of the values have been entered, push the button labeled Generate RVs... to generate the data set. Once the variables have been generated, the user has several options. They can be saved to the workspace using the button Save to Workspace. When this is activated, the window shown in Figure 8 appears. The data are now saved in the workspace using that variable name. The data can also be saved to a text file by clicking on the button Save to File. This brings up the usual window for saving files.
Figure 8. When the Save to Workspace button is pushed, this box appears. Enter the desired variable name in the text box.
The user can also view the data in a scatterplot matrix by pushing the button Plot Data. For the data generated using the default values, we have the picture shown in Figure 9.
3. Agglomerative Model-Based Clustering As we stated in Section 2, agglomerative model-based clustering is used to initialize the EM algorithm. This is a variant of agglomerative clustering where the clusters are merged such that they maximize the likelihood function, given the chosen model (see Table 2) rather than merging clusters that are close together in terms of a distance. See Everitt [1993] for a discussion on agglomerative clustering methods. The Model-Based Clustering Toolbox includes a stand-alone function for doing agglomerative model-based clustering. It is not necessary to use this function separately as part of the model-based clustering procedure (i.e., this step is done automatically when the model-based clustering function is used). This function is called agmbclust. It can be invoked from the command line as follows: >> Z = agmbclust(data);
13
Documentation
January 2003
Figure 9. If we generate random variables according to the default values, we get a scatterplot matrix similar to this one.
The input variable data is an n × d matrix, where each row corresponds to a ddimensional observation. The output variable Z is a matrix containing the cluster information that can be used in MATLAB’s dendrogram function (available in the Statistics Toolbox) or the rectplot function (available in this toolbox, see Section 5.2). To illustrate these ideas, we generate some data for a finite mixture. The parameters of the mixture are: Weights: p k = 0.2, 0.2, 0.1, 0.5 Dimensionality:
4
n = 50 Means:
[2, 2, 2, 2], [-2, -2, -2, -2], [-2, 2, -2, 2], [2, -2, 2, -2]
Covariances: 1.5I, I, .75I, I
14
Documentation
January 2003
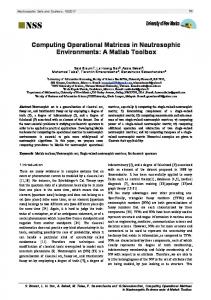
This data set is included with the Model-Based Clustering Toolbox and is called data.mat. It can be loaded with the command: >> load data We first perform the agglomerative model-based clustering and then produce the dendrogram as follows >> Z = agmbclust(data); >> dendrogram(Z); The resulting dendrogram is given in Figure 10.
Figure 10. This is the dendrogram showing the results of the agglomerative model-based clustering. The vertical axis represents the value of the objective function at each link. Note that some of the numbers on the leaf nodes do not correspond to the observation number; they might include several of the observations.
The output matrix Z can also be used in the MATLAB function called cluster. This is available in the Statistics Toolbox, and it returns a vector T of n indices indicating cluster membership for each observation. This function contains several input options:
15
Documentation
January 2003
T = cluster(Z,'cutoff',c)
c is a threshold for cutting Z into clusters, where clusters are formed when inconsistent values are less than c.
T = cluster(Z,'maxclust',n)
Returns n clusters.
T = cluster(...,'criterion','crit')
Uses the specified criterion for forming clusters. The argument crit is either 'inconsistent' or 'distance'.
T = cluster(...,'depth',d)
Evaluates inconsistent values to a depth of d in the tree.
While we have not thoroughly tested the results of the agglomerative model-based clustering with these options, they should work with the output Z, especially the second one. The reader should consult the MATLAB documentation for information on inconsistent values. It is not clear whether inconsistent makes sense when used with agglomerative model-based clustering. One thing to note regarding the dendrogram function is that it displays the top 30 nodes as the default. Thus, the leaf nodes that are displayed might correspond to multiple observations. For example in Figure 10, we have 50 observations, but only 30 nodes showing in the dendrogram. To find out which observations are contained in a leaf node k, use the following syntax >> find(T == k);
4. Model-Based Clustering In this section, we describe various functions for running the EM algorithm based on the four basic models (Section 4.1), as well as a general model-based clustering function that implements the entire process (Section 4.2).
4.1 The EM for Finite Mixtures Recall from Section 1 that the partitions from agglomerative model-based clustering are used to initialize the EM algorithm. The estimates for the component parameters are further refined through this process. As with the agglomerative model-based clustering function described in the previous section, this does not need to be implemented separately. The Model-Based Clustering Toolbox includes a function called mbcfinmix that implements the EM algorithm for the four basic models described in Section 1.3 and Table 2. The basic syntax for this function is >> [wts,mus,vars] = mbcfinmix(data,muin,varin,wtsin,model);
16
Documentation
January 2003
The function returns estimates of the model parameters: weights, means, and covariances. The wts argument is a vector containing the c weights, one for each term. The variable mus is a d x c matrix, where each column corresponds to a component mean. Recall that c is the number of components in the mixture, and d is the dimensionality of the data. The variable vars is a 3-D array, where each page (i.e., third dimension) corresponds to a covariance matrix. Thus, the dimensions of vars is d x d x c. The input arguments muin, varin, and wtsin are similar in form and contain the initial values for these parameters. In the case of model-based clustering, these are obtained from the partitions from agglomerative clustering part of the process. However, in general, these initial values can be from any reasonable source. The input variable data is an n x d matrix containing the observations, and model is a number indicating one of the 4 basic models (see Table 2).
4.2 Model-Based Clustering Process We provide a function called mbclust that implements the entire model-based clustering procedure, including the initialization, the EM, and the selection of the best model. The basic syntax for this function is >>[bics,bestmodel,allmodels,Z,clabs]=mbclust(data,maxclus); As before, the input variable data is an n x d matrix containing the observations. The variable maxclus is the maximum allowable number of clusters or component densities in the mixture (i.e., the maximum allowed value for c). The output variable bics is a matrix that contains all of the BIC values for each model and number of clusters. The variable bics contains 4 rows and maxclus columns, where each row corresponds to a model and each column corresponds to the number of terms or clusters. The variable bestmodel is a MATLAB structure that contains the parameters for the best model, as indicated by the highest BIC value. The structure has the following fields: bestmodel.pies bestmodel.mus bestmodel.vars The variable allmodels is a MATLAB structure that contains information on all of the models. Each record (there are 4) of allmodels contains information for one of the models. The field clus is another structure where each record (there are maxclus of them) contains the parameter estimates for the model. Finally, the structure clus contains 3 fields: pies, mus, vars. For example, allmodels(2).clus(5).pies has the weights for Model 2, 5 clusters. The structure clus is actually a sub-structure (or field) under the main structure called allmodels.
17
Documentation
January 2003
The variable Z is the same matrix as described in Section 3. The output variable clabs contains cluster labels for the n observations, as given by the bestmodel.
5. Visualizing the Results In this section, we describe various methods for visualizing the results from clustering. These include methods for showing the clusters and plotting the values of the BIC (Section 5.1). In Section 3, we described the dendrogram method of visualizing the results of hierarchical clustering, whereas Section 5.2 presents an alternative way of viewing the hierarchical structures from clustering. Finally, in Section 5.3, we describe a new way of displaying the results of clustering high-dimensional data called ReClus plots.
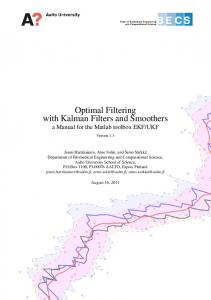
5.1. Plotting the BICs As discussed before, the model one chooses is the one that corresponds to the highest BIC value. So, it would be useful to plot all of the BIC values for all models under consideration. We include the function called plotbic that will provide such a display. It uses the output variable bics from mbclust, and the basic syntax is >> plotbic(bics,varname) The input argument varname is optional. It is a character array containing the variable name to be included in the title. Using the results of the function mbclust as applied to the data set in data.mat, we have the plot of the BIC values in Figure 11. Note that in this case, we did not use the optional input argument varname.
5.2. Rectangle Plots The treemap display of Johnson and Shneiderman [Johnson and Shneiderman, 1991], [Shneiderman, 1990] is an alternative to the dendrogram as a display for hierarchical clustering or other hierarchical arrangements of data (e.g., directory structures for computer files). This takes the output from agglomerative clustering [Everitt, 1993] and shows it in a space-filling display. Recall that in agglomerative clustering, one starts with each observation in an individual cluster. At each stage of the algorithm, the two closest clusters are merged, where close is determined by the distance used (e.g., Euclidean, Mahalanobis, city block, etc.) and the type of linkage (e.g., single, complete, etc.). The output of agglomerative clustering can be viewed in a tree or dendrogram (see Figure 10). A dendrogram can be shown vertically or horizontally, but it essentially consists of many U-
18
Documentation
January 2003
Figure 11. This shows the BIC values resulting from model-based clustering for the data set described in Section 3. Note that for Models 3 and 4, we display only 3 points. This indicates that for c ≥ 4 , the covariance matrices for one or more terms were singular.
shaped lines that show the hierarchical structure of the clustering algorithm. The treemap method displays this in a series of nested rectangles (or ellipses). The parent rectangle (or root of the tree) is given by entire display area. The treemap is obtained by recursively subdividing this parent rectangle, where the size of each sub-rectangle is proportional to the size of the node. The rectangles are further subdivided horizontally, vertically, horizontally, etc., until a given (based on the number of desired clusters) leaf configuration is obtained. Note that in the dendrogram shown in Figure 10 the user can specify a distance or dissimilarity value along the vertical axis. Different clusters are obtained depending on what value is specified. For example, if the user specifies a value of 120, then 3 clusters are obtained. In the treemap method, these 3 clusters would be shown as nested rectangles, with the whole display area representing the parent rectangle. In some applications, the user might have the treemap display the entire hierarchical structure. To display a treemap, the user must specify the number of clusters. If the user wants to explore other cluster configurations (by specifying a different number of clusters), then the display is re-drawn. It should also be noted that in the treemap display, there is no measure of distance (or dissimilarity) associated with the clusters as there is in the dendrogram. A further drawback to the treemap method is the lack of information about the original data, because the rectangles are just
19
Documentation
January 2003
given labels. That is, the data are not displayed as glyphs; instead they have labels such as: C1, C2, C3. The treemap as developed by Johnson and Shneiderman [1991] has not been implemented in this toolbox. We provide the information here as background for rectangle plots and ReClus. To address some of the issues, Wills [1998] developed the rectangle visualization method, based on the treemap display. This method also works with the output of hierarchical clustering, but displays the points as glyphs. The layout of the glyphs is determined by the hierarchical structure given by the clustering. The rectangle plots of Wills split the rectangles along the longest side, rather than alternating vertical and horizontal splits as in treemap. They keep splitting until it reaches a leaf node or until the cutoff distance is reached. If a rectangle does not have to be split because it reaches this cutoff point, but there is more than one observation in the rectangle, the algorithm continues to split until it reaches a leaf node. However, it does not draw the rectangles. It uses this information to determine the layout of the points as glyphs, where each point is now in its own rectangle. The advantage to this method is that other configurations (i.e., number of clusters) can be shown without re-displaying the glyphs; only the boundaries of the rectangles are redrawn. The rectangle method of Wills is suitable for linking and brushing applications, where one can highlight an observation in one plot (e.g., a scatterplot) and see the same observation highlighted in another (e.g., a rectangle plot). Some of the other advantages include • • •
the ability to specify the dissimilarity cutoff value that would in turn determine the number of clusters, the display layout (i.,e., position of the glyphs) does not need to change if the user specifies a different cluster configuration, only the lines delineating the rectangles change the linkage with the original data points is retained
A disadvantage is that some of the nesting structure seen in treemaps is lost in the display. Rectangle plots are shown in Figures 12 and 13, showing the output from agmbclust. Note that this is an alternative to the dendrogram of the data set shown in Figure 10. However, in comparing the two plots, keep in mind that the dendrogram shows the top 30 observations, not the full 50. The rectangle plot method is included in this toolbox as the function rectplot. The basic syntax for this is >> rectplot(Z,nc,clabs) This uses the familiar matrix Z that is used to create the dendrogram. The input variable nc represents the number of clusters or rectangles to include in the plot. There is a third optional argument clabs, which is an n-dimensional vector containing the true class labels for the observations, if known. If this is included, then each observation is plotted using the class label. Otherwise, the observation number is used.
20
Documentation
January 2003
Figure 12. This is an example of the function rectplot with the output from agmbclust. The observation numbers are used as the glyphs. This can be compared with the dendrogram in Figure 10, keeping in mind that the Figure 10 shows 30 points rather than all 50 observations.
Figure 13. If we call rectplot asking for 50 clusters (each observation is its own cluster), then this is the result. Note that the numbers are displayed in the same place as in Figure 12
21
Documentation
January 2003
5.3. ReClus Plots Another disadvantage of the treemap and rectangle method is that they are both suitable for displaying the results of agglomerative clustering only. In many cases, the analyst might want to use some other clustering method such as model-based clustering or k-means and view the results. ReClus is a way to extend the ideas of the rectangle method to display configurations from other cluster methods [Martinez, 2002; Martinez & Wegman, 2002]. As in the previous methods (treemap and rectangle plots), ReClus uses the entire display area as the parent rectangle. This is then partitioned into rectangles, where the area is proportional to the number of observations that belong to that cluster. The pseudo-code is given here. Step 0. Set up the parent rectangle. Note that we will split on the longer side of the rectangle according to the proportion of observations that are in each group. Step 1. Find all of the points in each cluster and the corresponding proportion. Step 2. Order the proportions - ascending. Step 3. Find all of the rectangles. Partition the proportions into 2 groups. If there are an odd number of clusters, then put more of the clusters into the 'left/lower' group. Step 4. Based on the total proportion in each group, split the longer side of the parent rectangle. We now have two children. Note that we have to normalize the proportions based on the parent. Step 5. Repeat steps 3 through 4 until all rectangles represent only one cluster. Step 6. Find the observations in each cluster and plot, either as the case or observation label or the true class label (if known). Before we can call the function that displays ReClus plots, we need to first get the cluster labels as given by the cluster scheme. If model-based clustering was used to cluster the observations, then the following will obtain the desired information: >>[clabs,errdata] = ... mixclass(data,bestmodel.pies,bestmodel.mus,bestmodel.vars); Note that the clabs variable is the same one obtained when mbclust is called, and we are using the same data set as before. This function can be used with any finite mixture, not just the output from mbclust. We can now call reclus, as described below. ReClus (reclus) has several views. The first is to plot the observations using the case label as the glyph. See Figure 14 for an example of this layout. The syntax is >> reclus(clabs); If we know the true class labels, then we can show those numbers instead. This will give us a visual picture of how jumbled the clusters are according to the true class information. Since we do not have the true class labels for this data set, we will just assign some labels, so we can give an example of this type of ReClus plot. The following MATLAB statement assigns some arbitrary class labels:
22
Documentation
January 2003
Figure 14. This shows the output from model-based clustering using the results from the best model. These results make sense, given the model that was used to generate the data. Here we see the basic use of reclus, where case or observation numbers are displayed in each cluster.
>> trulabs = [ones(1,6),2*ones(1,14),3*ones(1,8),4*ones(1,22)]; We can now call reclus as follows: >> reclus(clabs,trulabs,errdata) This layout is shown in Figure 15. Sometimes, the color is difficult to distinguish, and we might be interested in seeing what observations have a high probability of belonging to the cluster. We can call reclus with a threshold as follows: >> reclus(clabs,trulabs,errdata,.999) Observations that have a posterior probability higher than the threshold are shown in black and are bolded. To summarize, the treemap and rectangle plots [Wills, 1998] can be used to visualize hierarchical clustering. The ReClus plot is used for other clustering methods, such as model-based clustering or k means. Both ReClus and rectangle plots are suitable for linking and brushing.
23
Documentation
January 2003
Figure 15. This Reclus plot shows the observations using their true class labels. We see that some of the observations should not be clustered together (recall they were arbitrary labels). The color bar indicates the posterior probability that the observation belongs to the cluster.
Figure 16. This ReClus plot shows the observations with a posterior probability higher than 0.999 in black, bold font.
24
Documentation
January 2003
6. Future Improvements In the coming year, we plan on making the following improvements to the Model-Based Clustering Toolbox: •
• • • •
We intend to add more of the models to the agglomerative model-based clustering part of the procedure. While previous work [Fraley and Raftery, 1996] showed that the unconstrained version of agglomerative model-based clustering was adequate as an initialization for the EM, including the other models would allow one to use this type of agglomerative clustering as a stand-alone method. We will implement the rest of the models in the finite mixture EM function to produce more options for the ‘optimal’ model. Initialization of the agglomerative model-based clustering using adaptive mixtures [Priebe, 1994; Solka, 2001]. Improvements will be made to the function that displays Wills’ rectangle plots to allow the user to specify the ‘distance’ rather than the number of clusters. We will make some improvements to the ReClus display method to allow brushing and highlighting of points.
Finally, we plan on creating a stand-alone GUI for clustering, which will include model-based clustering and other clustering methods (e.g., agglomerative, k-means, etc.). We welcome any suggestions for improvements, changes, fixes, etc. to the Model-Based Clustering Toolbox and the ideas mentioned above. Please send them to the contact person given at the beginning of this documentation.
7. Installation Instructions The following installation instructions are for Windows versions of MATLAB. This toolbox can also be used with Unix and Linux operating systems, with suitable changes to the directory structure for toolboxes and paths.
1. First download the required MBCToolbox.zip from the website and save it in a temporary directory. This file contains this documentation in .pdf form, as well as the .m files described in the Reference Section. 2. Make a new directory under your current MATLAB toolbox installation. In most cases, this would be: C:\MATLAB6p5\toolbox\mbctool
25
Documentation
January 2003
3. Double click on the MBCToolbox.zip file and extract files to the above directory. Note that you could also create this new directory in the unzipping process. 4. The MATLAB search path must be updated for you to use the toolbox files from any directory. The search path is kept in the pathdef.m file. By default, it is stored in the following directory: C:\MATLAB6p5\toolbox\local Before starting MATLAB, open the file pathdef.m using any text editor. One way to do this is to double-click on the file from Windows Explorer. This will open the file in the MATLAB text editor. Add the new directory matlabroot, '\toolbox\mbctool;',... to the path.
5. Close and save the file. Start MATLAB. Type helpwin at the command line to bring up the Help Browser. Click on mbctool for a list of the available functions in the Model-Based Clustering Toolbox. Alternative to Step 4: a. Start MATLAB. b. Start the Set Path dialog box from the File menu in the MATLAB Command Window. c. Add the new directory for the Model-Based Clustering Toolbox to the path. Hit the Save button to permanently save your changes to the pathdef.m file. d. Close MATLAB and restart it to see the changes in the Help files.
26
Documentation
January 2003
8. Function Reference %%%%%%%%%%%%%%%%%%%%%%%%%%%%%%%%%%%%%%%%%%%%%%%%%
agmbclust %%%%%%%%%%%%%%%%%%%%%%%%%%%%%%%%%%%%%%%%%%%%%%%%% AGGLOMERATIVE MODEL BASED CLUSTERING - NO INITIAL PARTITION This function does the agglomerative model-based clustering of Fraley [1998]. NOTE that this one does the MB agglomerative clustering from the FULL data set (rather than some other initialization such as minimal spanning trees). Z = AGMBCLUST(X) The output Z contains the cluster array that MATLAB expects. This can be used in the DENDROGRAM or the RECTPLOT plotting functions. %%%%%%%%%%%%%%%%%%%%%%%%%%%%%%%%%%%%%%%%%%%%%%%%%
genmix %%%%%%%%%%%%%%%%%%%%%%%%%%%%%%%%%%%%%%%%%%%%%%%%%
GUI FOR GENERATING MULTIVARIATE RANDOM VARIABLES FROM MIXTURE GENMIX This GUI will generate random variables using a finite mixture model. The user can pick between several models: 1: 2: 3: 4.
COV COV COV COV
= = = =
sigma^2*I sigma_k^2*I SIGMA_hat SIGMA_k_hat
(equal, diagonal covariances) (unequal, diagonal covariances) (equal, full covariance matrix) (unconstrained covariances)
The user can save the random variables to a text file (saved in row (observations) and column (variables) format. The data can also be saved to the MATLAB Workspace with a user-assigned variable name.
%%%%%%%%%%%%%%%%%%%%%%%%%%%%%%%%%%%%%%%%%%%%%%%%%
mbcfinmix %%%%%%%%%%%%%%%%%%%%%%%%%%%%%%%%%%%%%%%%%%%%%%%%% MODEL-BASED FINITE MIXTURES USING THE EM ALGORITHM This is written for MBCLUST. Note that at this time it will do multivariate only. This uses relative differences between
27
Documentation
January 2003
log-likelihoods to check for convergence. If the estimated covariance matrices become close to singular, the function returns empty arrays for the model. [WTS,MUS,VARS] = MBCFINMIX(DATA,MUIN,VARIN,WTSIN,MODEL)
INPUTS:DATA is a matrix of observations, one on each row. MUIN is an array of means, each column corresponding to a mean. VARIN is a vector of variances in the univariate case. In the multivariate case, it is a 3-D array of covariance matrix, one page per component density. WTSIN is a vector of weights. MODEL is one of the 4 models: 1: COV = sigma^2*I (equal, diagonal covariances) 2: COV = sigma_k^2*I (unequal, diagonal covariances) 3: COV = SIGMA_hat (equal, full covariance matrix) 4. COV = SIGMA_k_hat (unconstrained covariances) %%%%%%%%%%%%%%%%%%%%%%%%%%%%%%%%%%%%%%%%%%%%%%%%%
mbclust %%%%%%%%%%%%%%%%%%%%%%%%%%%%%%%%%%%%%%%%%%%%%%%%% Model-based clustering - entire process [BICS,BESTMODEL,ALLMODELS,Z,CLABS] = MBCLUST(DATA,MAXCLUS); This does the entire MB Clustering given a set of data. It only does the 4 basic models, unequal-unknown priors. It returns the BESTMODEL based on the highest BIC. The output variable BICS contains the values of the BIC for each model (row) and number of clusters (col). The output variable CLABS contains the class labels for the input data according to the optimal clustering given by BIC. The output variable Z contains the cluster structure from the agglomerative model-based clustering. The matrix Z can be used in the DENDROGRAM function or the RECTPLOT plotting function. The output variable ALLMODELS is a structure containing all of the models. ALLMODElS(I) indicates the I-th model type (1-4) and CLUS(J) indicates the model for J clusters. The input variable MAXCLUS denotes the maximum number of clusters to check for.
28
Documentation
January 2003
%%%%%%%%%%%%%%%%%%%%%%%%%%%%%%%%%%%%%%%%%%%%%%%%%
mixclass %%%%%%%%%%%%%%%%%%%%%%%%%%%%%%%%%%%%%%%%%%%%%%%%%
MIXCLASS
Gets the classification from a mixture model.
[CLABS,ERR] = MIXCLASS(DATA,WGTS,MUS,VARS) For a given set of DATA (nxd) and a mixture model given by WGTS (weights), MUS (component means), and VARS (component variances), returns the cluster labels in CLABS, along with the associated classification error in ERR.
%%%%%%%%%%%%%%%%%%%%%%%%%%%%%%%%%%%%%%%%%%%%%%%%%
plotbic %%%%%%%%%%%%%%%%%%%%%%%%%%%%%%%%%%%%%%%%%%%%%%%%% Plots the values of the BIC for model-based clustering PLOTBIC(BICS,VARNAME) This takes the results of MBCLUST and plots the values of the BIC for the various models. You can plot the variable name in the title via the optional argument VARNAME. %%%%%%%%%%%%%%%%%%%%%%%%%%%%%%%%%%%%%%%%%%%%%%%%%
reclus %%%%%%%%%%%%%%%%%%%%%%%%%%%%%%%%%%%%%%%%%%%%%%%%% Rectangle cluster plot - any clustering method - any dimensionality of the data. RECLUS(CLABS,TRULABS,ERR,THRESH) This can be used to plot the results of any clustering algorithm (k-means, agglomerative, model-based clustering), where the input is the cluster labels for each data point. RECLUS(CLABS) plots the rectangles, where the area of each rectangle represents the proportion of points falling into that cluster. The data are plotted using their observation number. RECLUS(CLABS,TRULABS) plots the rectangles as before, but the position of the symbols as case labels matches the same position when the true class labels are used as the plotting symbol - see the options below for 3 or 4 arguments. This allows the user to see which cases correspond to specific symbols plotted with the true class
29
Documentation
January 2003
label. RECLUS(CLABS,TRULABS,ERR) plots the rectangles as above, where each symbol color represents the probability that the point belongs to the cluster; i.e., 1 - ERR. Note that this can be used only when the clustering is done using model-based clustering (MBCLUST) or finite mixtures (MBCFINMIX). The classification ERR is obtained using MIXCLASS. Note also that if one wants to plot the 'uncertainty' in the clustering, then 1 - ERR should be used as the input argument. A colorbar is included to indicate the color scale. RECLUS(CLABS,TRULABS,ERR,THRESH) plots the points as above. The value THRESH is used to indicate which observations have a classification certainty greater than THRESH; these values are plotted in bold. Thus, the color indicates the probability that it belongs to the cluster on a continuous scale, and the bold indicates a binary value - above or below THRESH.
%%%%%%%%%%%%%%%%%%%%%%%%%%%%%%%%%%%%%%%%%%%%%%%%%
rectplot %%%%%%%%%%%%%%%%%%%%%%%%%%%%%%%%%%%%%%%%%%%%%%%%% Rectangle cluster plot for Agglomerative Clustering Output RECTPLOT(Z,NC,CLABS) This plots NC clusters based on the cluster scheme given by Z in a rectangle plot. Each rectangle corresponds to a cluster of observations. If the optional input argument CLABS is given, then the points are plotted according to their true class labels given in CLABS. Thus, all class 1 points will plot with the '1' symbol, all class 2 points will plot with the '2' symbol, etc. If CLABS is not used, then the observation numbers are used as symbols.
30
Documentation
January 2003
References
Banfield, Jeffrey D. and Adrian E. Raftery (1993). “Model-based Gaussian and non-Gaussian clustering,” Biometrics 49:803-821. Celeux, G. and G. Govaert, (1995). “Gaussian Parsimonious clustering models.” Pattern Recognition, 28:781-793. Dempster, A. P., N. M. Laird, and D. B. Rubin, 1977. ‘Maximum likelihood from incomplete data via the EM algorithm,’ Journal of the Royal Statistical Society, B., 39:1-38. Everitt, Brian S., 1993. Cluster Analysis, Edward Arnold Publishers, New York. Fraley, Chris and Adrian E. Raftery, (1998). “How many clusters? Which clustering method? Answers via model-based cluster analysis,” Computer Journal, 41:578-588. Fraley, Chris, (1998). “Algorithms for model-based Gaussian hierarchical clustering,” SIAM Journal on Scientific Computing, 20:270-281. Johnson, B., and B. Shneiderman, 1991, ‘Treemaps: a space-filling approach to the visualization of hierarchical information structures,’ Proceedings of the 2nd International IEEE Visualization Conference, pp. 284 - 291. Martinez, Angel R., 2002. A Framework for the Representation of Semantics, Ph.D. Dissertation, George Mason University.
Martinez, Angel R. and Edward J. Wegman, 2002, ‘A text stream transformation for semantic-based clustering,’ Proceedings of the Interface, Montreal, Canada. Priebe, Carey L., (1994), “Adaptive Mixtures,” Journal of the American Statistical Association, 89:796-806. Shneiderman, B., 1990, ‘Tree visualization with tree-maps: a 2D space-filling approach,’ ACM Transactions on Graphics, 11, pp. 92 - 99. Solka, Jeffrey L., (2001), Private communication. Wills, G. J., 1998, ‘An interactive view for hierarchical clustering,’ Proceedings of Information Visualization ‘98, pp. 26 - 31.
31