Current methods for teaching lean include hands-on projects and simulation. ... these deficiencies through the use of VE-Suite, a virtual engineering software.
Available online at www.sciencedirect.com
Procedia Computer Science 6 (2011) 100–105
Complex Adaptive Systems, Volume 1 Cihan H. Dagli, Editor in Chief Conference Organized by Missouri University of Science and Technology 2011- Chicago, IL
Model Development of a Virtual Learning Environment to Enhance Lean Education Akalpit Gadre, Elizabeth Cudney, Ph.D., and Steven Corns, Ph.D. Department of Engineering Management and Systems Engineering Missouri University of Science and Technology, Rolla, Missouri 65401, USA
Abstract Modern day industry is becoming leaner by the day. This demands engineers with an in-depth understanding of lean philosophies. Current methods for teaching lean include hands-on projects and simulation. However, simulation games available in the market lack simplicity, ability to store the results, and modeling power. The goal of this research is to develop a virtual simulation platform which would enable students to perform various experiments by applying lean concepts. The design addresses these deficiencies through the use of VE-Suite, a virtual engineering software. The design includes user-friendly dialogue boxes, graphical models of machines, performance display gauges, and an editable layout. The platform uses laws of operations management such as Little’s law, economic order quantity (EOQ) models, and cycle time. These laws enable students to implement various lean concepts such as pull system, just-in-time (JIT), single piece flow, single minute exchange of dies (SMED), kaizen, kanban, U-layout, by modifying the process parameters such as process times, setup times, layout, number, and placement of machines. The simulation begins with a traditional push type mass production line and the students improve the line by implementing lean techniques. Thus, students experience the advantages of lean real time while facing the real life problems encountered in implementing it. © 2011 Published by Elsevier B.V. Keywords: Lean; education; simulation; modeling; and virtual engineering
Introduction In the competition to produce low cost, high quality products; industries want to become leaner, faster. Lean manufacturing has its roots in the Toyota Production System (TPS) originated at the Toyota Motor Company by Taiichi Ohno and Shigeo Shingo. Lean today, has changed from its origin as a manufacturing ideology to an ideology that ties in all aspects of the industry together. This demands engineers with strong lean basics. It is important to know about the lean tools, but it is even more important to know the way to apply these tools in the most effective manner while mitigating risk [3]. Modern-day technology is changing rapidly. Engineering education today requires a curriculum which provides students with learning opportunities that utilize the latest technologies [14]. Thus, it is necessary to develop a curriculum that uses the latest technology for instruction and equips engineers with the skills required to fulfill industry expectations for lean and related courses. Therefore, the purpose of this research is to develop a state-ofthe-art factory simulator to provide hands-on experience to students which has the combined effect of reading books, listening to lectures, and watching video clips [20]. In the past, simulation has demonstrated its tremendous potential as an aid for designing and analyzing complex production systems in factory settings [12], but there are not many frameworks for the use of simulation in educational settings [8].
1877–0509 © 2011 Published by Elsevier Ltd. doi:10.1016/j.procs.2011.08.020
Akalpit Gadre et al. / Procedia Computer Science 6 (2011) 100–105
101
The goal of this research is to develop a user friendly, virtual learning environment wherein the students in lean and related courses would be able to apply lean tools on a simulated production line. The main purpose here is to acquaint students with the real life issues of implementing lean tools in actual factory settings, thus fostering the students’ development through active learning in the classroom and improving students’ learning, motivation, and retention [3]. This paper explains the various assignments, calling for the usage of various lean tools, incorporated in the virtual engineering model. A lean system acts as a complex adaptive system (CAS) as it includes many continuously varying parameters. These parameters have goals, inner structure, and relationships with other parameters. The behavior and interactions of these parameters change the system environment. This continuous change in the system as well as the variables defines the complexity of the system [23]. Lean and its tools fit the above definition of a CAS. Lean tools such as just-in-time (JIT), kanban, 5S, standardization of work, single minute exchange of dies (SMED) are continuously varying system parameters having the goals such as reducing inventory, creating flow, balancing the production line, reducing setup time, improving the product quality, and achieving the takt time. Each tool has an inner structure and strategies for application and the interactions of the lean tools change (improve) the production process (a lean system). Motivation and Review of Related Work The advantages of giving students hands-on experience have been identified and realized for a long time [20]. But traditionally, it has become necessary to have actual and dedicated laboratories for students to gain such experience. However, a real world production line would be too costly to develop and maintain [7]. In addition, it would be difficult to allow students into an industry for experimentation as the companies would be resistant to losing production time while students experiment on a working production line. Thus, creating a simulated factory or product line would be an effective way to achieve the desired hands-on experience. A simulation has many advantages over a real life production process. It is much more comfortable and less time-consuming to model and analyze production processes in a simulation than in real life [21]. Simulation offers an opportunity for students to experience the problems and the pressure faced by company executives while making crucial decisions. Simulation is more effective as it tells, shows, and involves the user in the process of decision making. In a virtual factory, physical process components (i.e., equipment and materials) and conceptual process components (i.e., process plans and equipment schedules) can be represented with a fair degree of accuracy. The creation of a full scale factory is not necessary for the analysis as an abstract representation of equipment generally serves the purpose. Due to this advantage, virtual factories are commonly used to represent actual plants by manufacturing companies [19]. The use of various factory simulators has been studied previously. Choi et al. propose and explain the structure of a virtual factory simulator and validate it by applying it to a flexible manufacturing system [4]. Bagchi and Ratzo propose a simulator working on discrete event analysis. This simulator predicts work-in-process (WIP) position and is applied to a wafer fabrication factory [1]. Rezg et al. follow a five stage approach for the study of their simulation including 1) construction of a physical model that reflects the system requirements with the desired accuracy, 2) formation of the rules for treatment of the products, 3) description of the manufacturing progress of each product through the line, 4) decision regarding the inventory control policy and the maintenance strategy, and 5) development of the production line scenarios and their optimization [17]. Denzig and Akbay demonstrate the use of simulation modeling approach for the design and optimization of pull manufacturing system at a printed circuit board (PCB) manufacturing company [6]. Moris et al. suggest a need to focus on improvement of modeling features and estimation of distributions for production data [12]. A step further to the above research would be to design a factory simulator for educational settings with improved modeling features and production data distributions. Currently, a typical lean curriculum at many universities consists of lectures, guest lectures, paper based assignments, course projects, and presentations. The following research attempts to incorporate computer simulation in lean and related courses. Wan et al. propose a web-based kanban simulation and a fully web-based lean simulation game. The authors state that the use of hypertext pre-processors and structured query languages make simulation games more effective knowledge imparting tools. The authors’ findings suggest that most widely implemented educational games are deficient in communication with users. The authors also uncover the need to develop innovative simulations with better graphical user interfaces to enhance lean education [20]. A way to respond to this need would be to use a virtual engineering simulator (VE-Suite, in the case of this research) for the simulation.
102
Akalpit Gadre et al. / Procedia Computer Science 6 (2011) 100–105
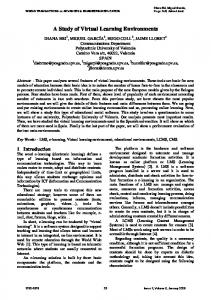
Lean Overview and Relevant Literature Non-value adding activities (NVA) are the activities for which the customer would not be willing to pay. Lean considers the NVA as wastes and focuses on the identification and reduction (elimination) of these activities. According to the developers of the Toyota Production System, a production facility has seven major types of wastes [10], namely, overproduction, excess transportation, motion, waiting, processing, inventory, and defects. Some of the major factors contributing to these wastes are large setup times, long distances between machines, excess level of WIP, and large batches. The lean tools help to improve the company’s operations by reducing these factors in the following way. Lean recommends the JIT ideology for low inventories, cellular manufacturing for less transport and motion, SMED, which is also referred to as quick setup, for less setup times and process flexibility for low batch sizes [2, 9]. In addition, flexible work system and 5S help in organizing the factory. Value stream mapping (VSM) displays the NVA of the existing process clearly. Standard work, total productive maintenance (TPM), and jidoka assist in the design and implementation of improved processes. Kanban and heijunka connect a company to its suppliers and customers. Group technology, synchronous manufacturing, cellular manufacturing, focused factories, 5S, visual control systems, kanban, rapid replenishment, JIT supply, and JIT shipping reduce waiting time, prevent the need for complicated scheduling and process planning, and help the supervisor to maintain control over the plant. In addition, visual control systems, 5S, standard work, SMED, jidoka, and TPM reduce activity duration and cost. Jidoka and TPM also reduce the amount of material used. SMED, 5S, visible layout, and ability to perform multiple functions result in substantial flexibility in production. Poka-yoke eliminates waste arising due to process unreliability while working upon a WIP [13, 16, and 18]. Finally, JIT synchronizes the pace of the whole production system to enable the capacity to produce at takt time [5]. Many attempts have been made to classify the lean tools. Pavnaskar et al. classify lean tools, provide guidance regarding their usage, and establish a path of improvement by connecting shop-floor problems, wastes, and lean tools through various examples [16]. Wong et al. state the findings of their study as lean implementation typically starts with the introduction of standardized work, 5S, kaizen, and kanban which takes less than five years to materialize. After stability is achieved in this first stage, the second stage is to implement poka-yoke, JIT, and standardized work. These typically take 5-10 years of implementation [22]. Further, while implementing lean tools, it is necessary to gain the acceptance of management and of production workers. The proof of the success of a new system needs to be demonstrated [13]. Thus, while applying lean tools to a company, it is necessary to go step by step, work on various projects, and then integrate those projects into a plant-wide lean system. Students get the experience of this step-by-step implementation approach by solving and working through various assignments on the simulated production line. Model Development This section describes the actual procedure followed for the development of the virtual simulation platform. First, a layout was created (the layout consists of a simulated production line with four processes and can be altered by the user to implement various shapes of layout). VE-Suite was used for the simulation (VE-Suite is a virtual simulation software which uses the libraries of open screen graph and makes it possible for the user to create animations and designate physical properties such as mass and friction to the models). In order to create the layout, the machines used for the above-mentioned processes were modeled using Blender, an open source 3D modeling package. These blender files were then converted to a VE-Suite compatible format. After conversion, the blender models were imported to VE-Xplorer, the layout was arranged [Figure 1], and the models were then assigned physical properties. Secondly, the equations to be used to link the machines into a production line were searched for and framed. Then these equations were validated using Matlab (the validation program gets input data from an excel sheet and produces output such as total time, cycle time, waiting time, takt time, throughput, and total rejection rate). In the third step, codes were written for these mathematical equations using C++ language. Later, the graphical user interfaces were designed and created using the wxWidgets Anthemion Dialog Blocks 4.39. Similarly, various assignments were designed and the graphical user interfaces for solving those assignments were created (discussed in the next section). The final step was the integration of the model, the code, and the user interface. This made it possible for the user to enter the production data such as WIP, demand rate, available time, and throughput to obtain output such as cycle time, total rejection rate, waiting time and other production parameters. The model is designed in such a way that, as the user enters different values of the data the solution will be shown in the gauges. The display of the solutions would demonstrate the exact effects of the changes made by the students.
Akalpit Gadre et al. / Procedia Computer Science 6 (2011) 100–105
103
Figure 1: Layout in VE-Suite Assignments This section of the paper describes various assignments included in the model to bolster students’ learning. As discussed earlier, one of the seven most important wastes of production is inventory or level of WIP. Higher inventory results in increased cost, scrap, and hidden quality problems. Thus, the focus of the student should be to keep the WIP to a minimum. The most important law governing WIP is Little’s law. This is the first assignment, calculation of cycle time using Little’s law [Figure 2]. Little's Law states that, “Under steady state conditions, the average number of items in a queuing system i.e., WIP equals the product of average rate at which items arrive i.e., throughput and the average time that an item spends in the system i.e., cycle time,” as shown in Equation 1 [11]. (1) CT WIP / TH Where, WIP = average number of items in the queuing system, CT = average time spent in the system for an item, and TH = average number of items arriving per unit time [3, 11].
Figure 2: User interface for Little’s law Students enter the values of WIP and throughput by observing the time and process study data which determines the cycle time. The second assignment is the application of heijunka or demand and production leveling [Figure 3]. Students are given three options. The first option has a demand of 50 pieces every month with the minimum deviation of 2 pieces. In order to achieve this, the company has to pay a discount of 10% on the selling price (SP). The second option has demand of 50 pieces, deviation of 7 pieces, and the company has to pay a discount of 5% on the SP. The third plan has demand of 45 pieces, deviation of 15 pieces, and the company does not have to pay a discount. Students would select a plan and enter the demand rate (i.e. number of orders) in other assignments. As the students apply JIT, they will realize that less demand variation is better to handle.
Figure 3: User interface for heijunka assignment
104
Akalpit Gadre et al. / Procedia Computer Science 6 (2011) 100–105
The third assignment is to implement SMED [Figure 4]. SMED refers to a quick changeover of setup from manufacturing one part to the next part [10]. Students reduce the setup time for a process by implementing SMED. In this assignment students are expected to differentiate the internal setup (setup that must be done on the machine while it is idle) and the external setup (setup that can be done outside the machine while the machine is running), change the internal setup to external setup, and change the setup time in the model.
Figure 4: User interface for SMED assignment The fourth assignment is to calculate the number of kanban cards [Figure 5 and Equation 2]. This is done by using the following formula. Students select an order package and enter the relevant demand rate and available time. Safety time is obtained from time study data and the container size depends upon the size and process constraints for the product. n
D u �Ta � S f N
(2)
Here, n = number of kanban cards, D = demand rate or number of orders rate, Ta = manufacturing lead time or time available, Sf = safety time, and N = container size [13].
Figure 5: User interface for number of kanban cards assignment Finally, the fifth assignment is to calculate the takt time [Figure 6]. Takt time is the ratio of total available time to total number of products in the order. Thus, the takt time is the time interval at the end of which one product should be produces. In other words, the time of a product at a process should not exceed the takt time [15]. Thus the assignment consists of calculating takt time and comparing it with process time.
Figure 6: User interface for takt time assignment Conclusions and Future Work This simulation platform can be used as a virtual laboratory to perform experiments on a production line. The virtual simulation assignments which are being developed, give students an overview of how to apply lean tools to an existing production line. They also bolster students’ learning through problem solving. Students would immediately see the effects of their suggested changes in the production line. Thus, this platform would help students in lean and related courses to learn through their work, improve retention, and visualize the otherwise costly effects of commonly made mistakes in real-time. The authors are currently working on the implementation of a case
Akalpit Gadre et al. / Procedia Computer Science 6 (2011) 100–105
105
study into the model. This case study models a real-world production line for an automotive shaft with four processes. Future plans are to develop a supply chain wherein universities will represent the vendors. Further, to make the simulation platform more realistic, a supply chain consisting of vendors, a main company, and customers is being modeled. Thus, the ultimate plan is to simulate a complete virtual manufacturing process. This would give the students even more insight into the dependence of lean (especially JIT) on the supply chain and logistics. References 1) Bagchi S., and Ritzo C., 2008, “A Full-Factory Simulator as a Daily Decision-Support Tool for 300mm Wafer Fabrication Productivity” Proceedings of the 2008 Winter Simulation Conference, 2021–2029 2) Boysen N., and Bock S., 2011, “Scheduling Just-In-Time Part Supply for Mixed-Model Assembly Lines” European Journal of Operational Research, 211, 15–25 3) Cudney E., Corns S., Grasman S., Gent S., and Farris J., 2011, “Enhancing Undergraduate Engineering Education of Lean Methods using Simulation Learning Modules within a Virtual Environment” ASEE Annual Conference & Exposition 4) Choi B., Park B., and Ryu H., 2004, “Virtual Factory Simulator Framework for Line Prototyping” Journal of Advanced Manufacturing Systems, 3 (1), 5–20 5) Deif A., 2010, “Computer Simulation to Manage Lean Manufacturing Systems” 2nd International Conference on Computer Engineering and Technology, 6, 677–681 6) Dengiz B., and Akbay K., 2000, “Computer Simulation of a PCB Production Line: Meta-modeling Approach” International Journal of Production Economics, 63, 195–205 7) Dessouky M., Verma S., Bailey D., and Rickel J., 2001, “A Methodology for Developing a Web-based Factory Simulator for Manufacturing Education” IIE Transactions, 33, 167–180 8) Freitas S., and Oliver M., 2006, “How Can Exploratory Learning with Games and Simulations within the Curriculum be Most Effectively Evaluated?” Computers & Education, 46, 249–264 9) Klier T., 1993, “Lean Manufacturing: Understanding a New Manufacturing System” ABI/INFORM, 67, 1–4 10) Liker J., 2004, “The Toyota Way: 14 Management Principles from the World’s Greatest Manufacturer” McGraw-Hill Publications, 126–284 11) Little J., and Graves S., 2008, “Building Intuition: Insights from Basic Operations Management Models and Principles” D. Chhajed and TJ. Lowe (eds.), 81–100 12) Moris M., Ng A., and Svensson J., 2008, “Simplification and Aggregation Strategies Applied For Factory Analysis in Conceptual Phase Using Simulation” Proc. of the 2008 Winter Simulation Conference, 6, 1913–1921 13) Mukhopadhyay S., and Shanker S., 2005, “Kanban Implementation at a Tyre Manufacturing Plant: a Case Study” Production Planning & Control, 16 (5), 488–499 14) National Academy of Engineering, 2005, “Educating the Engineer of 2020: Adapting Engineering Education to the New Century” The National Academic Press, Washington, D.C. 15) Nicholas J., and Soni A., 2006, “The Portal to Lean Production: Principles and Practices for Doing More with Less” Auerbach Publications, 57 16) Pavnaskar S., Gershenson J., and Jambekar A., 2003, “Classification Scheme for Lean Manufacturing Tools” International Journal of Production Research, 41 (13), 3075–3090 17) Rezg N., Xie X., and Mati Y., 2004, “Joint Optimization of Preventive Maintenance and Inventory Control in a Production Line Using Simulation” International Journal of Production Research, 42 (10), 2029–2046 18) Rivera F., and Chen F., 2007, “Measuring the Impact of Lean Tools on the Cost–Time Investment of a Product Using Cost–Time Profiles” Robotics and Computer Integrated Manufacturing, 23, 684–689 19) Wall J., and Ahmed V., 2008, “Use of a Simulation Game in Delivering Blended Lifelong Learning in the Construction Industry-Opportunities and Challenges” Computers & Education, 50, 1383–1393 20) Wan H., Chen F., and Saygin C., 2008, “Simulation and Training for Lean Implementation Using Web-Based Technology” International Journal of Services Operations and Informatics, 3 (1), 1–14 21) Wang P., Mohamed Y., Abourizk S., Asce S., and Rawa A., 2009, “Flow Production of Pipe Spool Fabrication: Simulation to Support Implementation of Lean Technique” Journal of Construction Engineering and Management, Oct, 1027–1038 22) Wong Y., Wong K., and Ali A., 2009, “A Study on Lean Manufacturing Implementation in the Malaysian Electrical and Electronics Industry” European Journal of Scientific Research, 38 (4), 521–535 23) Zhao J., 2007, “Supply Chain System Planning in Complex Adaptive System Perspective” 2005 International Conference on Services Systems and Services Management, 2, 1005–1008