8th ASCE Specialty Conference on Probabilistic Mechanics and Structural Reliability
PMC2000-139
MODEL ERRORS IN THE FAILURE PREDICTION MODEL OF GLASS STRENGTH S.G. Reid University of Sydney, NSW 2006, Australia
[email protected] Abstract Many investigations of the strength of window glass have been based on a glass failure prediction model developed at Texas Tech University. The model accounts for the geometrically non-linear load-response of thin glass plates, the time-dependence of glass strength, and the statistical variability of strengths. The model has been widely applied to derive practical design rules for window glass subject to wind loading. However, the glass failure prediction model is fundamentally flawed because it implies that the probability of failure is effectively independent of the load at the time of failure and it implies that the ‘shape’ of the strength distribution is unaffected by the stress history. The paper compares the failure prediction model with an alternative (more realistic) crack growth model and describes some modelling errors associated with the application of the failure prediction model to glass subject to sinusoidal loading representative of wind loads. It is shown that the results obtained from the failure prediction model and ‘equivalent’ crack growth models can be very different (qualitatively and quantitatively) and hence the modelling uncertainty associated with the failure prediction model is large.
Introduction Many recent developments in the theoretical modelling of glass strength have been based on a glass failure prediction model developed at Texas Tech University by Beason and others (Beason, 1980; Beason and Morgan, 1984). The model accounts for the geometrically non-linear load-response of thin glass plates (involving plate bending and membrane effects), the time-dependence of glass strength (dependent on the applied stress-history) and the statistical variability of strengths. Considerable research efforts have been directed to the estimation of the parameters of the failure prediction model and the application of the model to derive practical design rules for window glass. However, in previous work by the author (Reid, 1984; Reid, 1991) it has been shown that the glass failure prediction model is fundamentally flawed and unrealistic because it implies that the probability of failure is effectively independent of the applied stress at the time of failure and it implies that the ‘shape’ of the strength distribution is independent of the stress history. The failure prediction model was compared with a more realistic crack growth model of glass strength, considering the effects of ramp loading (Reid, 1991). It was shown that the failure prediction model significantly underestimates the probability of failure (by comparison with the more realistic crack growth model) for relatively rapid rates of loading such as those associated with dynamic wind loads. This paper presents a further comparison of the failure prediction model and the crack growth model, with regard to the predicted effects of sinusoidal loading (representative of wind loads). The paper includes brief descriptions of the failure prediction model and the crack growth model and describes the predicted effects of repeated periodic loading and a
Reid
1
peak load cycle. Conclusions are presented concerning the apparent modelling errors (qualitative and quantitative) associated with the failure prediction model. The Failure Prediction Model of Glass Strength The glass failure prediction model developed at Texas Tech University by Beason and others (Beason, 1980; Beason and Morgan, 1984) models the effects of time-dependent stresses in terms of ‘equivalent’ maximum principal tensile stresses s60 of 60 seconds duration: tf
s60 = [ ∫ σ (t )16 dt / 60]1/16 0
(1)
To account for biaxial stress effects, these equivalent stresses are ‘corrected’ depending on the ratio of the fully developed principal stresses. Accordingly, the probability of failure of a glass plate may be expressed in terms of a Weibull distribution of glass strength related to the ‘corrected’ equivalent (biaxial) 60-second stress s: p f = 1 − exp( − ∫ ks m dA) Area
(2)
A Crack Growth Model of Glass Strength The failure of glass involves fracture associated with distributed flaws (microcracks). In accordance with linear elastic fracture mechanics, the stress intensity associated with a flaw of size a subject to a nominal applied stress σ is characterised by a stress intensity factor KI = σY√a, where Y is a factor dependent on the crack geometry. Failure occurs when the stress intensity factor reaches a critical value KIc which is assumed to be a material property. Therefore, for any applied stress σ there is a critical flaw size ac corresponding to the critical stress intensity factor KIc, and hence the strength distribution of glass may be expressed in terms of the distribution of flaw sizes (Reid, 1991). Furthermore, the time-dependence of glass strength can be modelled in relation to the time-dependence of the flaw size distribution, accounting for the growth of cracks in response to applied stresses. Assuming the rate of crack growth is da / dt = C ( K I (a )) n = C (σY a ) n
(3)
then the relationship between the original flaw size a* at time t=0 and the final flaw size a at time t=T is defined by the equality Ia = It , where a
I a = ∫ a − n / 2 da = 2(a ( 2−n ) / 2 − a *( 2− n ) / 2 ) /(2 − n) a*
Reid
(4)
2
T
I t = ∫ C (σY ) n dt .
and
0
(5)
Calibration of Crack Growth Model to Match the Failure Prediction Model To match the failure prediction model of glass strengths, consider a distribution of initial flaw sizes corresponding to a Weibull distribution of initial flaw strengths such that the initial probability of failure is p f = 1 − exp(− ∫
Area
ρ 0 (σ / σ o ) m* dA)
(6)
where ρ0 represents the density of flaws of initial strength less than or equal to σ0 and (σ/σ0)m* represents the cumulative distribution function of the relevant flaw strengths. Crack growth model parameters ρ0, σ0 and m* can be determined to match the distribution of strengths given by the failure prediction model for a specified type of loading. The other crack growth model parameters are taken to be KIc = 0.7 (MPa√m), C= 80 (m/s)/(MPa√m)25 and n = 25 (Reid, 1991), and the crack geometry factor is taken to be Y = √(2/π), as for penny-shaped cracks. The parameters of the glass failure prediction model are taken to be m=9 and k=1.32 x 10⁻¹⁵ MPa-9m-2 for equivalent 60-second strengths, as reported by Beason and Morgan (1984) for new glass. Furthermore, it is assumed that the parameters of the failure prediction model have been determined to match test results obtained from ramp loading. Equivalent crack growth model parameters to match the glass failure prediction model for a stress rate of 1 MPa/s, are ρ0 = 2.231 (/m2), σ0 = 80 MPa and m*= 8.46 (Reid, 1991). Effects of Sinusoidal (Wind) Loading The effects of sinusoidal loading (representative of wind loading) are evaluated below in accordance with the failure prediction model and the matching crack growth model. Repeated low-stress cycles and a peak stress cycle are considered, assuming the nominal time-dependent stress is σ(t) = A sin(ωt), where A is the maximum stress amplitude and ω is the frequency of the periodic loading. Consideration is given to repeated periodic loading with A = 10 MPa and a load duration of T = 106 sec (277.8 hours), and a peak stress cycle with A = 25 MPa and ω = 10π. Failure Prediction Model with Sinusoidal Loading Repeated periodic loading over a relatively long period of time T yields π
s = A [T /(2π ) ∫ (sin θ )16 dθ / 60]1 / 16 = 0.6697 AT 1 / 16 0
Reid
(7)
3
Accordingly, for A = 10 MPa and T = 106 sec (277.8 hours), s = 15.88 MPa. The corresponding density of critical flaws (after eqn 2) is 84.8 x 10⁻⁶ (/m2) (in response to the repetitive cyclic loading alone). Similarly, a single sinusoidal load cycle gives: π
s = A [ ∫ (sin θ )16 dθ /(60ω )]1/16 0
(8)
Accordingly, for a single peak load cycle with stress amplitude A = 25 MPa and ω = 10π, s = 15.14 MPa. The corresponding density of critical flaws is 55.2 x 10⁻⁶ (/m2) (in response to the single peak load cycle alone). Furthermore, in accordance with the failure prediction model, the response to the combined effects of the repetitive cyclic loading and a single peak load is characterised by an equivalent 60-second stress s = (15.1416+15.8816)1/16 = 16.26 MPa. Hence the combined effects of the repetitive cyclic loading and the peak load cycle give a critical flaw density of 105.1 x 10⁻⁶ (/m2), regardless of the order in which the loads are applied. Crack Growth Model with Sinusoidal Loading Repeated periodic loading over a relatively long period of time T gives π
I t = CY n A nT /(2π ) ∫ (sin θ ) n dθ 0
(9)
Hence, for A = 10 MPa and T = 106 sec (277.8 hours), It = 223.4 x 1027. For failures in response to the repetitive cyclic loading, the critical stress may be taken equal to the stress amplitude and the corresponding critical flaw size is 7.697 mm. Furthermore, setting Ia equal to It with acrit equal to 7.697 mm yields (after eqn 4) a* = 2.268 mm and the corresponding initial flaw strength is σ* = 18.42 MPa. Accordingly, the density of critical flaws associated with the repetitive low-stress cycles alone is (after eqn 6) 8.97 x 10⁻⁶ (/m2). For a single (peak) load cycle, it is necessary to determine the critical unloading point at which the rate of crack growth for a critical crack is overtaken by the rate of increase of the critical crack size (related to the rate of decrease of the applied stress). In accordance with eqn 3, the rate of growth of a critical crack is CKIcn = 10.73 mm/s (regardless of the critical crack size). The rate of increase of the critical crack size during unloading is a' c (σ ) = −2( K Ic / Y ) 2 (ω cos ωt ) /( A 2 sin 3 ωt )
(10)
Equating the rate of increase of the critical crack size with the rate of growth of a critical crack, gives a critical angle θcrit = (ωt)crit = 0.5431 π, and therefore the stresses applied during the peak load cycle up to the critical point give (after eqn 5)
Reid
4
ϑcrit
I t = CY n A n ∫
0
(sin θ ) n dθ / ω = 299.0 × 10 30
(11)
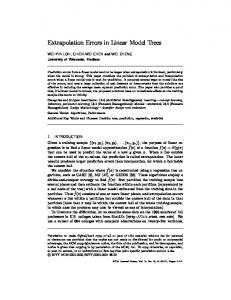
At the critical point, the critical stress is σcrit = 24.77 MPa and the corresponding critical flaw size is acrit = 1.254 mm. Furthermore, crack growth to that point (equating Ia and It) would be sufficient to propagate a crack to critical size from an original size of a* =1.159 mm with a corresponding initial flaw strength σ* = 25.77 MPa. Accordingly, the density of critical flaws associated with the peak stress cycle alone is 153.3 x 10⁻⁶ (/m2). If the peak stress cycle is applied after the repeated low-stress cyclic loading described above, the applied stress history up to the critical point in the peak stress cycle (as above) yields It = 299.23 x 1030. Hence the critical flaw has an original size and strength almost the same as for the peak stress cycle alone, and the corresponding density of critical flaws is 153.4 x 10⁻⁶ (/m2). On the other hand, if the repeated low-stress cyclic loading is applied after the peak stress cycle, the complete stress history up to the end of cyclic loading gives It = 397.1 x 1030. The critical stress for the cyclic loading is 10 MPa so that the critical final flaw size is 7.697 mm (as above). This correspond to an initial flaw size a* =1.183 mm which is greater than the critical flaw size for the original peak stress cycle. Accordingly, flaws that are sufficiently small to survive the peak load cycle cannot be subsequently propagated to a critical size during the repeated cyclic loading. The density of the critical flaws is therefore the same as for the peak stress load cycle alone. Comparison of Model Results The results obtained from the Failure Prediction Model (FPM) and the Crack Growth Model (CGM) are summarised in Table 1. By comparison with the crack growth model with n=25 (as described above) the failure prediction model underestimates the effect of a peak load cycle and greatly overestimates the effect of repeated low-stress cycles. Also the failure prediction model does not account for the order in which the peak stress and low stress cycles are applied. Of course, the relative effects of the peak stress and low-stress cycles depend on the exponent n = 25 in the crack growth model and the corresponding exponent of 16 in the failure prediction model. In order to provide a comparison between models using equivalent exponent values, results have also been obtained for a crack growth model with n = 16, as shown in Table 1. Using equivalent exponents, the relative values of the critical flaw densities for the peak stress and low-stress cycles show reasonable agreement, but the critical flaw densities obtained from the crack growth model are an order of magnitude greater than the critical flaw densities according to the failure prediction model.
Reid
5
Critical flaw density (/m2)
Model Type Peak stress cycle
low-stress cycles
low-stress cycles then peak stress
peak stress then lowstress cycles
FPM
55.2 x 10⁻⁶
84.8 x 10⁻⁶
105.1 x 10⁻⁶
105.1 x 10⁻⁶
CGM (n=25)
153.3 x 10⁻⁶
8.97 x 10⁻⁶
153.4 x 10⁻⁶
153.3 x 10⁻⁶
CGM (n=16)
653.0 x 10⁻⁶
816.3 x 10⁻⁶
1,090 x 10-6
1,012 x 10-6
Table 1: Critical flaw density according to the Failure Prediction Model (FPM) and the Crack Growth Model (n=25 and n=16)
Conclusions The failure prediction model of glass strength is fundamentally flawed and unrealistic because it implies that the probability of failure is effectively independent of the load at the time of failure. A more realistic crack growth model of glass strength has been described and compared with the failure prediction model, with regard to the effects of repeated low-stress cyclic loading and a peak stress cycle (representative of wind loading). It has been shown that there are significant differences between the results obtained from the failure prediction model and the results obtained from ‘equivalent’ crack growth models. The results are qualitatively different with regard to the relative impact of low-stress and peak-stress load cycles and the influence of the loading sequence. Moreover, the failure prediction model underestimates the probability of failure due to peak dynamic loads. Hence it is concluded that the modelling uncertainty associated with the failure prediction model is large, and the failure prediction model does not provide a dependable basis for assessing the effects of dynamic wind loading. References Beason, W.L. (1980), "A Failure Prediction Model for Window Glass", Research Report, Institute for Disaster research, Texas Tech University, Lubbock, Texas, USA, May. Beason, W.L., and J.R. Morgan (1984), "Glass Failure Prediction Model", Journal of Structural Engineering, ASCE, 110 (2), 197-212. Reid, S.G. (1984), "Cumulative Damage from Wind Loads on Glass", Workshop on Wind Engineering and Industrial Aerodynamics, CSIRO, Highett, Vic, Australia, July 1984. Proceedings, 39-41. Reid, S.G. (1991), "Flaws in the Failure Prediction Model of Glass Strength", Sixth International Conference on Applications of Statistics and Probability in Civil Engineering (ICASP6), Mexico City, Mexico, June 1991. Proceedings, 111-117.
Reid
6