4.3 Generalized predictive control . ... 4.3.2 GPC algorithm . ..... At each control interval, the MPC algorithm answers to three questions: 1. ...... Thereus a lack of sensors for key process variables 8> need to improve ...... acceleration g 3 0./ m/s&) ...
Model Predictive Control and State Estimation Enso Ikonen Jan 2013
ii
Contents I
Model Predictive Control (MPC)
1
1 Dynamic Matrix Control (DMC) 1.1 Introduction to MPC . . . . . . . . . . . . . . . 1.2 Simple LTI models . . . . . . . . . . . . . . . . 1.2.1 About notation . . . . . . . . . . . . . . 1.2.2 Finite Impulse Response . . . . . . . . . 1.2.3 Finite Step Response . . . . . . . . . . . 1.2.4 Relation between FIR and FSR . . . . . 1.3 Prediction models . . . . . . . . . . . . . . . . 1.3.1 Output prediction . . . . . . . . . . . . 1.3.2 Free response recursion . . . . . . . . . 1.4 Prediction model for a plant with disturbances 1.4.1 Output prediction . . . . . . . . . . . . 1.4.2 Free response . . . . . . . . . . . . . . . 1.4.3 Control horizon . . . . . . . . . . . . . . 1.5 Optimization . . . . . . . . . . . . . . . . . . . 1.6 DMC algorithm . . . . . . . . . . . . . . . . . . 1.6.1 O¤-line . . . . . . . . . . . . . . . . . . 1.6.2 On-line . . . . . . . . . . . . . . . . . . 1.7 Exercises . . . . . . . . . . . . . . . . . . . . . 1.8 Advanced Process Control and Industrial MPC 1.8.1 History of MPC . . . . . . . . . . . . . 1.8.2 Pros, cons and challenges . . . . . . . .
. . . . . . . . . . . . . . . . . . . . .
. . . . . . . . . . . . . . . . . . . . .
. . . . . . . . . . . . . . . . . . . . .
. . . . . . . . . . . . . . . . . . . . .
. . . . . . . . . . . . . . . . . . . . .
. . . . . . . . . . . . . . . . . . . . .
. . . . . . . . . . . . . . . . . . . . .
. . . . . . . . . . . . . . . . . . . . .
. . . . . . . . . . . . . . . . . . . . .
. . . . . . . . . . . . . . . . . . . . .
3 3 5 5 6 7 9 9 9 11 12 12 15 17 19 20 20 20 21 22 24 25
2 Quadratic DMC (QDMC) 2.1 Input-output constraints . . . . . . . . . . . 2.1.1 Constraints in change of MV . . . . 2.1.2 Constraints in MV . . . . . . . . . . 2.1.3 Constraints in output . . . . . . . . 2.1.4 Combination of constraints . . . . . 2.2 Optimization . . . . . . . . . . . . . . . . . 2.2.1 Control problem as QP . . . . . . . 2.2.2 *Quadratic programming algorithms 2.3 QDMC algorithm . . . . . . . . . . . . . . .
. . . . . . . . .
. . . . . . . . .
. . . . . . . . .
. . . . . . . . .
. . . . . . . . .
. . . . . . . . .
. . . . . . . . .
. . . . . . . . .
. . . . . . . . .
. . . . . . . . .
27 27 27 28 29 30 31 32 33 33
iii
. . . . . . . . .
. . . . . . . . .
iv
CONTENTS 2.3.1 O¤-line . . . . . . . . . 2.3.2 On-line . . . . . . . . . 2.4 Exercises . . . . . . . . . . . . 2.5 *Soft constraints . . . . . . . . 2.6 Multivariable DMC and QDMC 2.7 Integrating processes . . . . . . 2.7.1 *Constraints . . . . . . 2.8 *Identi…cation of FSR models . 2.9 Conclusions: DMC and QDMC 2.10 Homework - DMC/QDCM . . .
. . . . . . . . . .
. . . . . . . . . .
. . . . . . . . . .
. . . . . . . . . .
. . . . . . . . . .
. . . . . . . . . .
. . . . . . . . . .
. . . . . . . . . .
. . . . . . . . . .
. . . . . . . . . .
. . . . . . . . . .
. . . . . . . . . .
. . . . . . . . . .
. . . . . . . . . .
. . . . . . . . . .
. . . . . . . . . .
. . . . . . . . . .
. . . . . . . . . .
. . . . . . . . . .
33 34 35 35 37 38 39 40 41 42
3 DMC/QDMC power plant case study 43 3.1 Review of homeworks . . . . . . . . . . . . . . . . . . . . . . . . 43 3.2 Guided exercise / power plant case study . . . . . . . . . . . . . 43 4 Generalized Predictive Control (GPC) 4.1 Predictive control with a state-space model . . . . 4.1.1 Plant and model . . . . . . . . . . . . . . . 4.1.2 Objectives of control . . . . . . . . . . . . . 4.1.3 i-step ahead predictions . . . . . . . . . . . 4.1.4 LQ algorithm . . . . . . . . . . . . . . . . . 4.1.5 Exercises . . . . . . . . . . . . . . . . . . . 4.2 Short (re)cap on stochastic systems and predictors 4.2.1 On stochastic systems (in Finnish) . . . . . 4.2.2 *Optimal predictor for a regression model . 4.2.3 *Identi…cation of plant models . . . . . . . 4.2.4 *On time-series models . . . . . . . . . . . 4.2.5 The ARIMAX model . . . . . . . . . . . . . 4.3 Generalized predictive control . . . . . . . . . . . . 4.3.1 i -step-ahead predictions . . . . . . . . . . . 4.3.2 GPC algorithm . . . . . . . . . . . . . . . . 4.3.3 Remarks . . . . . . . . . . . . . . . . . . . . 4.4 Simulation example . . . . . . . . . . . . . . . . . . 4.5 Exercises . . . . . . . . . . . . . . . . . . . . . . . 4.6 Homework - GPC . . . . . . . . . . . . . . . . . . .
II
. . . . . . . . . . . . . . . . . . .
. . . . . . . . . . . . . . . . . . .
. . . . . . . . . . . . . . . . . . .
. . . . . . . . . . . . . . . . . . .
. . . . . . . . . . . . . . . . . . .
. . . . . . . . . . . . . . . . . . .
. . . . . . . . . . . . . . . . . . .
. . . . . . . . . . . . . . . . . . .
State Estimation
5 Bayesian reasoning 5.1 Bayes’rule . . . . . . . . . . . . . . . . 5.2 Bayesian state estimation . . . . . . . . 5.3 Exercises . . . . . . . . . . . . . . . . . 5.4 Approaches to Bayesian state estimation 5.4.1 Particle …lters . . . . . . . . . . . 5.4.2 Kalman …lter . . . . . . . . . . .
45 45 46 47 47 48 49 49 49 51 53 53 55 56 57 59 59 62 63 65
67 . . . . . . . . . . . . . . . . . . –in brief . . . . . . . . . . . .
. . . . . .
. . . . . .
. . . . . .
. . . . . .
. . . . . .
. . . . . .
. . . . . .
. . . . . .
69 69 71 73 74 74 75
CONTENTS 5.4.3 5.4.4
v Extended Kalman …lter (EKF) . . . . . . . . . . . . . . . Approximate grid-based …lters . . . . . . . . . . . . . . .
6 Kalman Filtering (KF) 6.1 Kalman …lter . . . . . . . . . . . . . . . . . . 6.1.1 Time update . . . . . . . . . . . . . . 6.1.2 Measurement update . . . . . . . . . . 6.2 Kalman-…lter algorithm . . . . . . . . . . . . 6.3 Estimation of a falling object . . . . . . . . . 6.4 Exercises . . . . . . . . . . . . . . . . . . . . 6.5 Homework - Kalman …lter . . . . . . . . . . . 6.6 Kalman …lter in parameter estimation . . . . 6.6.1 *Parameter estimation in time-varying
. . . . . . . . . . . . . . . . . . . . . . . . . . . . . . . . . . . . . . . . systems
7 Particle Filtering (PF) 7.1 Basic particle …lter . . . . . . . . . . . . . . . . . . 7.1.1 Monte Carlo integration . . . . . . . . . . . 7.1.2 Sampling Importance Resampling (SIR) . . 7.1.3 *Clarifying examples . . . . . . . . . . . . . 7.2 Estimation of a falling object (cont’d) . . . . . . . 7.3 Exercises . . . . . . . . . . . . . . . . . . . . . . . 7.4 Impoverishment and degeneration . . . . . . . . . . 7.5 Empirical distributions . . . . . . . . . . . . . . . . 7.6 *Sequential Importance Sampling (SIS) . . . . . . 7.7 Remarks . . . . . . . . . . . . . . . . . . . . . . . . 7.7.1 *Systematic resampling . . . . . . . . . . . 7.7.2 Computational cost and number of particles 7.8 Homework . . . . . . . . . . . . . . . . . . . . . . .
III
. . . . . . . . . . . . .
. . . . . . . . . . . . .
. . . . . . . . .
. . . . . . . . .
. . . . . . . . .
. . . . . . . . .
. . . . . . . . .
. . . . . . . . .
79 79 80 81 84 85 88 89 89 90
. . . . . . . . . . . . .
. . . . . . . . . . . . .
. . . . . . . . . . . . .
. . . . . . . . . . . . .
. . . . . . . . . . . . .
. . . . . . . . . . . . .
91 91 92 93 94 95 97 97 98 99 101 101 101 102
Markov Decision Processes (MDP)
8 Introduction to MDP 8.1 Bellman’s optimality principle . . . . . . 8.1.1 Deterministic problems . . . . . 8.1.2 Stochastic problems . . . . . . . 8.1.3 Transition matrix . . . . . . . . . 8.1.4 Random contributions . . . . . . 8.2 Finite horizon problems . . . . . . . . . 8.2.1 Backward dynamic programming 8.2.2 Exercises . . . . . . . . . . . . . 8.3 In…nite horizon problems . . . . . . . . 8.3.1 Value iteration . . . . . . . . . . 8.3.2 Exercises . . . . . . . . . . . . . 8.4 Homework - MDP . . . . . . . . . . . .
. . . . . . . . . . . .
. . . . . . . . . . . .
. . . . . . . . . . . .
76 76
103 . . . . . . . . . . . .
. . . . . . . . . . . .
. . . . . . . . . . . .
. . . . . . . . . . . .
. . . . . . . . . . . .
. . . . . . . . . . . .
. . . . . . . . . . . .
. . . . . . . . . . . .
. . . . . . . . . . . .
. . . . . . . . . . . .
. . . . . . . . . . . .
105 106 106 107 108 109 110 110 111 111 111 113 113
vi 9 Analysis and state estimation 9.1 Some basics on Markov chains . . 9.1.1 *Terminology and basics . 9.2 Analysis of CFMC . . . . . . . . 9.2.1 Evolution of system states 9.2.2 Characterization of cells . 9.2.3 System dynamics . . . . . 9.3 State estimation . . . . . . . . .
CONTENTS
. . . . . . .
. . . . . . .
. . . . . . .
. . . . . . .
. . . . . . .
. . . . . . .
. . . . . . .
. . . . . . .
. . . . . . .
. . . . . . .
. . . . . . .
. . . . . . .
. . . . . . .
. . . . . . .
. . . . . . .
. . . . . . .
. . . . . . .
. . . . . . .
115 117 118 119 119 121 123 124
Preface This material is intended for two courses at the Systems Engineering Laboratory, University of Oulu: A M.Sc course entitled "Advanced Control and Systems Engineering" (477607S). This course consists of ten lessons of lectures and exercises (à 5 hours per week), three evaluated home works, and an exam at the end of the course. A Ph.D. course entitled "Model Predictive Control and State Estimation". This is a one week intensive course consisting of 3+4 hours of lectures and exercises per day. As such, the material is suitable for last year students of process automation, process control, or similar. It can also serve as basic material for a doctoral course on predictive control and state estimation, supplemented with reviews of original scienti…c publications and/or extended simulation works with a public presentation or a written report (replacing a written exam). The material is organized in three parts. First part focuses on Model Predictive Control (MPC) based on Linear Time-Invariant (LTI) systems. In particular, the Dynamic Matirx Control (DMC) approach without and with input-output constraints is considered in detail. This is followed by the Generalized Predictive Control (GPC) using LTI state space models. As the GPC uses stochastic time-series models, some basic mathematics of stochastic systems and predictions are reviewed. The second part focuses on state estimation, introducing the Kalman Filter (KF) and Particle Filter (PF). Also state estimation with …nite state models is brie‡y considered. The Bayesian approach is emphasized, so an introduction to Bayes’rule starts the second part. The third part returns to MPC, extending to uncertain nonlinear systems with Markov Decision Processes (MDP): the Controlled Finite Markov Chain (CFMC) models combined with Dynamic Programming (DP) optimization techniques. vii
viii
CONTENTS
The M.Sc. level course focuses on MPC (4 weeks of 10) and Kalman …ltering (2 weeks), with less emphasis on particle …lters and MDP. For a post graduate course it is reasonable to assume that basic knowledge on MPC exists already, so the weights between di¤erent parts could be one day for each: MPC, KF, PF and MDP, and the last of the …ve days spent with application examples. The material was compiled based on a number of sources. The DMC material is largely based on the presentation given by professor Javier Sanchis Sáez (UPV/CPOH), given at Oulanka in fall 2011. The power plant case exercises were prepared by Laura Lohiniva and Antti Yli-Korpela (Univ. Oulu, syte). The section on GPC is based on Chapter 7 of the book by Ikonen and Najim (2002). The text on Bayes reasoning uses some idea from www-pages of Yudkowsky. I’ve lost the track of the original source for the particular way of presenting the Kalman …lter (if you recognize it, do let me know! Hopefully the text did not su¤er too much from translation into Finnish and then back to English..), but many similar presentations exist in the literature. The Kalman …lter example of a free falling object is borrowed loosely from a pdf by Kleeman available at the Internet. The material on particle …lters is largely based on the manuscripts by Salmond and Gordon (2005), Arulampalam et al. (2002) and Cappé et al. (2007). In basics of Markov decision processes the text relies much on Chapter 3 in Powell (2007), Grinstead and Snell (2006, Ch 11), wikipedia, and the nicest of books by Kemeny and Snell (from 1960). The written material is accompanied with additional coding and computing exercises and home works. Matlab examples and guided exercises are given during the lessons. It is assumed/required that the students have basic skills of coding and simulating closed loop systems with Matlab. Matlab 6 can be provided by the Systems Engineering Laboratory for educational purposes, more recent versions of Matlab are also be used. The lessons are further supported by a set of presentation slides, with complementary …gures and examples. How to complete the course 477607S To complete the M.Sc. course at University of Oulu, a su¢ cient number of points needs to be cumulated in a written examination. Additional points can be obtained from homeworks. The course evaluation (grade) will be determined by the accumulated amount of collected points. A written examination will contain six questions, each worth max. 5 points. Half of the questions will focus on general outlines ("explain, discuss, ...") and half on mathematical derivations/calculation exercises.("show, derive, design, ..."). The maximum amount of points from the written examination is 30 points. The homework topics are given after lectures 2 (QDMC), 4 (GPC), 6 (Kalman …lter) and 8 (MDP); and the outcomes are reviewed at lectures 3, 5, 7 and 9, respectively. The homeworks focus on Matlab-coding of the algorithms, and their evaluation by simulations. Homeworks can be prepared in groups of 1-2 students. The works are to be returned strictly
CONTENTS
ix
according to the given schedule. The homework outcomes are evaluated based on a written document of few pages + short live presentation during the lessons with all group members present. Max 5 points can be obtained for max 3 of the homeworks, resulting in a total max 15 points available from the homeworks. To pass the course, at least 12 points from the written examination need to be obtained. The course grade is obtained by summing together the points from the written examination and the homeworks: 1/12p, 2/14p, 3/17p, 4/22p, 5/30p. Homeworks can only be returned during the course. Homework points will remain valid until the next years course exam. Any extra points from previous ACSE courses before 2012 (literature reviews or simulations) remain valid as agreed at the time of granting. The course www-pages are available at http://cc.oulu.…/~iko/SSKM.htm.
Enso Ikonen in Oulu, 29 May 2012. (Enso.Ikonen@oulu.…)
x
CONTENTS
Part I
Model Predictive Control (MPC)
1
Chapter 1
Dynamic Matrix Control (DMC) Chapter 1 introduces the unconstrained Dynamic Matrix Control (DMC). We start with simple linear models. Sections 1.3 and 1.4 make use of these models in deriving predictions of future plant outputs. The predictions are then used by the optimizer to …nd the proper plant control inputs. Section 1.6 gives the DMC algorithm. The chapter is terminated by drafting the role of DMC and also other approaches for model predictive control (MPC) in the palette of advanced process control methods.
1.1
Introduction to MPC
At each control interval, the MPC algorithm answers to three questions: 1. Update: Where is the process going? 2. Target: Where should the process go? 3. Control: How to get there? Basic components of the MPC methodology include the following: Digital algorithm = Software implemented on a computer; Model-based approach = Control is based on a dynamic process model; Predictive approach = Future behaviour of the plant is predictied in a future time window (prediction horizon) using the dynamic model; Optimal control = Goals of process control are expressed as a cost function to be optimized (minimized); 3
4
CHAPTER 1. DYNAMIC MATRIX CONTROL (DMC) On-line optimization = At each sample time, a seach for a sequence of future Manipulated Variables (MV’s) is conducted (i.e., minimization of cost function, with or without constraints); Receeding horizon = Only the …rst element of the control sequence is applied to control the process, the whole optimization procedure is repeated at next sampling instant. In general, MPC is not an explicit control law but a control philosophy. A classical cost function looks as follows: J=
p X
y ref (k + i)
i=1
where
yb (k + i)
2
+r
c 1 X
2
u (k + i)
i=0
k is the sampling instant, k 2 Z, which relates to real time t via t = kTs where Ts is the sampling time; y ref (k) is a future reference (set point) at instant k; yb (k) is prediction of future plant output at instant k; u (k) is control move at instant k,
u (k) = u (k)
u (k
1);
p is the prediction horizon, c is the control horizon, specifying the number of terms in future that are taken into account when computing the cost function; r is a weighting factor, i.e. the ratio of importance between costs due to deviation from desired output and costs due to control moves. Minimization of the classical cost function results in a classical optimization problem, subject to constraints in the system output, manipulated variable and change of manipulated variable: min J u
ymin umin umin where
< y < ymax < u < umax < u < umax
u is a sequence of future control moves in the control horizon.
1.2. SIMPLE LTI MODELS
1.2
5
Simple LTI models
1.2.1
About notation
Before starting, a few words about notation are in place. In general the following conventions are used variables in italic, x, denote scalar variables; variables in bold, x, denote vectors; variables in bold capital letters, X, denote matrices; arguments in parentheses, e.g., x (k) relates the variable x with a sampling instant k; additional (non-italic) sub- or superscripts, e.g., p in y p , denote a di¤erent variable (i.e., y is not the same variable as y p ). Special care should be used with the various out…ts of variable general:
u. In
u is a vector of future changes in the manipulated variable; u is a scalar component of the vector u (k) is the vector
u;
u at instant k,
u (k) = [ u (k) ; u (k + 1) ; :::; u (k + c u (k) is a scalar component of vector
T
1)]
u (k);
u (k + ijk) is the k + i’th element of vector information available at instant k;
u, computed based on
The choice of notation depends on the occasion. When there is no ambiguity, the simplest possible notation is used. Two types of vector notations are in use: T
x = [x (1) ; x (2) ; :::; x (n)] or x = denote a n 1 column vector;
x (1) x (2)
x (n)
T
. Both
Operations between scalars and vectors/matrices are allowed: in x + y the scalar y is added to each of the components of x element-wise. The same applies for multiplication and subtraction operations. Some common short hand notations are being used MV denotes the Manipulated Variable, i.e. the control variable (controller output, plant input); CV denotes the Controlled Variable (plant output); sp denotes the setpoint, a reference trajectory de…ned as a constant.
6
CHAPTER 1. DYNAMIC MATRIX CONTROL (DMC)
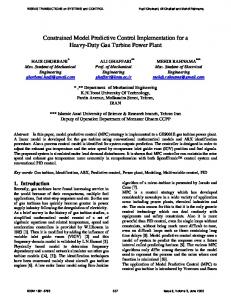
Figure 1.1: Impulse response.
1.2.2
Finite Impulse Response
For an impulse input T
u = [1; 0; 0; :::; 0] i.e. u (0) = 1; u (j) = 0 for 8j 6= 0 the system output is given by T
y = [0; h (1) ; h (2) ; h (3) ; :::; h (n) ; 0; 0; :::] Figure 1.1 illustrates an impulse response. The Finite Impuse Response (FIR) h is given by T
h = [h (1) ; h (2) ; h (3) ; :::; h (n)] It is assumed that
the system does not react instantenously to the input (digital systems), h (0) = 0 the system transient ends after n instants, h (n + k) = 0 for k > 0. The dynamics of the system can be fully described with the coe¢ cients of the FIR model. Any input T u = [u (0) ; u (1) ; u (2) ; u (3) :::] can be seen as an addition of impulses T
u = [1; 0; 0; 0; :::]
u (0)
T
u (1)
T
u (2)
+ [0; 1; 0; 0:::] + [0; 0; 1; 0:::] +:::
1.2. SIMPLE LTI MODELS
7
Consequently, the system output T
y = [y (0) ; y (1) ; y (2) ; y (3) :::] can be obtained as y
=
T
[0; h (1) ; h (2) ; h (3) ; :::; h (n) ; 0; 0; 0; :::] + [0; 0; h (1) ; h (2) ; :::; h (n
u (0) T
1) ; h (n) ; 0; 0; :::]
u (1) T
+ [0; 0; 0; h (1) ; :::; h (n 2) ; h (n 1) ; h (n) ; 0; :::] +::: 2 3 2 y (0) 0 6 y (1) 7 6 h (1) u (0) 6 7 6 6 y (2) 7 6 h (2) u (0) + h (1) u (1) 6 7=6 6 y (3) 7 6 h (3) u (0) + h (2) u (1) + h (1) u (2) 4 5 4 .. .. . .
For the k’th output, we can write
y (k) =
n X
h (i) u (k
u (2)
3 7 7 7 7 7 5
i)
i=1
For calculating the k’th output, n past inputs are needed (signals with negative time are taken to be zeros). The impulse response coe¢ cient h (i) shows how the input applied i instants ago in‡uences the current output, at instant k. If the process input is an impulse, the sampled process output directly represents the coe¢ cients h (i) of the FIR model.
1.2.3
Finite Step Response
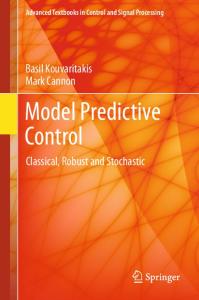
For a unitary step input T
u = [1; 1; 1; :::; 1] i.e. u (j)
1 for 8j 0 0 for 8j < 0
the system output is given by h Xn y = 0; h (1) ; h (1) + h (2) ; h (1) + h (2) + h (3) ; :::;
i=1
=
T
[0; s (1) ; s (2) ; s (3) ; :::; s (n) ; s (n) ; :::]
Figure 1.2 illustrates a step response. The Finite Step Response (FSR) s is de…ned by T
s = [s (1) ; s (2) ; s (3) ; :::; s (n)] : It is assumed that
h (i) ;
Xn
i=1
iT h (i) ; :::
8
CHAPTER 1. DYNAMIC MATRIX CONTROL (DMC)
Figure 1.2: Step response.
the system does not react instantenously to the input (digital systems), s (0) = 0 the system transient ends after n instants, s (n + 1) = s (n + 2) = ::: = s (1). The dynamics of the system can be fully described by just having the coe¢ cients of the FSR model. Any input T
u = [u (0) ; u (1) ; u (2) ; u (3) :::] can be rewritten as an addition of steps u =
T
[1; 1; 1; 1; :::]
u (0) T
(u (1)
u (0))
T
(u (2)
u (1))
+ [0; 1; 1; 1; :::] + [0; 0; 1; 1; :::] +::: De…ne
u (k) = u (k) y
u (k
1). The system output can be obtained as T
=
[y (0) ; y (1) ; y (2) ; y (3) ; :::]
=
[0; s (1) ; s (2) ; s (3) ; :::; s (n) ; s (n) ; s (n) ; :::]
T
+ [0; 0; s (1) ; s (2) ; :::; s (n + [0; 0; 0; s (1) ; :::; s (n +:::
u (0) T
u (1)
T
u (2)
1) ; s (n) ; s (n) ; :::]
2) ; s (n
1) ; s (n) ; :::]
1.3. PREDICTION MODELS 2
y (0) y (1) y (2) y (3) .. .
6 6 6 6 6 6 6 6 6 6 y (n) 4 .. .
3
2
9
0 s (1) u (0) s (2) u (0) + s (1) u (1) s (3) u (0) + s (2) u (1) + s (1) u (2) .. .
7 6 7 6 7 6 7 6 7 6 7=6 7 6 7 6 7 6 7 6 s (n) u (0) + s (n 5 4
1) u (1) + ::: + s (1) u (n .. .
For the k’th output, we can write y (k)
=
1 X
s (i) u (k
3
7 7 7 7 7 7 7 7 7 1) 7 5
i)
i=1
= s (n) u (k
n) +
n X1
s (i) u (k
i) :
(1.1)
i=1
If the process input is a unit step, the sampled process output directly represents the coe¢ cients s (i) of the FSR model.
1.2.4
Relation between FIR and FSR
The FIR and FSR models with coe¢ cient vectors h and s, respectively, are related by s (k)
=
k X
h (i)
i=1
h (k)
1.3
= s (k)
s (k
1) :
Prediction models
It is convenient to see multiple step ahead predictions to consist of a free response and a forced response part. Output predictions = Free response predictions + Forced reponse predictions Free reponse is the system response assuming that the current and future input changes are zero, u (k) = u (k + 1) = : : : = 0. The forced reponse is the system response due to the changes in current and future inputs.
1.3.1
Output prediction
Multiple step ahead predictions for step response models can be obtained by writing out the individual predictions y (kjk), y (k + 1jk), . . . . The notation x (ijk) is a short hand notation for the value of variable x at instant i, given the information up to and including instant k. In the following the signi…cance of
10
CHAPTER 1. DYNAMIC MATRIX CONTROL (DMC)
this notation comes from u (ijk) which denotes the control change at (future) instant i k, as determined at the current instant k. The control actions before k have already taken place and are therefore known, hence they are noted simply by u (k 1), u (k 2), etc. Using (1.1) for the FSR model, we have the following development: y (kjk)
=
n X1
s (i) u (k
i) + s (n) u (k
i=1
y (k + 1jk)
=
|
{z
}
f (kjk)
n X1
n)
s (i) u (k + 1
i) + s (n) u (k + 1
n)
s (i) u (k + 1
i) + s (n) u (k + 1
n) + s (1) u (kjk)
i=1
=
n X1 i=2
y (k + 2jk)
=
|
{z
}
f (k+1jk)
n X1
s (i) u (k + 2
i) + s (n) u (k + 2
n)
i) + s (n) u (k + 2
n)
i=1
=
n X1
s (i) u (k + 1
i=3
|
{z
f (k+2jk)
+s (1) u (k + 1jk) + s (2) u (kjk) .. .
y (k + n
1jk)
=
n X1
s (i) u (k + n
1
i) + s (n) u (k
} (1.2) 1)
i=1
= s (n) u (k | {z
1) + }
f (k+n 1jk)
y (k + njk)
=
n X1
n X1
s (i) u (k
i+n
1jk)
i=1
s (i) u (k + n
i) + s (n) u (k)
i=1
= s (n) u (k | {z
f (k+njk)
1) + }
n X
s (i) u (k
i + njk)
i=1
In the right hand side expressions, the …rst term is the free response f (a function of the past inputs). The second term is the forced response (a function of the current or future changes in the input variable. Let vector f collect the predictions of the free response at instant k: f (k) = [f (kjk) ; f (k + 1jk) ; f (k + 2jk) ; :::; f (k + n
T
1jk)]
(1.3)
1.3. PREDICTION MODELS If u (k + j) = 0 for 8j f (k + ijk) = y (k + i).
11 0, the free response equals the system response,
From instant k+n 1 forwards the free response is a constant: f (k + n + jjk) = f (k + n 1jk) for 8j 0. The multiple step ahead development can be written as y (kjk) = f (kjk) y (k + 1jk) = f (k + 1jk) + s (1) u (kjk) y (k + 2jk) = f (k + 2jk) + s (1) u (k + 1jk) + s (2) u (kjk) y (k + 3jk) = f (k + 3jk) + s (1) u (k + 2jk) + s (2) u (k + 1jk) + s (3) u (kjk) .. . where in the right hand expression the …rst term is the free response and the remaining terms make the forced response. The above can be expressed in a matrix form 2 3 2 3 f (k + 1jk) y (k + 1jk) 6 y (k + 2jk) 7 6 f (k + 2jk) 7 6 7 6 7 7 6 7 = 6 .. .. 4 5 4 5 . . f (k + njk) y (k + njk) {z } | {z } | b(k+1) y
2
f (k+1jk)
s (1)
0
6 6 s (2) s (1) +6 6 . .. . 4 . . s (n) s (n 1) | {z
..
.
..
.
0 .. .
0 s (1)
G
32 76 76 76 74 5 }|
where f (k + 1jk) is the free response prior to knowledge of
u (kjk) u (k + 1jk) .. .
u (k + n {z
u(k)
1jk)
3 7 7 7 5
u (kjk). In short
}
b (k + 1) = Mf (k) + G u (k) y
where Mf is the free response (see next subsection). G is called the dynamic matrix, which describes how the current and future input changes e¤ect the system output (recall that these were to be optimized by the controller), i.e., G u constitutes the forced response.
1.3.2
Free response recursion
A recursion can be developed for the vector f . At instant k the vector f is given by (1.3) f (k) = [f (kjk) ; f (k + 1jk) ; f (k + 2jk) ; :::; f (k + n
T
1jk)] :
12
CHAPTER 1. DYNAMIC MATRIX CONTROL (DMC)
At instant k + 1 f (k + 1) = [f (k + 1jk) ; f (k + 2jk) ; :::; f (k + n
1jk) ; f (k + n
T
1jk)] +s u (k)
where the last term f (k + n 1jk) is repeated (since the system transient is assumed to have ended after n instants) and the rightmost term is the change due to the (step) input u which was applied at instant k. Therefore, a matrix mechanization for f can be given 2 3 2 3 0 1 0 0 s (1) 6 7 . . . . .. 7 6 6 s (2) 7 0 1 6 7 6 7 6 .. 6 7 7 .. f (k + 1) = 6 . 7f (k) + 6 s (3) 7 u (k) : . 0 0 6 6 .. 7 7 6 7 4 . 5 .. 4 . 1 5 s (n) 0 1 | {z } {z } | s M
M is a diagonal matrix with ones above the main diagonal, and s is the vector of step response coe¢ cients. In short f (k + 1) = Mf (k) + s u (k) :
(1.4)
Now that we are in possession of a convenient way to predict plant future behaviour, we would be ready to start to build up a basic DMC algorithm. In fact, we could skip the next section and proceed directly to optimization (using yp = f , p = c = n). However, for practical reasons, in the next section we …rst develop a prediction model with measured and unmeasured disturbances, and with two handy parameters: the prediction horizon and the control horizon.
1.4
Prediction model for a plant with disturbances
Let us consider a control problem shown in Fig. 1.3 with a scalar manipulated variable u, a measured disturbance d, and an unmeasured disturbance w (including unmodelled dynamics, etc). Denote the (scalar) system output by y and the desired reference output by y ref .
1.4.1
Output prediction
The DMC computations for the free response f can be initiated by assuming that the system will be in a disturbanceless steady state: u (k) = u (k + 1) = ::: = 0 d (k) = d (k + 1) = ::: = 0 w (k) = w (k + 1) = ::: = 0
1.4. PREDICTION MODEL FOR A PLANT WITH DISTURBANCES
13
Figure 1.3: Block diagram of the considered DMC problem.
Let us now develop an output prediction using information up to instant k. The output is a sum of the following terms:
predicted free response, f (k + 1), as characterized in (1.2)
forced response due to the manipulated variable, Su u
forced response due to the measured disturbance, Sd d
response due to unmeasured disturbances, w
14
CHAPTER 1. DYNAMIC MATRIX CONTROL (DMC)
The p-step ahead output prediction can be written as 2 6 6 6 4
b = f (k + 1) + Su u + Sd d + w y 3 2 3 yb (k + 1jk) f (k + 1jk) 6 f (k + 2jk) 7 yb (k + 2jk) 7 7 6 7 7 = 6 7 .. .. 5 4 5 . . yb (k + pjk) f (k + pjk) 2 u s (1) 0 0 6 u .. . . 6 s (2) . su (1) . 6 +6 .. .. . .. 4 . . 0 u u s (p) s (p 1) su (1) 2 d s (1) 0 0 6 d .. . .. 6 s (2) sd (1) . +6 6 .. .. . . 4 . . . 0 sd (p) sd (p 1) sd (1) 3 2 w (k + 1jk) 6 w (k + 2jk) 7 6 7 +6 7 .. 4 5 . w (k + pjk)
(1.5) 32 76 76 76 74 5 32 76 76 76 74 5
u (kjk) u (k + 1jk) .. . u (k + p
1jk)
d (kjk) d (k + 1jk) .. . d (k + p
1jk)
The matrices Su and Sd have as many rows as there are predictions in the horizon (p). If n < p, the missing elements in the step responses su and sd are obtained by duplicating the last values su (n) and sd (n) of the corresponding FSR models (recall that the transient was assumed to have ended in n instants). The change in measured disturbance at instant k is obtained from d (kjk) = d (k) d (k 1) where d (k) is the disturbance measured at instant k. The future values for d and w are not known, so let us make the following assumptions: The measured disturbance remains constant in the future: d (k + 2) = ::: = 0.
d (k + 1) =
The unmeasured disturbance at k can be estimated from the di¤erence between predicted and measured output at instant k: w (kjk) = y (k) yb (k), where y (k) is the measured output and yb (k) = f (kjk): w (kjk) = y (k)
f (kjk)
The unmeasured disturbances remain constant in the future: w (k + 1jk) = w (k + 2jk) = ::: = w (k + pjk). The assumptions are valid if we consider that the system integrates all (measured and unmeasured) output disturbances; and that both the process output and
3 7 7 7 5
3 7 7 7 5
1.4. PREDICTION MODEL FOR A PLANT WITH DISTURBANCES
15
disturbance measurements are noiseless. The equation (1.5) simpli…es into 2 6 6 6 4
yb (k + 1jk) yb (k + 2jk) .. .
yb (k + pjk)
3
2
7 6 7 6 7 = 6 5 4
f (k + 1jk) f (k + 2jk) .. .
3 7 7 7 5
f (k + pjk) 2 u s (1) 0 6 u .. 6 s (2) . su (1) +6 6 .. .. . .. 4 . . u u s (p) s (p 1) 2 d 3 2 s (1) 1 6 sd (2) 7 6 1 6 7 6 +6 7 d (kjk) + 6 .. .. 4 5 4 . . sd (p)
d
b (k + 1) = Tf (k) + s y | {z } | | {z } prediction
past
0 .. . 0 su (1) 3
1
d (k) + (y (k) {z present
76 76 76 74 5
7 7 7 (y (k) 5
3
u (kjk) u (k + 1jk) .. . u (k + p
1jk)
7 7 7 5
f (kjk))
f (kjk)) + G u (k): } | {z }
The prediction thus consists of: a free fresponse Tf subsection that follows), a feedforward (measured (bias) terms based on the present system status, actions to the plant G u (to be determined in the
1.4.2
32
(1.6)
future
due to past system life (see disturbance) and feedback and a term due to future optimization).
Free response
In the past notation, the free response f was a column vector of n elements, see (1.3). However, a p-step ahead prediction was to be determined. Therefore equation (1.6) introduced a matrix T of size p n. This matrix depends on the number of output predictions p:
if p > n, T displaces f and repeats the last element a su¢ cient number of times
if p = n, T displaces f and repeats the last element
if p < n, T displaces f , and cuts it to have p elements, only.
16
CHAPTER 1. DYNAMIC MATRIX CONTROL (DMC)
2
6 6 6 6 6 6 T = 6 6 6 6 6 6 4 2
6 6 6 6 6 T = 6 6 6 6 4 2
6 6 6 6 T = 6 6 6 4
0
1
0
0 .. .
0
1
..
.
0
..
.
0
0 .. .
..
.
1 0 .. .
0 1 .. .
0
1
0 0 .. .
0
0 0 0 .. .
1 0
0
0
1
..
.
0
..
.
0
..
.
1 0 0
0 0 0 0
1
0
0 .. .
0
1
..
.
0
..
.
0
..
.
1 0
0 0
3 7 7 7 7 7 7 7 7 7 7 7 7 5
(1.7)
p n p>n
3
7 7 7 7 7 7 7 0 7 7 1 5 1 p
0 .. .
(1.8)
n p=n
0
0
7 7 7 7 7 7 7 0 5 0 p 0 .. .
0 1
0
3
(1.9)
n p need to simplify model development process. Controller stability and robustness are shown only by simulations => need for robust MPC with guaranteed feasibility and stability properties. There’s a lack of sensors for key process variables => need to improve state estimation. Computational complexity/load can be high => need to develop approximate solutions. It is di¢ cult to cope with uncertainties in the real world => need to create models with uncertainty information, and/or estimate parameters/states on-line and/or use robust optimization techniques. Additional future development lines include: decentralized MPC (for plant wide cooperative tasks), MPC for hybrid systems (mixing of continuous states with …nite states), ...
Finally, it is worth to note that introduction of MPC may change the scheduling of industrial control projects. With classical controls, projects start with process analysis but most of the time is spent with design and tuning of controllers. In MPC projects the availability of process knowledge becomes more important. The role of modelling and identi…cation tasks is greatly emphasized, and that of tuning is decreased.
Chapter 2
Quadratic DMC (QDMC) In real control problems very often some of the control speci…cations can be expressed as constraints: input (MV) constraints, rate-of-change ( MV) input constraints, output (CV) constraints, constraints on other outputs of interest. These type of constraints can be expressed as inequations that depend on future control moves u.
2.1
Input-output constraints
The essential idea in this section is to convert various typical constraints into LE (less than or equal) inequality constraints in u.
2.1.1
Constraints in change of MV
Consider upper and lower bound constraints on the change of the control variable u (k)
umin
umax :
These contain both a LE and a GE (greater than or equal) constraints. These can be converted into LE constraint as u u
umax umin 27
28
CHAPTER 2. QUADRATIC DMC (QDMC)
Recall that
u is a vector containing all future changes to the control variable, 2 3 u (k) 6 u (k + 1) 7 6 7 u (k) = 6 7: .. 4 5 . u (k + c
1)
The minimum and maximum are usually de…ned for all elements u (j) of this vector. In matrix form 2 3 umax;1 6 umax;2 7 6 7 2 3 6 7 .. u (k) 6 7 . 7 6 6 u (k + 1) 7 7 6 I 6 umax u 7 max;c 7 6 =6 6 7 .. 7 u u I 4 5 min min;1 7 . | {z } | {z } 6 6 7 u min;2 7 u (k + c 1) 6 A1 b1 6 7 .. | {z } 4 5 . x umin;c A1 x b1 Often the constraints on u are …xed and they do not depend on real time, or time relative in the horizon as in above. Then umax (j) = umax and umin (j) = umin for 8j.
2.1.2
Constraints in MV
Consider upper and lower bound constraints on the actual value of the manipulated variable umin u (k) umax The upper bound constraints u (k) u (k + 1)
u (k + c
1)
umax;1 umax;2 .. . umax;c
can be rewritten as
u (k + 1) +
u (k + c
1) +
+
u (k) u (k)
u (k)
umax;1 umax;2 .. . umax;c
u (k u (k
1) 1)
u (k
1)
2.1. INPUT-OUTPUT CONSTRAINTS
29
A similar development can be made with the lower bound constraint. Writing the combined results in a matrix form gives
IL IL | {z A2
2
6 6 6 4 } |
1)
x
umax;1 umax;2 .. .
6 6 6 6 6 6 umax;c 6 6 umin;1 6 6 umin;2 6 6 .. 4 . umin;c |
3
u (k) u (k + 1) .. . u (k + c {z
2
7 7 7 5 }
A2 x
3 7 7 7 7 7 7 7 7 7 7 7 7 5
b2
2 6 6 6 6 6 6 6 6 6 6 6 6 4
{z b2
1 1 .. . 1 1 1 .. . 1
3
7 7 7 7 7 7 7 u (k 7 7 7 7 7 5
1)
}
where IL is a binary lower triangular matrix: 2
1 1 .. .
6 6 6 IL = 6 6 4 1 1
2.1.3
0 1 .. .
0 0 .. . 1 1
1 1
..
.
1 1
.. . 0 1
3
7 7 7 7: 7 5
Constraints in output
Consider constraints in the output variable, ymin i.e., ymin;1 ymin;2
ymin;p
b y
ymax
yb (k + 1) yb (k + 2) .. . yb (k + p)
ymax;1 ymax;2
ymax;p
Recall that the predictions could be obtained from (1.11) b = yp + G u y
We can rewrite the constraints as LE’s
G u + yp ymax (G u + yp ) ymin
(2.1)
30
CHAPTER 2. QUADRATIC DMC (QDMC)
In matrix form:
2
6 G 6 6 G 4 | {z } A3
2.1.4
|
3
u (k) u (k + 1) .. . u (k + c {z x
1)
7 7 7 5 }
A3 x
ymax yp (k + 1) ymin + yp (k + 1) {z } | b3
b3
Combination of constraints
The three types of input–output constraints represent the most important types of constraints in the control of industrial processes. They can be merged together to make one complete constraint system:
2
A u 3
A1 4 A2 5 u A3
b 2
3 b1 4 b2 5 b3
2.2. OPTIMIZATION
31
Writing out gives: 2
2 6 6 6 6 6 6 4
I I IL IL G G
umax;1 umax;2 .. .
6 6 6 6 6 6 umax;c 6 6 umin;1 6 6 umin;2 6 .. 6 6 . 6 6 u min;c 6 6 umax;1 u (k 1) 6 6 umax;2 u (k 1) 6 6 .. 6 . 6 6 umax;c u (k 1) 6 6 umin;1 + u (k 1) 6 6 umin;2 + u (k 1) 6 6 .. 6 . 6 6 umin;c + u (k 1) 6 6 ymax;1 y p (k + 1) 6 6 ymax;2 y p (k + 2) 6 6 .. 6 . 6 6 y p 6 max;p y (k + p) 6 y p min;1 + y (k + 1) 6 6 y p min;2 + y (k + 2) 6 6 .. 4 .
3
7 7 7 7 u 7 7 5
ymin;p + y p (k + p)
A u
b
3 7 7 7 7 7 7 7 7 7 7 7 7 7 7 7 7 7 7 7 7 7 7 7 7 7 7 7 7 7 7 7 7 7 7 7 7 7 7 7 7 7 7 7 7 7 7 7 7 5
(2.2)
Observe that matrix A is the same for all control instants, and it can therefore be pre-computed o¤-line. Vector b can be di¤erent at each sample time, however.
2.2
Optimization
The control problem is now stated as follows min J u
where uT
u
subject to A u
b
J=
T
+
32
CHAPTER 2. QUADRATIC DMC (QDMC)
The constraint system A u b encompasses the input–output constraints: 8 u (k) umax < umin umin u (k) umax : b ymax ymin y
There is no analytical solution available for this problem, and it has to be solved numerically. In order to solve it, the control problem can be rewritten as a well known quadratic programming (QP) optimization problem. We can then take advantage of the numerical routines available in various software environments, such as Matlab (quadprog).
2.2.1
Control problem as QP
The quadratic programming provides means to solve convex optimization problems. If the problem is feasible (a solution exists), the QP is guaranteed to convergence and …nd a global minimum. The QP solves a problem of the form min x
1 T x Hx + cT x 2
subject to Ax
(2.3) (2.4)
b
We have already developed the constraints to the form Ax b. We still need to write the DMC cost function to the above form. Reordering terms and deleting terms which do not depend on u: J
= = = =
T
+ uT u T (G u e) (G u e) + uT u T T T T u G e (G u e) + u u uT GT G + I u | {z } H
=
T 2e | {zG}
u + eT e
(2.5)
cT
uT H u + cT u + constant
where e = y sp yp . The constant term does not in‡uence the location of the minimization problem and can be omitted. Comparing with the QP problem setup (2.3)–(2.4), the problems now have the same form (substituting u for x). The H is called the Hessian, and cT is the gradient vector H = GT G + I T cT = GT e The Hessian is a constant matrix, while the gradient vector changes at each sampling instant.
2.3. QDMC ALGORITHM
2.2.2
33
*Quadratic programming algorithms
The time execution of QP routines depends on the number of optimization variables (control horizon, c); the number of constraints: a priori 4c + 2p. QP problems can be unfeasible if there is no combination of control actions that satis…es the constraints. Standard QP routines just give up when the problem is infeasible. Consequently, in industrial on-line control applications the solution procedures need to be modi…ed so that some solution is always provided. Ad-hoc strategies include: Keep the input variable constant (apply the same input as in the past); Apply the control input tion round;
u (k + 1jk) proposed at the previous optimiza-
Use some constraint handling technique, such as ordering of constraints and relaxation of the less important ones. This will be considered in more detail in a later section.
2.3
QDMC algorithm
Let us now collect the results into a QDMC algorithm. As with DMC, the algorithm consists of two phases: an initial phase (o¤-line), and the actual controller (on-line).
2.3.1
O¤-line
To construct the QDMC controller, the following are needed as input data ( a star denotes topics additional to the DMC algorithm presented earlier): Step response model for the control variable su ; Step response model for the disturbance variable sd ; Prediction horizon p; Control horizon c; Weighting factor for control moves ; MV limits (variable and rate of change), CV limits. O¤-line computations include Computing the dynamic matrix G, eq (1.12);
34
CHAPTER 2. QUADRATIC DMC (QDMC) Constructing binary matrices M, T,and IL ; equations (1.10), (1.7)–(1.9), and (2.1); Constructing the …xed part of constraints, matrix A, equation (2.2); Computing the Hessian H, eq (2.5). Note that the H is di¤erent from the one used in DMC (1.14).
As with DMC, the recursive calculations of n 1 vector f can be initialized with T f (k) = [y0 ; y0 ; :::; y0 ] where y0 is the steady state output of the system with input u0 .
2.3.2
On-line
The following steps need to be conducted on-line in the control loop ( a star denotes topics additional to/di¤erent from DMC): 1. Obtain the output measurement y (k) and the measurement of the disturbance d (k). Compute bias b and change in disturbance d: b (k) d (k)
= y (k) = d (k)
f (kjk) d (k 1)
where f (kjk) is the …rst element in f (k). 2. Obtain the desired output setpoint y sp (k + 1). Compute the prediction yp and error e: yp (k + 1) = Tf (k) + sd d (k) + b (k) e (k + 1) = y sp (k + 1) yp (k + 1) 3. Compute the gradient vector c: c=
GT e (k + 1)
4. Compute the right-hand part of the constraints, vector b, eq. (2.2) 5. Solve the optimal future changes in the manipulated variable solving the QP problem.
u (k) by
6. Apply the …rst element u (k) of u (k) to control the process. If the actual value for the MV is needed, use u (k) = u (k 1) + u (k). 7. Compute the free response prediction (1.10) f (k + 1) = Mf (k) + su u (k) + sd d (k) 8. At next sample time, increase the sampling index k := k + 1, and goto Step 1.
2.4. EXERCISES
2.4
35
Exercises
1. Code the QDMC algorithm to Matlab. 2. Simulate the closed loop behavior of a QDCM controlled process and experiment various constraints See Ex_QDMC.m.
2.5
*Soft constraints
If there are problems in …nding a feasibile solution, one approach is to rank the constraints into hard and soft ones. Hard constraints must be accomplished. Typically these include MV constraints (e.g., valve openings or pump speeds must be between 0% and 100%), or output variables constraints which come from security considerations. Soft constraints are constraints where some violation can be tolerated, but only if really necessary. These may include CV constraints where operation limits are ‡exible and conservative. Soft constraints provide a mechanism to avoid unfeasibility in QP. The optimizer …nds a solution subject to hard contraints and with minimum violation of soft constraints. In QP with soft constraints, the optimization problem is extended with new slack variables. In general, there is one slack variable for each output variable (this ensures that a feasible solution will always be found). In what follows, the SISO case is considered for simplicity. A slack variable is de…ned such that it is non-zero only if a constraint is violated. It is incorporated in the cost function, with a strong penalization: J=
T
+
uT
u + "T "
subject to hard constraints, and ymin
" "
b y 0
ymax + "
The problem with the new cost function can be rewritten as a standard QP problem. The minimum of the cost function J
= T + uT u + "T " T = (G u e) (G u e) + uT u + "T " = uT GT G + u 2eT G u+ |{z} eT e + " T " constant
36
CHAPTER 2. QUADRATIC DMC (QDMC)
is at the same location as the minimum of J0
= =
1 uT GT G + u 2 T 1 u GT G + 0 " 2 | {z }| {z
GT e 0 {z
x
H
xT
=
1 eT G u+ "T " 2 0 u + " }| {z } |
1 T x Hx + cT x 2
cT
T
u " }| {z } x
The cost function is now in the QP form. We still need to reformulate the soft output constraints b y 0
" "
ymin
ymax + "
They can be rewritten as a set of LE constraints ymin
G u + yp ymax + " G u + yp ymax + " G u yp ymin + "
"
For the upper bound we have
G
G u + yp G u " u 1 "
ymax + " ymax yp ymax
yp
Similarly for the lower bound: G u G
1
ymin + yp
"
u "
ymin + yp
Combining the constraints, we obtain 2
G 4 G 0
3 1 1 5 1
u "
2
3 ymax yp 4 ymin + yp 5 0
where the last constraint is the requirement for the slack variable to be nonnegative.
2.6. MULTIVARIABLE DMC AND QDMC
37
The hard and the soft constraints can then be combined into one constraint system, similar to (2.2): 2 3 umax;1 6 7 umax;2 6 7 .. 6 7 6 7 . 6 7 6 7 u max;c 6 7 6 7 u min;1 6 7 6 7 u min;2 6 7 .. 6 7 6 7 . 6 7 6 7 umin;c 6 7 6 umax;1 u (k 1) 7 6 7 6 umax;2 u (k 1) 7 2 3 6 7 I 0 6 7 .. 6 7 6 7 I 0 . 6 7 6 7 6 IL 7 6 umax;c u (k 1) 7 0 6 7 6 7 u 6 IL 0 7 6 umin;1 + u (k 1) 7 6 7 6 7 " 6 G 6 umin;2 + u (k 1) 7 1 7 6 7 6 7 6 7 4 G .. 1 5 6 7 . 6 7 0 1 6 umin;c + u (k 1) 7 6 7 6 ymax;1 y p (k + 1) 7 6 7 6 ymax;2 y p (k + 2) 7 6 7 6 7 .. 6 7 . 6 7 6 y 7 p 6 max;p y (k + p) 7 6 y 7 p min;1 + y (k + 1) 7 6 6 y 7 p min;2 + y (k + 2) 7 6 6 7 .. 6 7 . 6 7 4 y p + y (k + p) 5 min;p
0
2.6
Multivariable DMC and QDMC
What is nice with MPC is that multivariable control problems can be solved without (explicit) decoupling. All interactions between variables are taken into account during the optimization, since they are included in the plant model. It is necessary to know the e¤ect of each manipulated variable and mesured disturbance to each of the (controlled and/or constrained) output variables. Step responses can be identi…ed for each MISO (Multiple-Input Single-Output) subprocess models. In a large dimensional problem this may result in a large number of experiments. The simplicity of the extension of the SISO DMC/QDMC developments to the MIMO (Multiple-Input Multiple-Output) case is due to the fact that b the multiple inputs and measured disturbances can be in MISO predictions y superimposed (summed) with each other. This property holds for linear systems.
38
CHAPTER 2. QUADRATIC DMC (QDMC)
The MIMO model can be formed by piling the MISO predictions on top of each others. Denote the number of system inputs by m and system outputs by n. Then yp is a column vector with n p elements; G is the dynamic matrix with np mc elements; and u is the column vector of future control moves of size mc 1. As a result, the future predictions will have the form 3 2 3 2 d 32 3 2 2 3 s1;1 sd1;2 sd1;q 1b1 b1 Tf 1 d1 (k) y 6 Tf 2 7 6 sd2;1 sd2;2 6 7 6 7 6 y 7 sd2;q 7 7 6 d2 (k) 7 6 1b2 7 6 7 6 6 b2 7 +6 . 7 7 6 7 6 .. 7 = 6 .. 7 + 6 .. . .. . . .. .. .. 5 4 4 . 5 4 . 5 4 .. 5 4 . 5 . d d d bn Tf n dq (k) y sn;1 sn;2 sn;q 1bn | {z } | {z } b y
2
6 6 +6 4 |
yp
G1;1 G2;1 .. .
G1;2 G2;2 .. .
Gn;1
Gn;2 {z
..
G1;m G2;m .. .
.
Gn;m
G
32 76 76 76 54 }|
u1 (k) u2 (k) .. .
3 7 7 7 5
um (k) {z } u
The essential point is that the prediction equation has exactly the same form as in the SISO case: b = yp + G u: y
Conseqently, the solution of the control (optimization) problem follows excatly the same mechanization as the SISO case. The weight is now replaced by a weight matrix , typically a diagonal matrix; a weighing between CV’s can be accomplished by adding a similar weighting matrix for the deviations between reference and predicted output.
2.7
Integrating processes
Integrating processes (e.g., tanks and reservoirs) are common in the process industry. A FSR model can not be formulated for such processes, since the system transient does not end after n instants, s (n + 1) 6= s (n + 2) 6= ::: 6= s (1). Similarily, the a FIR model is not viable, since the coe¢ cients h are not zero in the in…nity. A common approach is to rede…ne the problem so that the rate-of-change of an integrating process is controlled. For example, let the (integrating) plant be given by
z (k) then de…ne y (k) =
bq
1
u (k) 1 q 1 = z (k 1) + bu (k
z (k) =
z (k) = z (k)
z (k
1):
y (k) = bu (k
1)
1)
2.7. INTEGRATING PROCESSES
39
The transients of y in a step response will die out in a …nite time (eventually settling to y (1) = b), and a FSR structure can be used to model the process.
2.7.1
*Constraints
It is typical that integrating processes have upper and lower limits (e.g., tank levels or reservoir upper and lower volumes). Upper and lower bound constraints on the integral variable z can be set as follows zmin;i
z (k + i)
zmax;i
leading to z (k + i) z (k + i)
zmax;i zmin i
For the upper bound we have
Since
z (k + i) z (k + i 1) {z }
z (k + i) |
zmax;i zmax;i
and 1)
1)
z(k+i)
z (k + i) = z (k) +
z (k + i
z (k + i
= z (k
1) +
= z (k |
1) + {z
= z (k) +
Xi
Xi
z(k)
Xi
z (k + j)
j=1
j=1
z (k) + }
1
j=1
z (k + j Xi j=2
1) z (k + j
1)
z (k + j)
for i > 1. We can now write the upper bound constraint as z (k + i) | {z }
zmax;i
z (k)
y(k+i)
Xi
1
y (k + i) + y (k + j) j=1 | {z } Pi
j=1
zmax;i
z (k)
Xi
1
j=1
|
z (k + j) {z } y(k+j)
y(k+j)
where z (k) is a measurement of the process variable z. In matrix form b IL y
zmax
z (k)
40
CHAPTER 2. QUADRATIC DMC (QDMC)
where IL is a lower triangular matrix: 2
1 1 .. .
6 6 6 IL = 6 6 4 1 1
0 1 .. .
0 0 .. .
..
1 1
1 1
1 1
b = G u + yp , and we can write Now y b IL y p IL (G u + y ) IL G u
.
.. . 0 1
z (k) z (k) z (k)
zmax zmax zmax
3 7 7 7 7 7 5
IL y p
For the lower bound we have similarly b IL y
and
zmin + z (k) :
zmin + z (k) + IL yp
IL G u
Finally, we can write the upper and lower constraints in the QP form: 2
6 IL G 6 6 IL G 4 | {z } A4
2.8
|
3
u (k) u (k + 1) .. . u (k + c {z
1)
x
7 7 7 5 }
A4 x
zmax z (k) IL yp zmin + z (k) + IL yp | {z } b4
b4
*Identi…cation of FSR models
Recall the FSR model predictions: 2
y (0) y (1) y (2) y (3) .. .
6 6 6 6 6 6 6 6 6 6 y (n) 4 .. .
3
2
0 s (1) u (0) s (2) u (0) + s (1) u (1) s (3) u (0) + s (2) u (1) + s (1) u (2) .. .
7 6 7 6 7 6 7 6 7 6 7=6 7 6 7 6 7 6 7 6 s (n) u (0) + s (n 5 4
1) u (1) + ::: + s (1) u (n .. .
3
7 7 7 7 7 7: 7 7 7 1) 7 5
2.9. CONCLUSIONS: DMC AND QDMC
41
Let us rewrite the equations so that the step response coe¢ cients s are expressed in a vector. For K + 1 sampled data points we write: 2 3 2 y (0) 0 6 y (1) 7 6 u (0) 0 6 7 6 6 y (2) 7 6 u (1) u (0) 0 6 7 6 6 y (3) 7 6 u (2) u (1) u (0) 0 6 7 6 6 7 6 .. .. .. . .. .. 6 7 6 . . . . 6 7 6 6 y (n 1) 7 = 6 u (n 2) u (n 1) u (0) 6 7 6 6 y (n) 7 6 u (n 1) u (n 2) u (1) 6 7 6 6 y (n + 1) 7 6 u (n) u (n 1) u (2) 6 7 6 6 y (n + 2) 7 6 u (n + 1) u (n) u (3) 6 7 6 6 7 6 .. .. .. .. 4 5 4 . . . . y (K)
u (K
y
D1 D2
=
1)
u (K
2)
u (K
where D1 is a n n lower triagular matrix, D2 is a K +1 n n matrix consisting of changes in the input variable (columns 1 to n 1) and values of the input variable (nth column). The least squares estimate of s is then straightforwardly obtained from 1 b s = DT D DT y where D =
2.9
D1 D2
.
Conclusions: DMC and QDMC
Let us summarize the main features of DMC and QDMC. These approaches to MPC: use a linear …nite step response (FSR) model. This modelling approach is only valid for open-loop stable processes, but does include non-minimum phase dynamics and delayed plants. Recall that these type of processes are di¢ cult to control using standard PID’s; use a quadratic cost function; provide o¤set free tracking (due to in-built mechanisms to include future references, measured disturbances, and existence of a bias component that integrates error at the output); provide intuitive tuning (a subjective statement..); handle multivariable control problems naturally, and with ease; can take into account actuator limitations;
0 u (0) u (1) u (2) .. .
n + 1) u (K
s
3
0 0 0 0
n)
7 7 7 72 7 7 76 76 76 76 76 74 7 7 7 7 7 7 5
s (1) s (2) s (3) .. . s (n)
3 7 7 7 7 7 5
42
CHAPTER 2. QUADRATIC DMC (QDMC) allow operation close to constraints, leading to more pro…table operation; can be computing power consuming, which may restrict application for real life processes.
DMC can be represented as a linear controller, i.e., an equivalent linear controller exists. The QDMC controller is non-linear, and no closed-form solution can be given. Instead, the controller solves a QP problem at each sample time.
2.10
Homework - DMC/QDCM
Background: A sample Matlab code for DMC and QDMC is available from exercises in this and previous Chapters. Task: For a SISO plant model to be speci…ed (tf/ss/ode/..., cont/discr): Identify a FSR model. Compare the FSR model behavior to the orginal model by simulations. [1p] Design and implement a DMC controller using Matlab. Simulate the closed-loop performance of the system and illustrate the e¤ect of tuning parameters [+2/#p] Design and implement a QDMC controller using some input–output constraints. Simulate the closed-loop performance and illustrate the signi…cance of the constraints. [+2p] Design and implement a QDMC controller with soft constraints. Illustrate the e¤ect of soft constraints by simulations. [+1p] Write a short report with …gures of simulation outcomes (with plant inputs, outputs, reference outputs,...) and your main observations and conclusions. Prepare a 5-10 min presentation of your work to other students, and be prepared to defend your work (i.e., answer questions..).
Chapter 3
DMC/QDMC power plant case study 3.1
Review of homeworks à 10 min presentations / group = 1 h
3.2
Guided exercise / power plant case study
MIMO DMC/QDMC control of a drum boiler. A guided exercise (by Antti).
43
44
CHAPTER 3. DMC/QDMC POWER PLANT CASE STUDY
Chapter 4
Generalized Predictive Control (GPC) An appealing formulation of long-range predictive control called Generalized Predictive Control (GPC) was derived by Clarke and co-workers. It represents a uni…cation of many long-range predictive control algorithms (IDCOM, DMC) and a computationally simple approach. The main generalization is due to the use of dynamic stochastic models, i.e., Auto-Regressive Integral Moving Average eXogenous (ARIMAX) model, instead of the simple Finite Step Response (FSR) as in DMC. We will start the treatment with the simpler LQ approach, and then extend to the stochastic formulation of the GPC. Both approaches are considered for the SISO case, extension to MIMO is straightforward. In this Chapter, the state space formulation is adopted. First, the state space model and the principle of certainty equivalence control is introduced. The i-step-ahead predictors for the model in state space form are then derived. With a noiseless model and simple quadratic cost function this leads to what is called an LQ (Linear Quadratic) controller. With a stochastic model, the famous GPC results. To conclude this Chapter, the issues of control horizon, integral control action and state estimation are brie‡y discussed.
4.1
Predictive control with a state-space model
Recall that a transfer function model can always be converted into a state space form; in fact, for each transfer function, there is an in…nite number of state space representations. 45
46
CHAPTER 4. GENERALIZED PREDICTIVE CONTROL (GPC)
4.1.1
Plant and model
Let a SISO system (plant, process) be described by a state-space model x (k + 1) = Ax (k) + B u (k) y (k) = Cx (k)
(4.1) (4.2)
where x is the state vector (n
1);
u is the system input change (controller output) (1 y is the system output (measured) (1
1);
A is the state transition matrix (n
n);
B is the input transition vector (n
1);
C is the state observer vector (1
1);
n).
In this Section we assume that a model (approximation) for the system is known b B b and C, b and that the states x and output y are measurable. and given by A; Two remarks are in place:
System descriptions are often given as a function of the actual plant input u instead of u. However, the transition between the two forms is straightforward via state extension, e.g.: 8 e x (k) + B e > e (k + 1) = Ae u (k) < x | {z } > :
8 > > > > > > > < > > > > > > > :
u(k 1)+ u(k)
e x (k) y (k) = Ce e B e e (k + 1) e (k) x x A = + u (k) u (k 1) 0 1 | {z } | {z }| {z } | x(k+1)
A
h
i
x(k)
e (k) x e 0 y (k) = C u (k 1) | {z }| {z } C
e B u (k) 1 {z } B
x(k)
x (k + 1) = Ax (k) + B u (k) y (k) = Cx (k)
In this text we use the u form for consistency with the DMC, and also because the GPC is commonly presented in the literature with u as the optimized variable. In the certainty equivalence control, the uncertainty in the parameters is not considered; the estimated parameters are used as if they were the b B B, b C C). b Thus, in what follows, the notation true ones (A A, is simpli…ed by dropping out the ’hats’, but do remember that a model of a plant is never 100% accurate.
4.1. PREDICTIVE CONTROL WITH A STATE-SPACE MODEL
4.1.2
47
Objectives of control
The target is to …nd the control input u (k) so that the desired control objectives are ful…lled. The objectives concern the future behavior of the process, from the next-to-current state up to the prediction horizon, p. Let the cost function (to be minimized) be given by J=
p X
y ref (k + i)
i=1
yb (k + i)
2
+
u (k + i
2
1)
(4.3)
where y ref (k + i) is the desired system output at instant k + i. Coe¢ cient is a scalar which can be used for balancing the relative importance of the two squared terms in (4.3). The minimization min
u(k);:::; u(k+p 1)
J
(4.4)
gives a sequence of future controls. The …rst value u (k) of the sequence is applied to control the system, at next control instant the optimization is repeated (receding horizon control).
4.1.3
i-step ahead predictions
Let us derive the i-step ahead predictions. We assume that at instant k the measured state vector x (k) is known. To know the future values of x, the model has to be used. The prediction for y (k + 1), based on information available at k, is given by yb (k + 1) = C [Ax (k) + B u (k)] : For y (k + 2) we have
yb (k + 2) = C [Ax (k + 1) + B u (k + 1)]
where the estimate for x (k + 1) can be obtained using the model, x (k + 1) = Ax (k) + B u (k). Substituting this gives yb (k + 2)
= C [A [Ax (k) + B u (k)] + B u (k + 1)] = CA2 x (k) + CAB u (k) + CB u (k + 1) :
In a similar way we have that yb (k + 3) = CA3 x (k) + CA2 B u (k) + CAB u (k + 1) + CB u (k + 2)
and, by induction, for the i-step ahead prediction yb (k + i) = CAi x (k) +
i X
CAi
j
B u (k + j
1) :
(4.5)
j=1
The prediction depends on the state at k, x (k), and the future control moves, u (k + j 1).
48
CHAPTER 4. GENERALIZED PREDICTIVE CONTROL (GPC)
Let us use a more compact matrix notation. Collect the predicted system outputs, the system inputs, and the desired future outputs at instant k into vectors of size (p 1): b (k + 1) = [b y y (k + 1) ; u (k)
=
[ u (k) ;
T
; yb (k + p)]
; u (k + p
T
1)]
Using (4.5) we see that the future predictions can be written in a matrix form:
where
b (k + 1) = KCA x (k) + KCAB u (k) y
KCA
KCAB
2
6 6 = 6 4 2
6 6 = 6 6 4
CA CA2 .. . CAp
3 7 7 7 5
(4.7)
CB
0
CAB .. .
CB .. .
CAp
(4.6)
1
B
..
.
0 .. .
..
. 0 CAB CB
3 7 7 7 7 5
(4.8)
Notice, that (4.6) can be written in the form yp + G u familiar from DMC, i.e., as free and forced response terms, by the following associations: b (k + 1) = KCA x (k) + KCAB u (k) y | {z } | {z } yp
G
Now a procedure very similar to the DMC/QDMC algorithm can be applied, by update of the computation of yp and H. su equals the …rst column of KCAB (i.e., G). For the measured disturbance a similar derivation can be used to develop sd .
4.1.4
LQ algorithm
O¤-line calculations: Specify p and c; Based on an incremental state-space model, calculate KCA and KCAB ; set G equal to c …rst columns of KCAB . Solve the matrix H 1 H = GT G + I GT : On-line calculations 1. Obtain state, output and disturbance x (k), y (k) and d (k) from the process.
4.2. SHORT (RE)CAP ON STOCHASTIC SYSTEMS AND PREDICTORS49 2. Calculate free prediction yp (k + 1), including predicted e¤ect of disturbances d (k + 1), and deviation from set point e (k + 1): yp (k + 1) = KCA x (k) + d (k + 1) e (k + 1) = y sp (k + 1) yp (k + 1) 3. Solve for the optimal control sequence u (k) = He (k + 1) 4. Apply the …rst control move in the sequence to the process, and return to step 1 in the next sample instant. The essential di¤erence between the state-space model (4.1)–(4.2) and the FSR model su used in the DMC/QDMC is that the latter is of dimension n. This may turn out to be very large, depending on the choice of sampling rate and duration of process transients. A state-space model has internal dynamic components which enable to model low order systems with just a few parameters. From parameter estimation point of view this brings about the problem of estimating the system order (–). However, with less parameters the harmful e¤ect of noise in data can be reduced when estimating the model coe¢ cients in A, B and C (+). System order may also be known beforehand from physical considerations, in which case it is an important a priori knowledge to be used in plant identi…cation (+).
4.1.5
Exercises
1. Code an LQ-controller using Matlab. 2. Compare with the DMC algorithms from previous Chapters. 3. Code the algorithm corresponding to QDMC using a state-space model. See Ex_LQ.m.
4.2
Short (re)cap on stochastic systems and predictors
4.2.1
On stochastic systems (in Finnish)
A random variable X attaches each possible outcome of a random experiment s 2 S with a number X (s).
50
CHAPTER 4. GENERALIZED PREDICTIVE CONTROL (GPC)
R X: S->R S
3
2
X(s)
{011} {100} {101}
1
Example. (Laininen, 2001) Three diesel engines are used to generate electricity in the case of a fault: engines 1, 2 and 3 should start automatically when a fault occurs. During a given time period, the probability of start-up of a single engine is 0.8, and the start-ups are mutually independent. Let us denote the status of a single engine 1 = starts and 0 = does not start, and by a triplet 111, 110, ... the state of the whole plant in case of a fault. The random experiment is described by a model, with a sample space S = f111; 110; 101; 011; 100; 010; 001; 000g and probabilities Pr f111g Pr f110g Pr f100g Pr f000g
= = = =
0:8 0:8 0:8 = 0:512 Pr f101g = Pr f011g = 0:8 Pr f010g = Pr f001g = 0:8 0:2 0:2 0:2 = 0:008
0:8 0:2
0:2 = 0:128 0:2 = 0:032
Hence, the state of the power plant is described at engine level. The number of starting engines X is a random variable: X f000g X f100g X f110g X f111g
= 0 = X f010g = X f001g = 1 = X f101g = X f011g = 2 = 3
The distribution of a random variable X is obtained by associating each denot. value of X its probability Pr (X = x) = f (x) , where f is the probability function of X. The cumulative function is given by F (x) = Pr (X x), the density function by F 0 (x) = f (x). Example (continued) The events f0; 1; 2; 3g in the sample space of X have the following probabilities: Pr f0g = 0:008; Pr f1g = 0:096; Pr f2g = 0:384; Pr f3g = 0:512
4.2. SHORT (RE)CAP ON STOCHASTIC SYSTEMS AND PREDICTORS51 The expectation of the random variable is 8 R1 xf (x) dx if x is continuous < 1 E fXg = : P if x is discrete x xf (x)
and its variance
n E [X
2
E (X)]
o
:
– For random variables X and Y it holds that: E fX + Y g = E fXg + E fY g E faXg = aE fXg Event A is independent on event B, if the occurance (or non-occurance) of B does not e¤ect the probability of occurance of A. – For independent random variables X and Y it holds: E fXY g = E fXg E fY g Stokastinen prosessi X (t), t 2 I, on joukko S:ssä määriteltyjä satunnaismuuttujia. – X (t; s) on prosessin tila. Jokaiseen s 2 S liittyy (kiinteällä t) luku X (t; s), josta antamalla t:n muuttua saadaan funktio t ! X (t; s) [jota merkitään lyhyesti myös t ! x (t)] ja sanotaan prosessin X (t) realisaatioksi. A stochastic process is: – stationary, if its statistical properties do not change when shifted in time t. – ergodic, if its statistical properties (such as its mean and variance) can be deduced from a single, su¢ ciently long sample (realization) of the process.
4.2.2
*Optimal predictor for a regression model
Consider the following MISO model of the relation between the inputs and output of a system : y (k) = T ' (k) + (k) (4.9) where
2
6 6 6 6 =6 6 6 6 4
1
3
2 7 7 .. 7 . 7 7 7 i 7 .. 7 . 5 I
(4.10)
52
CHAPTER 4. GENERALIZED PREDICTIVE CONTROL (GPC)
and
2
'1 (k) '2 (k) .. .
6 6 6 6 ' (k) = 6 6 'i (k) 6 6 .. 4 . 'I (k)
3 7 7 7 7 7 7 7 7 5
(4.11)
The model describes the observed variable y (k) as an linear combination of the observed vector ' (k) plus noise (k). Such a model is called a linear regression model, and is a very common type of model in control and systems engineering. ' (k) is commonly referred to as the regression vector; is a vector of constants containing the parameters of the system; k is the sample index. Often, one of the inputs is chosen to be a constant, 'I 1, which enables the modeling of bias.1 If the statistical characteristics of the disturbance term are not known, we can think of yb (k) = T ' (k) (4.12)
as a natural prediction of what y (k) will be. The expression (4.12) becomes a prediction in an exact statistical (mean squares) sense, if f (k)g is a sequence of independent random variables, independent of the observations ', with zero mean and …nite variance. This will be shown next. Predictor
We are looking for a predictor yb (k) which minimizes the mean square error criterion n o 2 yb (k) = arg min E (y (k) yb) T
y b
Replacing y (k) by its expression ' (k) + (k) it follows: n o 2 2 T ' (k) + (k) yb E (y (k) yb) = E = E
T
' (k)
= E
T
' (k)
yb
yb
2
2
+ [ (k)] + 2 (k)
2
T
' (k)
n o n 2 + E [ (k)] + 2E (k)
If the sequence f (k)g is independent of the observations ' (k), then n o n o T E (k) T ' (k) yb = E f (k)g E ' (k) yb
yb
T
' (k)
1 If one of the inputs is taken to be a constant (' 1), the function will take the form I f2 (') + I . In control and identi…cation literature, this type of a polynomial of degree 1 is said to be a linear (or a¢ ne) function. In a strict mathematical sense, however, the principle of superposition is not satis…ed and the function is not linear, unless I = 0. Notice, however, that the term f2 (') is linear.
yb
o
4.2. SHORT (RE)CAP ON STOCHASTIC SYSTEMS AND PREDICTORS53 In view of the fact that f (k)g isna sequence of independent random variables o T with zero mean value, it follows E (k) ' (k) yb = 0: As a consequence, J =E
T
n o 2 + E ( (k))
2
yb
' (k)
and the minimum is obtained with (4.12). The minimum value of the criterion o n 2 is equal to E ( (k)) , the variance of the noise.
4.2.3
*Identi…cation of plant models
In system identi…cation, both the structure and the true parameters of a system may be a priori unknown. Linear structures are a very useful starting point in black-box identi…cation, and in many cases provide predictions that are accurate enough. Since the structure is simple, it is also simple to validate the performance of the model. The selection of a model structure is largely based on experience and the information that is available of the process. In many practical cases, the parameters are not known, and need to be estimated. Let b be the estimate of : T
yb (k) = b ' (k)
(4.13)
Note, that the output yb (k) is linearly dependent on both b and ' (k) : Parameter estimates b may be based on the available a priori information concerning the process (physical laws, phenomenological models, etc.). If these are not available, e¢ cient techniques exist for estimating some or all of the unknown parameters using sampled data from the process. These methods assume that a set of input-output data pairs is available, either o¤-line or online, giving examples of the system behavior: b=
T
1
T
y
where and y are input and output data matrices with K rows, respectively, and b is then the least squares estimate based on K data samples.
4.2.4
*On time-series models
Dynamic systems with disturbances are often modelled with structures of the form: B q 1 y (k) = u (k d) + (k) A (q 1 ) where (k) describes all (both stochastic and deterministic) disturbances that a¤ect the system output. A and B are polynomials of order nA and nB , respectively; A is a monic (…rst coe¢ cient is 1); d is the input delay.
54
CHAPTER 4. GENERALIZED PREDICTIVE CONTROL (GPC)
Example 1 (ARX) In the ARX-model structure, the disturbance is given by (k) =
1 e (k) A (q 1 )
where e (k) is discrete white noise sequence (expectation zero, variance output of the system can be expressed as y (k) =
B q A (q
1
u (k
1)
d) +
2
). The
1 e (k) A (q 1 )
and further
1+a1 q
i.e.
A q 1 | {z }
y (k) =
1 +:::+a nA q
y (k)
=
nA
b0 +b1 q
a1 y (k +b0 u (k +e (k)
B q 1 | {z } 1 +:::+b
u (k
nB q
d) + e (k)
nB
1) ::: anA y (k d) + ::: + bnB u (k
nA ) d nB )
We notice that the ARX model can be written as a linear system: y (k) =
T
' (k) + e (k)
where
'T (k)
= [ a1 ; a2 ; :::; anA ; b0 ; b1 ; :::; bnB ] = [y (k 1) ; :::; y (k nA ) ; u (k d) ; :::; u (k
d
nB )]
and e (k) is a sequence of zero mean random variables, independent on each other and observations ' (k). Based on what has been derived for a regression model, the optimal predictor for an ARX system is yb (k + 1) = B q
where A = 1 + q
1
1
u (k
d + 1)
A1 q
1
y (k)
A1 .
Example 2 (OE) The OE-model structure is given by (k) = e (k) where e (k) is discrete white noise sequence (expectation zero, variance output of the system is given by y (k) =
B q A (q
1 1)
u (k
d) + e (k)
2
). The
4.2. SHORT (RE)CAP ON STOCHASTIC SYSTEMS AND PREDICTORS55 which can be further written as A q
1
y (k) = B q
1
u (k
d) + A q
1
e (k)
Now the components of the sequence A q 1 e (k) are not independent. Let us calculate the optimal predictor for an OE-system by minimizing the expected squared prediction error, n o 2 yb (k + 1) = arg min E [y (k + 1) yb] y b
Substiting y (k + 1) from the system model, we have: o n 2 E [y (k + 1) yb] 8" !#2 9 = < B q 1 u (k + 1 d) y b = E ; : A (q 1 ) ( ! ) B q 1 +2E u (k + 1 d) yb e (k + 1) A (q 1 ) +E e2 (k + 1)
The second term is zero, since e (k + 1) is independent on other terms and E fe (k + 1)g = 0. The third term does not depend on yb. Hence, the criterion is minimized when the …rst term is zero, i.e. when yb =
B q A (q
1
1)
u (k + 1
d) :
The predictor can be written in a more explicite form yb (k + 1) = B q
1
u (k
d + 1)
A1 q
1
yb (k)
where A1 q 1 = a1 +:::+anA q (nA 1) . The optimal predictor for instant k +1 depends on the past predictions. We can still write the predictor as yb (k) =
T
' (k)
but now the components (b y ’s) depend on the parameter vector .
4.2.5
The ARIMAX model
Typically, a LTI process model is given in a transfer polynomial form: y (k) = B (q 1 ) Aq 1 u (k). An ARIMAX model contains the same information with an increC (q 1 ) mental control input and a noise model (k) = A(q 1 ) e (k): y (k) = where
B q 1 C q 1 u (k) + e (k) 1 A (q ) A (q 1 )
56
CHAPTER 4. GENERALIZED PREDICTIVE CONTROL (GPC) A q
1
= 1 + a1 q
B q
1
= b1 q
C q
1
= 1 + c1 q
=
1
q
1
1
nB
+ : : : + bn B q 1
=1
nA
+ : : : + anA q ;
nC
+ : : : + cnC q 1
q
;
;
.
Let us denote F q 1 = A q 1 , where F q 1 = 1 + f1 q 1 + : : : + fnF q n . The ARIMAX model can be represented in the state-space form2 as x (k + 1) = Ax (k) + B u (k) + De (k) y (k) = Cx (k) + e (k) where
2
f1 f2
6 6 6 A = 6 ... 6 4 fn fn b1
B= D=
c1
f1
c2
1
1 0 .. .
0 1
0 0
0 0
b2
bn
f2
cn 1
C=
..
0
3 0 0 7 7 7 7 7 1 5 0
.
fn
1
T
bn
1
1
cn
fn
T
0
If the coe¢ cients of the polynomials A q 1 and B q 1 are unknown, they can be obtained through identi…cation. An estimate of C q 1 may also be identi…ed. One can also consider estimating the matrices A, B and C (and D) directly from input–output data using subspace methods.
4.3
Generalized predictive control
In the GPC, an ARIMAX representation of the plant is used. In what follows, i-step-ahead predictors for the ARIMAX model in state space form will be derived. The controller can then be solved using the techniques derived for DMC/QDMC. 2 The
relation between the state-space description and input–output description is given by B (q) = CT [qI F (q)
A]
1
B;
C (q) = CT [qI F (q)
A]
1
D+1
and F (q) C (q)
= =
det [qI T
A] ; B (q) = CT adj [qI
C adj [qI
A] G + det [qI
A] B
A]
Note that the polynomials are given in terms of the feedforward operator q.
4.3. GENERALIZED PREDICTIVE CONTROL
57
The ARIMAX model can be represented in the state-space form as x (k + 1) = Ax (k) + B u (k) + De (k) y (k) = Cx (k) + e (k)
4.3.1
(4.14) (4.15)
i -step-ahead predictions
The prediction is straightforward to derive. Let us consider a 1-step-ahead prediction y (k + 1)
= Cx (k + 1) + e (k + 1) = C [Ax (k) + B u (k) + De (k)] + e (k + 1) = C (A DC) x (k) + CB u (k) + CDy (k) +e (k + 1)
where the last equality is obtained by substituting e (k) = y (k) Cx (k) from (4.15). The future noise is not known but assumed zero mean, and the 1-stepahead predictor becomes: yb (k + 1) = C (A
DC) x (k) + CB u (k) + CDy (k) n o 2 Proof. The task is to …nd yb (k + 1) = arg minyb E [y (k + 1) yb] n o 2 E [y (k + 1) yb] n = E [C (A DC) x (k) + CB u (k) + CDy (k) + e (k + 1) n 2 = E [C (A DC) x (k) + CB u (k) + CDy (k) yb] +2 [C (A DC) x (k) + CB u (k) + CDy (k) +e2 (k + 1) n = E [C (A DC) x (k) + CB u (k) + CDy (k)
(4.16)
2
yb]
o
yb] e (k + 1) 2
yb]
o
+ E e2 (k + 1)
since e (k + 1) does not correlate with x (k), u (k), y (k) or yb. The minimum is obtained when the …rst term is zero, i.e. (4.16). Similarly, for the 2-step-ahead prediction, we have y (k + 2)
= Cx (k + 2) + e (k + 2) = C [Ax (k + 1) + B u (k + 1) + De (k + 1)] +e (k + 2) = C [A [Ax (k) + B u (k) + De (k)] + B u (k + 1)] +CDe (k + 1) + e (k + 2)
and the 2-step ahead predictor becomes
58
CHAPTER 4. GENERALIZED PREDICTIVE CONTROL (GPC)
yb (k + 2) = CA [A DC] x (k) + CAB u (k) +CB u (k + 1) + CADy (k)
(4.17)
Proof. Proceeding in the same way as with the 1-step ahead predictor, we have n o 2 E [y (k + 2) yb] n = E [CA (A DC) x (k) + CAB u (k) + CB u (k + 1) + CADy (k) o n o n 2 2 +E [CDe (k + 1)] + E [e (k + 2)]
since e (k + 1) and e (k + 2) do not correlate with x (k), u (k), y (k), yb or with each other. The variance is is minimized when (4.17) holds. By induction, we have the following formula for an i-step-ahead prediction 2 3 i X yb (k + i) = 4 CAi j B u (k + j 1)5 j=1
+CAi +CAi
1 1
[A DC] x (k) Dy (k)
The prediction depends on the future control moves, the current state, and the current measurement. Let us use a more compact matrix notation. Collect the predicted system outputs, the system inputs, and the desired future outputs at instant k into vectors of size (p 1): b (k + 1) = y u (k)
T
[b y (k + 1) ;
= [ u (k) ;
; u (k + p
The future predictions can be calculated from
where
; yb (k + p)]
T
1)]
b (k + 1) = KCADC x (k) + KCAB u (k) + KCAD y (k) y KCADC
KCAB
KCAD
2
3 C [A DC] 6 . 7 = 4 .. 5 CAp 1 [A DC] 2 3 CB 0 6 .. .. 7 .. = 4 . . . 5 p 1 CA B CB 2 3 CD 6 .. 7 = 4 . 5 CA
p 1
D
(4.18)
(4.19)
(4.20)
(4.21)
2
yb]
o
4.3. GENERALIZED PREDICTIVE CONTROL
59
Notice that (4.18) can be written in the form yp + G u, i.e., as free and forced response terms, by the following associations: b (k + 1) = KCADC x (k) + KCAD y (k) + KCAB u (k) y | {z } | {z } yp
G
Now a procedure very similar to the DMC/QDMC algorithm can be applied, by update of the computation of yp and H.
4.3.2
GPC algorithm
The algorithm is similar to LQ, di¤erent steps are marked with an asterisk (*). * O¤-line calculations: Specify p and c; Based on an incremental state-space model, calculate KCADC , KCAB and KCAD ; set G equal to c …rst columns of KCAB . Solve the matrix H H = GT G + I
1
GT :
On-line calculations 1. Obtain state and output measurements x (k) and y (k). 2. *Calculate free prediction yp (k + 1), and deviation from set point e (k + 1): yp (k + 1) e (k + 1)
= KCADC x (k) + KCAD y (k) = y sp (k + 1) yp (k + 1)
3. Solve for the optimal control sequence u (k) = He (k + 1) 4. Apply the …rst control move in the sequence to the process, and return to step 1 in the next sample instant. The algorithm for the constrained GPC can be developed following guidelines similar to QDMC, with input–output constraints expressed as Ac u bc . The o¤-line step involves calculation of the contraint matrix Ac and Hessian H = GT G + I (note that H is di¤erent from the unconstrained case). On-line computations include calculation of the free prediction yp and deviation e, which enables to compute the gradient c = GT e. Also the constraint vector bc needs to be constructed on-line. With H, c, Ac and bc , the optimal control sequence u can be solved using QP, and the …rst element applied to control the plant.
4.3.3
Remarks
Let us discuss some spesi…c topics related to the GPC.
60
CHAPTER 4. GENERALIZED PREDICTIVE CONTROL (GPC)
*Known disturbances The issue of a known disturbance d (k) is a bit more delicate here. With LQ we intuitively assumed that the d (k + 1) can be simply added to yp :Assume now that the disturbance a¤ects only the output measurements (and not the states) x (k + 1) = Ax (k) + B u (k) + De (k) y (k) = Cx (k) + e (k) + d (k) Assuming that the e¤ect of the measured disturbance d (k) in the future is predicted by d (k + 1), we can derive (by writing out the predictions for k + i) yp (k + 1) = KCADC x (k) + KCAB u (k) + KCAD (y (k)
d (k)) + d (k + 1) :
However, above we assumed that the states are completely measurable, which is typically not the case. Therefore, instead, the common approach is to use state estimation (see later sections). Disturbance model The disturbance model in the ARIMAX structure y (k) =
1
B q A (q
1)
u (k
d) +
C q 1 (q 1 ) A (q
1)
e (k)
(4.22)
allows a versatile design of disturbance control in predictive control. In particular: with C q 1 = C1 q C1 A is obtained; with C q 1 = gral action;
1
q
1
with C q 1 = A q (noise characteristics
1 1
, an ARIMAX model with noise characteristics
A q
1
, the approach reduces to having no inte-
, a pure integral control of disturbances is obtained );
with C q 1 = q 1 C1 q C1 teristics A is obtained;
1
, an ARMAX model with noise charac-
with C q 1 = q 1 A q 1 C1 q 1 , an arbitrary FIR …lter can be designed for the noise (no integral action); etc.
4.3. GENERALIZED PREDICTIVE CONTROL
61
Prediction, control and minimum horizons The prediction horizon is generally chosen to be at least equal to the equivalent time delay (the maximum time delay augmented by the number of unstable zeros). In practice, much larger horizons are often used, however. Practical tuning rules include selection of p up to 1:5 times the system settling time, or as 1 3 times the system time constant. In some settings, the control horizon can also be used as a tuning parameter. Using c = 1 results in mean-level control, where the optimization seeks for a constant control input (only one change in u allowed), which minimizes b in the given horizon. the di¤erence between targets yref and predictions y With large prediction horizon p, the plant is driven to a constant reference trajectory (in the absence of disturbances) with the same dynamics as the open-loop plant. A minimum horizon speci…es the beginning of the horizon to be used in the cost function. If the plant model has a dead time of d (assuming that b0 is nonzero in (4.22)), then only the predicted outputs at k + d, k + d + 1, ::: are a¤ected by a change in u (k). Thus, the calculation of earlier predictions would be unnecessary. If d is not known, or is variable, the minimum horizon m can be set to 1. The GPC represents an uni…cation of many long-range predictive control algorithms, as well as a computationally simple approach. With c = nA + 1, p = nA + nB + 1, m = nB + 1 a dead-beat control results, where the output of the process is driven to a constant reference trajectory in nB + 1 samples, nA + 1 controller outputs are required to do so. The generalized minimum variance controller corresponds to the GPC in which both the m and p are set equal to time delay and only one control signal is weighted. *Alternative cost functions In some cases it is more relevant to consider a cost function with weights on the non-incremental control input J
=
(w (k + 1) T
b (k + 1))T Q (w (k + 1) y
+u (k) Ru (k)
b (k + 1)) y
(4.23)
An approach simular to ARIMAX can be derived, with substitutions F q 1 A q 1 and u (k) u (k) (ARMAX structure). This is a good choice, e.g., if the process already includes an integrator in itself. In some cases is relevant to consider cost functions weights relative to time In (4.23) the matrices Q and R may consist of Q = I and R = I as we have supposed so far, or they may weigh deviations in time by putting less weight to
62
CHAPTER 4. GENERALIZED PREDICTIVE CONTROL (GPC)
deviations in far in the future, e.g., Q = diag ([ 1 ; 2 ; :::; p ]), with exponentially p decaying i = , where is a constant tuning factor 0 > xk + g xk+1 = > > 1 |{z} 0 1 > < | {z } uk | {z } A B > > yk = 1 0 xk > > > | {z } : C
Note that the system is described by a linear state space model. Building the Kalman …ltter. Note that the model corresponds to the notation we’ve already used with the Kalman …lter, when x and y, as well as A, B and C are selected as above (i.e. the control is taken as a constant uk = g ); the measurement is denoted by vk (variance R) and the state noise is described by Gwk (and the variance of fwg by Q):). We assume that the noise properties do not change as a function of time. It is believed that the states are not a¤ected by any disturbances, such as vertical turbulences/ rolling of the object, etc. Hence the state disturbance matrix can be set to zero: G = 0 (and Q = 0). g is known (normal gravity acceleration g = 9:8 m/s2 ) and the friction due to air is not taken into account. Let us examine the properties of the hight meter by conducting measurements with an object placed at the ground. The following set of ten measurements was obtaned: 8:65, 33:31, 2:50, 5:75, 22:92, 23:81, 23:78, 0:75, 6:54, 3:49 which gives an average of y = 0:026. The estimate of the variance is given by P 2 (yk y) 2 b =R= = 326 10 1
6.3. ESTIMATION OF A FALLING OBJECT
87
It is believed that the noise of the measurement is similar irrespective of the object height (not very realistic, though..). Initial values for the algorithm. Let us pick an initial estimate for the b0 , and itse covariance, P0 . The intention is to take the object to one state, x kilometer height, hence we can use the initial guess for the state: b0 = x
1000 0
i.e. it is assumed that the height is 1000 meters and speed is 0 m/s. However, we should be cautious with respect to both of these two. Let us assume that the height at the place of dropping the object is measured with the same height measurement device as the height of the object (with variance Y ), and that the object might receive an initial boost when dropped (assume a standard deviation of 5 m/s): 326 0 P0 = 0 25 Algorithm computations. Now the algorithm can be started once the object is dropped and measurements of its height are obtained. Let us simulate a situation where the true height and speed of the object when dropped were 1050 m and 3 m/s. The object is dropped at instant k = 1. Using the initial guess and the model, the Kalman …lter predicts the state at k = 2: b2j1 = [996:1m; 8:8m/s]| x
The …rst measurement is obtained at k = 2, y2 = 1036:3. With this observation the height is corrected upwards: b2j2 = [1017m ; 7:3m/s]| x
Using the model, it is then predicted that by k = 3 the object falls to: b3j2 = [1004:7m; 17:1m/s]| x
The new measurement is y3 = 1038:7m, hence the height estimate is again corrected upwards: b3j3 = [1018:3m; 14:9m/s]| x
Using the model we can predict the estimate for the next instant, etc. The …gure shows the signals as the object falls. It can be noticed that the estimation error reduces as more and more observations are obtained (the diagonal elements of the P -matrix tell about the variance of the estimation error). Also the Kalman gain decreases (showing the e¤ect of measurement correction in the updates).
88
CHAPTER 6. KALMAN FILTERING (KF)
K 1100
0.7 true meas estim
1000
0.6 0.5 0.4
900
0.3 800
0.2 0.1
y(k)
700
0
0
5
10
15
10
15
600 P 350
500
300 250
400
200 300
150 100
200
50 100
0
5
10
15
0
0
5
Kalman-…lter: Estimation of the hight of a falling object.
6.4
Exercises
1. Calculate few rounds of Kalman …lter algorithm by hand (a) Let the plant be given by: xk+1 = 0:9xk + 0:2uk + 0:1wk+1 ; yk = xk + vk where wk ~N 0; 0:12 and vk ~N 0; 0:22 and the initial guess is x b = 3 and P = 0:52 . The data is given by control actions uk : f1; 1; 1; 1; 1; 0; 0; 0; 0; 0g, and corresponding measurements yk : f ; 1:77; 1:63; 2:21; 2:08; 2:46; 1:57; 1:85; 1:20; 1:58g. (b) Use the falling object example. 2. Code Kalman …lter to Matlab 3. Simulate behavior of KF using the falling object example setting. Examine the time behavior of P and K. 4. Examine the e¤ect of model parameter mismatch (A, B, Q and R). See Ex_KF.m.
6.5. HOMEWORK - KALMAN FILTER
6.5
89
Homework - Kalman …lter
Background: A sample Matlab code for Kalman …lter is available from exercises in this Chapter. Idea of EKF was presented in previous Chapter. A SISO process model needs to be speci…ed (tf/ss/ode/..., cont/discr) Task: For the plant, using Matlab : Implement a Kalman …lter for estimation of system states. Examine the e¤ect of initial guesses (of various parameters) by simulations. Experiment and illustrate the performance of Kalman …lter by simulations. Consider either the Kalman …lter for parameter estimation (illustrate estimation of plant model parameters), or an extended Kalman …lter (develop a Matlab algorithm for EKF and experiment it with some nonlinear plant using simulations). Write a short report and prepare a presentation/ to defend your work.
6.6
Kalman …lter in parameter estimation
Suppose that the data is generated according to y (k) = 'T (k) + e (k)
(6.13)
where e (k) is a sequence of independent Gaussian variables with zero mean and variance 2 (k). Suppose also that the prior distribution of is Gaussian with mean 0 and covariance P0 . The model, (6.13), can be seen as a linear state-space model: (k + 1) = (k) T y (k) = ' (k) (k) + e (k) Comparing with (6.1)-(6.2) shows that these equations are identical when making the following substitutions (notice, that we now allow for time-varying matrices): (k)
Ak Bk Gk
I; xk 0; uk 0; wk
Ck vk
'T (k) ; yk e (k) ; Rk b0j0 x
0 0; Qk
0 ; P0j0
0
y (k) ; (k)
2
P0
90
CHAPTER 6. KALMAN FILTERING (KF)
The Kalman …lter algorithm is now given by K (k + 1) =
2
P (k) ' (k + 1) (k) + 'T (k + 1) P (k) ' (k + 1) bT (k) ' (k + 1)
b (k + 1) = b (k) + K (k + 1) y (k + 1) P (k + 1) = P (k)
K (k + 1) 'T (k + 1) P (k)
(6.14)
Comparing with the well known Recursive Least Squares method (RLS) shows that the Kalman …lter holds the RLS as its special case. In fact, the Kalman …lter gives the initial conditions of the RLS a clear interpretation: b (0) is the prior mean and P (0) is the prior covariance of the parameters . Furthermore, the posterior distribution of at sample instant k is also Gaussian with mean b (k) and covariance P (k).
6.6.1
*Parameter estimation in time-varying systems
If the dynamics of the system are changing with time, i.e., the model parameters are time-varying, we can assume that the parameter vector varies according to (k + 1) =
(k) + v (k)
Now V 6= 0 and the covariance update becomes (see (6.14)): P (k + 1) = P (k)
K (k + 1) 'T (k + 1) P (k) + V
This prevents the covariance matrix from tending to zero. In fact P (k) ! V when the number of iterations increases, and the algorithm remains alert to changes in model parameters. For example, the addition (regularization) of a constant scaled identity matrix at each sample interval has been suggested, V I. The bounded information algorithm ensures both lower and upper bounds amin and amax for P (k) P (kjk) =
amax amin P (kjk amax
1) + amin I
An advantage of the Kalman …lter approach, compared e.g. to the least squares algorithm with exponential forgetting, is that the nature of the parameter changes can be easily incorporated, and interpreted as the covariance matrix V.
Chapter 7
Particle Filtering (PF) 7.1
Basic particle …lter
Monte Carlo methods are computational algorithms that rely on repeated random sampling to compute their results. A particle …lter is an implementation of the Bayesian …lter using sequential Monte Carlo methods. Instead of describing the required pdf as a functional form, the pdf is represented approximately as a set of random samples of the pdf. The approximation can be made as good as necessary by choosing the number of samples N . As N ! 1, the approximation becomes an exact equivalent of the functional form. These random samples are the particles of the …lter which are propagated and updated according to the models for system dynamics and measurements. Unlike the Kalman …lter, the approach is not limited by the linear–Gaussian assumptions. The particle …ltering can handle e.g. dynamics with discrete jumps or multi-modal densities. However, the approach may be computationally expensive, and the advent of cheap powerful computers has been the key to the success of particle …lters. Let us develop some basic notation; we will continue to use the notation where sampling instants are indicated as subscripts. The dynamic model describes how the state vector evolves with time, the measurement equation relates the received measurement to the state vector: xk+1 yk
= fk (xk ; wk ) = hk (xk ; vk )
(7.1) (7.2)
where x is the state vector to be estimated f and h are known (possibly non-linear) functions. w is a white noise sequence (the process noise), the pdf of w is assumed to be known. 91
92
CHAPTER 7. PARTICLE FILTERING (PF) y is the vector of received measurements v is a white noise sequence (the measurement noise), the pdf of v is assumed to be known and independent of w.
Equation (7.1) de…nes a Markov process. An equivalent probabilistic description of the state evolution is p (xk+1 jxk ), sometimes called as the transition density. An equivalent probabilistic model for (7.2) is p (yk jxk ). With initial conditions p (x0 ) the speci…cation of the problem is complete. In the Bayesian approach, one attempts to construct the posterior pdf of the state vector: p (xk jYk ), where Yk denotes the set of all measurements received up to and including instant k, Yk = fy1 ; y2 ; : : : ; yk g. The formal Bayesian …lter consists of a prediction and update operation, recall equations (5.3)–(5.4). The prediction operation propagates the posterior pdf at instant k 1 to a prior at k: Z p (xk jYk 1 ) = p (xk jxk 1 ) p (xk 1 jYk 1 ) dxk 1 {z } | {z }| {z } | prior at k
dynam ics
p osterior from k 1
The prior pdf may be updated with the new measurement yk : , p (xk jYk ) = p (yk jxk )p (xk jYk | {z } | {z }| {z p osterior
likelihoo d
prior
1)
}
p (yk jYk | {z
1)
}
norm alization
R where p (yk jYk 1 ) = p (yk jxk ) p (xk jYk 1 ) dxk . The measurement likelihood p (yk jxk ) is regarded as a function of x given y. The initial condition is given by p (x0 jY0 ) where Y0 is the empty set. In above, we have actually only repeated what was already presented about Bayesian state estimation. In the linear-Gaussian case, an exact closed-form solution exists: the Kalman …lter. With local linearization, the approach can be extended to mildly non-linear processes (EKF). With increasingly severe departures from the linear-Gaussian situation …lter divergence may occur, exhibited by estimation errors substantially larger than indicated by the …lter’s internal covariance. For such grossly non-linear problems, the particle …lter may be an attractive option.
7.1.1
Monte Carlo integration
Monte Carlo methods concern estimation of properties of some complex probability distribution p, such as the expectation Z h = h (x) p (x) dx where h is some useful function for estimation. For example, the mean value is obtained with h (x) = x. Often, this cannot be achieved analytically. In
7.1. BASIC PARTICLE FILTER
93
such cases we can generate random samples from p, xi (i = 1; 2; :::N ) and approximate the distribution p by point masses so that h'
1 XN h xi : i=1 N
Quite obviously, N needs to be large in order to give a good coverage of all the regions of interest. More generally in mathematics, Monte Carlo integration is numerical integration using random numbers. In particle …ltering, Monte Carlo integration (MC sampling) is used to represent the predictive distribution p (xk jYk 1 ). A simple particle …lter can be seen as a direct mechanisation of the formal Bayesian …lter, using Monte Carlo integration and resampling. In the resampling stage, a sample of size N is drawn from the intermediate set, based on the weights from measurement likelihood. After resampling, all the particles have an equal weight, and some of them have been duplicated or discarded.
7.1.2
Sampling Importance Resampling (SIR)
The most basic particle …lter can be seen as a direct mechanisation of the Bayesian …lter. 1. Suppose that a set of N random samples from the posterior pdf p (xk are available. Denote these particles by xik
1 jYk 1 )
N 1 i=1
i.e., a set of N particles indexed with i from 1 to N . 2. The prediction phase consists of passing each of these posterior particles (from instant k 1) through the system model (7.1) to generate a set of prior particles (at k) xik = fk xik 1 ; wki 1 where wki 1 is an independent sample drawn from the pdf of process noise1 . This procedure produces a set of particles from the prior pdf p (xk jYk 1 ). 3. The update phase consists of calculation of a weight for each particle, normalization of weights, and resampling according to normalized weights. A weight ! ik is calculated for each particle, based on the measurement likelihood evaluated at the value of the prior sample: ! ik = p yk jxik :
(7.3)
1 The equation is often written in the informational representation form as x k = fk (xk 1 ; wk ) to emphasize that the noise term includes all terms that took place up to instant k. When modeling a physical process it is more convenient to adopt the actionable representation xk+1 = fk (xk ; wk ) where wk is the forecast of what will happen up to time k + 1. Both notations are widely used.
94
CHAPTER 7. PARTICLE FILTERING (PF) (characterizing the probability that yk is measured if in state xik ). The weights are then normalized so that they sum to unity !i ! ik = PN k
j=1
! jk
:
The prior particles are resampled (with replacement) according to the normalized weights to produce a new set of particles o n N xik i=1 such that Pr xik = xjk = ! jk for all j and i
In other words, a member of the set of prior particles is chosen with a probability equal to its normalized weight, and this procedure is repeated N times to build up a new set of posterior particles.
4. The new set of particles are samples of the posterior pdf at k. The cycle of the algorithm is complete, and we continue from Step 2 with this new set: N xik i=1 : The measurement likelihood (7.3) can be intepreted as an indicator of those regions of the state-space that are plausible explanations of the observed measurement value. If the value of the likelihood function is high, these state values are well supported by the measurement; If the likelihood is low, these state values are unlikely; If the likelihood is zero, these state values are incompatible with the measurement model (they cannot exist!). Consequently, the resampling operation is biased towards the more plausible prior samples. This simple algorithm is known as the Sampling Importance Resampling (SIR) …lter (also called bootstrap …lter, Monte Carlo …lter, and Condensation algorithm). For compatibility with the Kalman …ltering algorithm, we can add a deterministic system input to Step 2: xik = fk xik
i 1 ; uk 1 ; wk 1
:
The rest of the algorithm remains intact.
7.1.3
*Clarifying examples
As an example, consider a commonly used benchmark system ( xk 1 + 8 cos (1:2k) + wk xk = 12 xk 1 + 25 1+x 2 k
yk =
1
1 2 20 xk
+ vk
7.2. ESTIMATION OF A FALLING OBJECT (CONT’D)
95
where uk ~N 0; 2u and vk ~N 0; 2v with 2u = 10 and 2v = 1. Notation x~N ; 2 denotes that the random variable x is distributed according to normal distribution with mean and variance 2 . We now have xk ~N
x;
yk ~N
y;
2 u 2 v
where the means are given by x
y
1 xk 1 xk 1 + 25 2 1 + x2k 1 2 x ; 20 k
= =
+ 8 cos (1:2k) 1
respectively. In terms of densities, the representation is given by p (xk jxk
1)
1 p 2
=
p (yk jxk )
1 p 2
=
2 u
2 v
exp
(xk 2
exp
yk 2
x) 2 u y 2 v
!
:
Resampling of prior particles can be conducted in a simple way by drawing N N samples from a discrete distribution ! ik i=1 and copying the associated particles from population xik and weights be given by x1k ! 1k
= =
N i=1
to xik
N . i=1
For example, let the population
1; x2k = 2; x3k = 3 0:2; ! 2k = 0:2; ! 3k = 0:6
Drawing samples from this distribution can be implemented by considering a line segment of length 1 and dividing it into segments of length ! ik : [0; 0:2], [0:2; 0:4] and [0:4; 1]. Now draw three random samples from a uniform distribution U (0; 1), say 0:814, 0:906 and 0:127 and place the points on the segment. Picking the particles that are associated with the given points, the resampled population will be x1k = 3; x2k = 3; x3k = 1: Systematic resampling (see later subsection for details) provides an e¢ cient way to implement resampling also for large populations.
7.2
Estimation of a falling object (cont’d)
Let us revisit the falling object example familiar already from the Kalman …lter. A sample simulation with a very small number of particles (N = 10, valid only for educational purposes) was carried out. Outcomes are illustrated in Fig. 7.1.
CHAPTER 7. PARTICLE FILTERING (PF)
1200 xhat 1 x1
1000
y
particle set, x 1
96
800
2000 1000 0 N=10 -1000
0
5
10
15
20
0
5
10
15
20
1
2
3
4
5
10 Neff
600 5
400 0 200
1050
0
-200
1000
0
5
10
15
20
950
Figure 7.1: Estimation of the height of the falling object using particle …ltering (SIR).
7.3. EXERCISES
97
The plot on the left shows the true, meaured and estimated object heights. In this simulation, even this tiny particle …lter population is su¢ cient for properly estimating the object trajectory. The plot in the bottom right corner illustrates more closely the behavior of the algorithm during the …rst 5 steps. The meausurement information is shown by ’o’. The colored triangles show the propagation of predictions from posterior (at k) to prior (at k + 1) particles, and the new posterior (at k + 1) population after resampling. Note how at steps 4 and 5 only one particle survives in the resampling; the diversity of the population can maintained by adding state noise to the system model.
7.3
Exercises
1. Code the basic SIR algorithm to Matlab (a) Consider the falling object example 2. Simulate the behaviour of the algorithm. Experiment with number of particles N . See Ex_PF.m.
7.4
Impoverishment and degeneration
In the resampling stage, particles with large weights may be selected many times. Consequently, the new set of particles may contain multiple copies of only a few distinct values. In the worst case (when system noise is small) it can lead to lack of diversity in the particle set, which then leads to a collapse of the particle set to copies of only one particle. This is called impoverishment of the particle set. There are various ways to tackle the problem, including roughening (perturbation of each particle after resampling) and regularization. The SIR algorithm performs resampling at each stage of the algorithm. Without resampling, the procedure would quickly collapse to a very small number of highly weighted particles. The other particles (most of the population) would carry only a tiny proportion of the probability mass. Eventually, this woud result in failure due to an inadequate representation of the required pdf – i.e., degeneracy. Resampling solves the degeneracy problem, but it also tends to increase impoverishment. It is therefore reasonable to carry out resampling only if the particle set begins to degenerate. This again requires a measure for the degeneracy. A convenient measure is the e¤ective sample size Ne¤ = P N
j=1
1 ! jk
2
98
CHAPTER 7. PARTICLE FILTERING (PF) A value close to 1 indicates that almost all the probability mass is assigned to one particle (severe degeneracy)
If the weights are uniformly spread, Ne¤ approaches N .
Resampling is performed only when the Ne¤ falls below a given value (choN sen empirically). If resampling is not performed, the posterior pdf xik i=1 is represented by the pairs xik ; ! ik . In the next prediction phase these particles are passed through the process model (xik ! xik+1 ). The particle weights are then updated with the likelihoods, ! ik+1 = ! ik p yk+1 jxik+1 , and normalized to ! ik+1 . The posterior pdf xik+1 is represented by the pairs xik+1 ; ! ik+1 , and the cycle is complete.
7.5
N i=1
Empirical distributions
The sample states may be viewed as empirical distributions for the prior and posterior states:
p (xk jYk
1)
p (xk jYk )
where
N 1 X N i=1
xk
xik
! ik
xk
xik
N X i=1
N 1 X N i=1
is the Dirac delta function satisfying Z
1
(x) dx = 1:
1
and is zero everywhere, except at the orgin:
(x) =
1 if x = 0 : 0 if x 6= 0
xk
xik
7.6. *SEQUENTIAL IMPORTANCE SAMPLING (SIS)
99
We can now substitute prior into Bayes’rule, and …nd that p (xk jYk )
= p (yk jxk ) p (xk jYk 1 ) /p (yk jYk 1 ) | {z } PN 1 i i=1 (xk xk ) N , N 1 X i p (yk jxk ) xk xk p (yk jYk | {z N i=1
=
=
N 1 X i ! N i=1 k
N X i=1
=
N X
i i=1 ! k
! ik
xk
i=1
1 XN ! ik i=1 N
xik
xk
! ik PN
1 N
PN
1)
! ik
}
xik
xk xik :
i=1
This gives a theoretical backbone for the simple SIR algorithm. The particle …lters provide an approximation of the full posterior of the required state in the form of a set of samples. Statistics, such as mean and covariance of the posterior, can be easily computed from the set of particles bk x
cov (xk )
N X
= E fxk jYk g N X i=1
! ik
xik
! ik xik =
i=1
bk x
xik
bk x
N 1 X i x N i=1 k T
N 1 X i = x N i=1 k
or expected values of an arbitrary cost function C (x) E fC (xk ) jYk g
7.6
N X
! ik C xik =
i=1
bk x
xik
bk x
T
N 1 X C xik : N i=1
*Sequential Importance Sampling (SIS)
In the basic version PN of the particle …lter the empirical posterior pdf was constructed from N1 i=1 ! ik xk xik . The particles xik are assumed to be samples from the prior p (xk jYk 1 ), obtained by passing the posteriors xik 1 from the previous time step through the dynamic model. In other words, each support point xik is a sample of the transition pdf p xik jxik 1 , which is conditional on xik 1 . N
It is not necessary to generate xik i=1 in this way. In fact, they may be obtained from any pdf, known as an importance density or proposal density, as long as the support includes that of the required posterior. In particular, the importance pdf may depend on the measurement yk at k.
100
CHAPTER 7. PARTICLE FILTERING (PF)
The algorithm with an importance pdf is similar to the basic one, with sampling and weight evaluation steps: N 1 i=1
Sampling For each particle xik 1 in xik importance density q xk jxik 1 ; yk .
draw a sample xik from an
Weight evaluation Calculate the unnormalized weight for each sample ! ik =
p yk jxik p xik jxik q xik jxik
1
1 ; yk
As before, the weights are normalized, !i ! ik = PN k
j=1
! jk
PN and the empirical pdf of the posterior is given by p (xk jYk ) = i=1 ! ik xk Resampling with replacement according to the normalized weights produces a set of samples xik
xik .
N i=1
of the posterior pdf p (xk jYk ). If the importance density is chosen to be the transition pdf, i.e. q xik jxik 1 ; yk = p xik jxik 1 , the two terms cancel each other and the basic PF algorithm results. The advantage of this formulation is that the …lter designer can choose any importance density q (as long as the support of q xik jxik 1 ; yk includes that of p (xk jYk )). In particular, the importance density may depend on the value of the measurement yk . If the measurement is accurate, or otherwise localizes well the state vector, importance samples can be placed in the locality de…ned by yk . This adjusting could avoid wasting a high percentage of particles (i.e., impoverishment). A number of particle …lter versions have been suggested for particular choices of this density. As in the basic version of the …lter, it is not necessary to carry out resampling at every sampling instant. If resampling is omitted, the particle weights are updated according to ! ik = ! ik
1
p yk jxik p xik jxik q xik jxik
1
1 ; yk
This exposition is known as the Sequential Importance Sampling (SIS). The SIS can be derived by marginalization of particle trajectories, and provides the starting point of most presentations on particle …lter theory in the literature.
7.7. REMARKS
7.7 7.7.1
101
Remarks *Systematic resampling
Resampling can be time consuming for large population sizes. In systematic resampling the normalized weights ! i are incrementally summed to for a cumulative sum i X ! ic = !j j=1
De…ne a comb of N points spaced at regular intevals ( c = N1 ), and translate the complete comb by a random o¤set from a uniform distribution c0 = U 0; N1 . Then compare the comb c = [c0 ; c0 + c; ; c0 + 2 c; :::; c0 + (N 1) c] containing elements [c1 ; c2 ; :::; cN ] with the cumulative weights ! 1c ; ! 2c ; : : : ; ! N so c that j min argm ci < ! m c where j is the index of the particle in the old population that becomes the i’th particle in the new population (xik = xjk ). This algorithm is known to have the complexity O (N ). The "big-O" is de…ned between functions f and g f (x) = O (g (x)) as x ! 1 if there exists a constant M such that for all values of x: jf (x)j M jg (x)j. In our case, this means that the complexity of the algorithm will be less or equal to M N , i.e., it depends linearily on N (and not more).
7.7.2
Computational cost and number of particles
The computational cost of a particle …lter (with systematic resampling) is almost proportional to the number of particles N , both in terms of operation count and memory requirements. The computational e¤ort clearly depends on the complexity of system dynamics, and the measurement process. If the evaluation of the function f and/or h, (7.1)–(7.2) is computationally demanding, the required simulations will take time. An advantage of the particle …lter is that the number of particles N can be adjusted, according to available computing resources. Parallellization of the computations is also straightforward, until the resampling stage. The required sample size N depends strongly on the design of the particle …lter and the problem being addressed. For high dimensional problems an enormous number of particles may be required with the basic algorithm, and the engineer needs to be inventive in the design of the importance density. Heuristic tricks may be helpful, too. As a rule of thumb, the dimension of the problem should be counted with the remaining …ngers, the number of particles measured in kilos (thousands). Trial and error is the usual way to determine a suitable size for the particle population: Starting with a small sample size, N is increased until the observed error in the parameter of interest falls to a steady level.
102
CHAPTER 7. PARTICLE FILTERING (PF)
Filter initialization is often a challenging aspect in estimation problems. If the a priori information (before measurements are received) is vague, so that the initial uncertainty spans a large volume of the state space, populating the prior pdf with particles may be very wasteful. Semi-batch schemes using the …rst few measurements may be useful.
7.8
Homework
Code the SIR algorithm to Matlab. Pick some nonlinear multivariable dynamic process, but not the falling object example. Examine and illustrate characteristics of the algorithm in process state estimation Find out the limits of computer performance vs population size. Examine the usefulness of the sample distribution vs number of particles N , considering, e.g., the variance between estimated densities in repeated experiments.
Part III
Markov Decision Processes (MDP)
103
Chapter 8
Introduction to MDP Markov Decision Processes (MDP) are provide a very elegant theory for solving stochastic dynamic control and optimization problems, if we are willing to accept some quite limiting assumptions. Assume that: We have a discrete state space S = f1; 2; : : : ; s; : : : ; Sg where S is small enough to enumerate, and there is a relatively small set of actions (decisions): A = f1; 2; : : : ; a; : : : ; Ag Both S and A are sets of indexes, representing, e.g., samples in the space of states x and control actions u, respectively. As before, samping instants are denoted by a subscript, such as in sk and ak . We are given A transition matrices Pa of size S
S with elements
pas0 ;s = Pr fsk+1 = s0 jsk = s; ak = ag which give the probability that we will be in state sk+1 at instant k + 1, if we are in state sk at instant k and apply the action (make the decision) ak . The Markov property states that the conditional probability distribution for the system at the next step depends only on the current state of the system (and the possible current external inputs/control actions), but not on the state of the system at previous steps. There are alternatives and extensions, but the text that follows considers only the discrete-time discrete-state-space case. The literature on MDP is biased. The other half of works focus (almost entirely) on the optimization aspects: dynamic programming and approximate dynamic programming. The main aspects are in learning issues, the corner stone 105
106
CHAPTER 8. INTRODUCTION TO MDP
of arti…cial intelligence and machine learning. The other line of research looks at the properties of the probabilistic discrete-state-space mappings (the Markov chain), mainly via characterization of states and chains and examination of their properties. Applications in the …eld of process control are surprisingly few, taking into account that the techniques have a solid theoretical background and a long history in engineering. It is commonly claimed that the curses of dimensionality and modelling (i.e., explosion of the size of the …nite memory space, and inability to acquire the associated knowledge) make the MDP practically infeasible. It is the belief of the author, however, that the increased computational power and memory at a¤ordable prices enable practical applications also in the …eld of process control, today already. If not for the problems of largest scales, there exists a number of interesting small-to-medium sized problems for which tools for handling uncertain nonlinear optimal control problems are welcomed. In the treatment that follows, …rst a look at the basic optimization tool of dynamic programming is taken, backed up by some basic considerations on …nite state Markov chains needed in handling the stochastic optimization problem. This is followed in the next Chapter by some fundamental characterizations useful in the analysis of Markov chains. The application examples attempt to introduce the relevance of the approach in process control.
8.1
Bellman’s optimality principle
Let us consider the following optimization problem (K ) X k min E Ck (sk ; k (sk ))
(8.1)
k=0
where Ck (s; a) is the immediate cost for being in state s and applying an action a. The immediate cost may depend on the sampling instant k. (s) is a control policy. A policy is a rule which that speci…es "when we are in state s we take action a, a = (s)".
8.1.1
Deterministic problems
With a little thought we can realize that we do not have to solve the problem at once: Imagine that we would be solving a shortest path problem. For example, a driver of a truck who wants to …nd a best path from his current location to the destination. The cost might depend on delivery schedules, fuel costs, etc. Let sk be the index in the network, e.g., a city or a crossing in a highway map, where we have to make a decision where to drive next. If we are in node i of our network, sk = i, let us make a decision ak = j, i.e., we wish to move from node i to node j. In a deterministic problem our transition function will tell us j k that pask+1 ;sk = pj;i = 1. What if we had a function Vk+1 (sk+1 ) that would tell us the "value" of being in state sk+1 at instant k + 1, giving us the cost of the path from node j to
8.1. BELLMAN’S OPTIMALITY PRINCIPLE
107
the destination. To solve the optimization problem at node i we would simply evaluate each possible decision ak and choose the action that gives the optimal sum for the immediate cost Ck (sk ; ak ) and the value of landing in state sk+1 , Vk+1 (sk+1 ). If this value represents money, it makes sense to discount it by a factor . In other words, we have to solve for: k
(sk ) = arg min [Ck (sk ; ak ) + Vk+1 (sk+1 )] : ak 2A
Note that sk+1 is a function of sk and ak ; we could write sk+1 (sk ; ak ) but for simplicity we usually don’t. The value of being in state sk is the value of using the optimal decision k (sk ): Vk (sk )
=
min Ck (sk ; ak ) + Vk+1 (sk+1 (sk ; ak ))
ak 2A
= Ck (sk ;
k
(sk )) + Vk+1 (sk+1 (sk ;
k
(sk ))) :
This equation is the optimality equation for deterministic problems. In words, this is known as the Bellman’s principle of optimality: An optimal policy has the property that whatever the initial state and initial decision are, the remaining decisions must constitute an optimal policy with regard to the state resulting from the …rst decision.
8.1.2
Stochastic problems
In stochastic problems we have to take into account that there can be uncertainty in the next state we visit, or in the immediate costs. These probabilities depend on sk and ak , so we can write Pr (sk+1 jsk ; ak ) to denote probability of sk+1 given sk and ak . The optimality equation can be modi…ed by adding the expectation Vk (sk )
=
min Ck (sk ; ak ) + E fVk+1 (sk+1 (sk ; ak )) jsk g (8.2) X = min Ck (sk ; ak ) + Pr (sk+1 = s0 jsk ; ak )Vk+1 (s0 ) ak 2A {z } | 0 ak 2A
s 2S
=
min Ck (sk ; ak ) +
ak 2A
X
a
ps0k;s
k
pas0k;sk Vk+1 (s0 )
(8.3)
s0 2S
Equation (8.2) is the expectation form of the Bellman’s equation and of fundamental importance. It can also be written in a slightly more compact form Vk (sk ) = min Ck (sk ; ak ) + E fVk+1 (sk+1 ) jsk g : ak 2A
The equation (8.3) is very nice if the transition matrices the terms pas0 ;s are known: 2 a p1;1 pa1;2 pa1;S 6 pa2;1 pa2;2 S;S 6 Pa = pas0 ;s s0 ;s=1 = 6 . .. .. 4 .. . . paS;1
paS;S
Pa containing all 3 7 7 7 5
108
CHAPTER 8. INTRODUCTION TO MDP
Pa might depend on the sampling instant k, it is su¢ cient that it is known for all k. Suppose that we have a function k (s) that determines the action a we should take when in state s (i.e., a controller). We can write the transition probabilities as ps0 ;s = Pr fsk+1 = s0 jsk = s;
k
(s) = ag :
These can be collected in an S S matrix Pk , which is the one-step transition matrix under policy k , with ps0 ;s as an element in the row s0 and column s. If depends on k, then also P depends on k, hence the notation Pk . Let ck be a column vector with element ck (s) = Ck (s; k (s)) and let vk+1 be a column vector with element Vk+1 (s). Then (8.3) can be written as T vk = min ck + vk+1 Pk
(8.4)
where minimization is performed element-wise in the vector. Equation (8.4) can be solved by …nding ak for each state s, resulting in a policy (s), s 2 S. There is a fundamental relation between Bellman’s equation and the original objective function (8.1). The expected cumulative cost by using policy from instant k onwards are given by (K 1 ) X Fk (sk ) = E Ck0 (sk0 ; k0 (sk0 )) + CK (sK ; K (sK )) k0 =k
If Fk (sk ) was easy to calculate, there would be no need for dynamic programming. As it usually is not easy, however, it can be calculated recursively: Vk (sk ) = Ck (sk ; k (sk )) + E Vk+1 (sk+1 ) jsk : | {z } | {z } im m ediate
to go
Now let Vk (sk ) be a solution to (8.2). Then we have the following key result Fk (sk ) = min Fk (sk ) = Vk (sk ) which establishes the equivalence between the value of being in state sk and following the optimal policy
, and
the optimal value function at state sk .
8.1.3
Transition matrix
A key to using MDP’s is to have the transition matrices, Pak . Often, the system is assumed to be time-invariant and we need only Pa , the probability of transition from state to another given that action a is applied to the plant. If the controller is known, we look for P , the transition matrix of the closed-loop system. In
8.1. BELLMAN’S OPTIMALITY PRINCIPLE
109
the reminder of the text we will be looking at ways to …nd a controller , so the controller is not known beforehand. In practice we usually assume that some kind of model M of the system is available, and that we can derive the transition matrices using the model. Assume that random information wk+1 arrives between instants k and k + 1, and is independent of all prior information. Let k+1 be the set of all possible outcomes of wk+1 (let’s assume that k+1 is discrete), and let Pr fwk+1 = ! k+1 g be the probability of the outcome ! k+1 2 k+1 . De…ne the indicator function 1fXg =
1, if statement X is true : 0, otherwise
k The one-step transition probability pask+1 ;sk can be written as X k Pr fwk+1 = ! k+1 g 1fsk+1 =M (sk ;ak ;wk+1 )g pask+1 ;sk =
! k+1 2
k+1
So, …nding the transition matrix means that all we have to do is sum over all possible outcomes of the information wk+1 and add up the probabilities that take us from a particular state-action pair (sk ; ak ) to a particular state sk+1 . In some cases this can be easy, in others not. Alternatively, we can attempt to build the model using transitions observed from plant data. Then the statistics are built by counting the number of observed state-action pairs (s; a) that lead to a particular state s0 , and normalizing the count by the total number of transitions from the pair: pas0 ;s =
# (s0 js; a) # (s; a)
where # denotes a count of the number of observations. Quite obviously, it is rare that any measured set of data would contain information from the entire space of states and actions, S A. Therefore the realizations can be drawn from a model M instead, which presupposes that the model M has been identi…ed using some other techniques.
8.1.4
Random contributions
In many cases the immediate cost is a deterministic function of sk and ak . Hence we routinely write Ck (sk ; ak ), as we have done so far. However, this is not always the case. For example, a truck driver may know the time it takes to travel from one city to another only when he/she arrives to the next node, as the cost might depend on random events such as other tra¢ c on the road, weather, etc. In such cases the immediate cost is random bk+1 (sk ; ak ; wk+1 ) : C
We can now bring the expectation in (8.2) to the front n o bk+1 (sk ; k (sk )) + Vk+1 (sk+1 ) jsk : Vk (sk ) = min E C ak 2A
110
CHAPTER 8. INTRODUCTION TO MDP
Letting
n o bk+1 (sk ; ak ; wk+1 ) jsk Ck (sk ; ak ) = E C
we can view the Ck (sk ; ak ) in (8.2) as the expected cost given that we are in state sk and take action ak .
8.2
Finite horizon problems
Finite horizon problems arise in two settings. First, some problems may have a speci…c horizon in-built (consider e.g. the truck driver example, where the truck will eventually reach its destination). In the second class the problem is actually in…nite horizon, but the goal is to determine what to do right now given a particular state of the system. Of course, the decisions need to consider the downstream impact, so we extend to the future with a horizon K but consider it to be su¢ cient that K < 1. In control, this is equivalent to the receeding horizon MPC set-up familiar from eariler Chapters, the prediction horizon p now equals the sum of therms K in our cost function. When we encounter a …nite horizon problem, we assume that the terminal cost is given as data, VK (sK ). Often we simply use VK (sK ) = 0 (cf. receeding horizon problems).
8.2.1
Backward dynamic programming
Solving a …nite horizon problem is straightforward using backward dynamic programming: We start from the last instant K and compute the value function for each possible state s 2 S. We then step back to the previous instant k = K 1. This way at instant k we have already computed the future values Vk+1 (s), and we can compute the values Vk (s). The recursion can then continue until the …rst time instant, where it stops. In the form of an algorithm: 1. Initialize the terminal cost(s) VK (sK ). Set k = K 2. Calculate for 8sk 2 S and ak 2 A Q (sk ; ak ) = Ck (sk ; ak ) + Vk (sk )
=
min Q (sk ; ak )
X
1.
pas0k;sk Vk+1 (s0 )
s0 2S
ak
and store the optimal action k
3. If k > 0, set k := k the optimal policy.
(sk ) = arg min Q (sk ; ak ) : ak
1 and return to step 2, otherwise stop.
k ’s
provide
8.3. INFINITE HORIZON PROBLEMS
8.2.2
111
Exercises
Consider the system shown in Fig. 8.1. When travelling from the university to the city center, where to cross the motorway; where to cross the river? 1. Solve the …nite horizon problem by hand on paper using dynamic programmin. The immediate costs c are given in the following table: fromnto 1 2 3 4 5 6 7 8 1 0 2362 1724 1089 2 0 1811 2048 2148 3 0 2500 2550 2600 4 0 3631 3581 3576 5 0 1248 6 0 942 7 0 1078 8 0 2. Implement backward dynamic programming on Matlab and use it to solve the …nite horizon problem.
8.3
In…nite horizon problems
In…nite horizon problems provide an elegant theory to solve complex optimization problems. However, they are restricted to time-invariant problems. This simpli…es the notations, so that we can drop most of the k’s from the equations. Let us begin with the optimality equations Vk (sk ) = min E fCk (sk ; ak ) + Vk+1 (sk+1 ) jsk g : ak 2A
Often, we wish to study time-invariant problems in a steady state. Letting V (s) = limk!1 Vk (sk ) and assuming that the limit exists, we obtain the steadystate optimality equations " # X a 0 V (s) = min C (s; a) + ps0 ;s V (s ) : a2A
s0 2S
It can beP shown that this is equivalent to solving the in…nite horizon problem 1 k min E Ck (sk ; k (sk )) . k=0
8.3.1
Value iteration
Value iteration is the most used algorithm in dynamic programming. It is simple to implement and often provides a "natural" way of solving a problem. It is virtually identical to backward dynamic programming. The basic version of the algorithm is given by the following steps:
112
CHAPTER 8. INTRODUCTION TO MDP
Figure 8.1: Map of Oulu. The university is in the north, the city center in the south (marked by stars). To travel from the university to city center, one …rst needs to cross the motorway (at node 2, 3 or 4), and then the river of Oulu (at node 5, 6 or 7).
8.4. HOMEWORK - MDP
113
1. Initialization: Set v 0 (s) = 0 for 8 s 2 S. Fix a tolerance parameter > 0. Set iteration counter n = 1. 2. For each s 2 S and a 2 A compute Q (s; a) v n (s)
= C (s; a) + =
min Q (s; a)
X
pas0 ;s v n
1
(s0 )
s0 2S
a2A
and store the optimal action (s) = arg min Q (s; a) : a
3. If vn
vn
1
(1 2
)
where kxk is the max norm kxk = maxs jx (s)j, set n := n + 1 and go to step 2. Otherwise let be the policy that solves the problem and stop. The algorithm stops if the largest change in the value of being in any state is less than (12 ) , where is a user speci…ed error tolerance. The Gauss-Seidel variant of the basic algorithm provides a noticeably faster rate of convergence. This version makes use of the fact that in Step 2 the v n (s)’s are computed one-by-one for all the s’s. Instead of using the past v n 1 (s)’s, we can replace them by the updated v n (s)’s for the s’s that have already been visited.
8.3.2
Exercises
1. Implement value iteration using Matlab 2. Examine the behavior of the value iteration algorithm. 3. Verify that the error tolerances are ensured by the algorithm. See Ex_VI.
8.4
Homework - MDP
Background: A sample Matlab code for dynamic programming is available from exercises in this Chapter. A SISO process model needs to be speci…ed (tf/ss/ode/..., cont/discr) Task: For the plant, using Matlab : Formulate a MPC control problem in discrete space [1p]
114
CHAPTER 8. INTRODUCTION TO MDP Design and implement an optimal controller using value iteration. Simulate the closed-loop performance of the system [+2p] Consider a multivariable problem (multivariable process model) and repeat the design/ closed-loop simulations [+2p]
Write a short report and prepare a presentation/ to defend your work.
Chapter 9
Analysis and state estimation We consider the discrete-time dynamic system and measurement equations x (k) = f (x (k 1) ; u (k y (k) = h (x (k) ; v (k))
1) ; w (k
1))
where f :