WSEAS TRANSACTIONS on INFORMATION SCIENCE & APPLICATIONS
Yuanjun Huang, Chengliang Yin, Jianwu Zhang
Modeling and Development of the Real-time Control Strategy For Parallel Hybrid Electric Urban Buses YUANJUN HUANG, CHENGLIANG YIN, JIANWU ZHANG School of Mechanical Engineering Shanghai Jiao Tong University 800 Dongchuan Rd., Shanghai, 200240, CHINA
[email protected] Abstract: - This paper proposes a feed-forward control model for SWB6105 parallel hybrid electric urban bus (PHEUB) by using Matlab/Simulink. In order to optimize the fuel economy, balance the battery state of charge (SOC), and satisfy the requirements of the vehicle performance and drivability as well, a logic threshold torque distribution control strategy (LTTDCS) incorporating with an instantaneous optimization algorithm was developed for the PHEUB. Bench tests results for the key components of the hybrid powertrain are selected as reliable references in the modeling. The control strategy is validated by the simulation results of the engine, the motor and the battery in terms of fuel economy and deviations of battery SOC. Key-Words: - Parallel hybrid electric urban bus (PHEUB), Hybrid powertrain, Hybrid system modeling, Logic threshold torque distribution control strategy (LTTDCS), Instantaneous optimization algorithm, Real-time control optimization control theories, such as instantaneous optimization method and global optimization techniques. Instantaneous optimization control strategy is based on real-time computation of the equivalent fuel consumption and emission at possible operating points [6-8]. Global optimization techniques, such as dynamic programming [9], mathematic programming [10], and optimization algorithms based on classical variational approach [11], are not applicable in real-time control because they require a prior known driving cycle. Currently, they are mainly used for evaluating the quality of other control strategies. Control strategies that are based on the minimization of the fuel consumption seem to be one step ahead of heuristic control strategies that are based upon simple rules and maps. The former, also known as optimal controllers can provide more generality and reduce the need for heavy tuning of the control parameters. Because of the advantages discussed above, a logic threshold torque distribution control strategy incorporating with an instantaneous optimization algorithm for real-time control of a parallel hybrid electric urban bus (PHEUB) is put forward. The logic threshold torque distribution strategy is developed on the basis of engineering empirical experience and the analysis of components efficiency tables and charts. It realizes real-time control the operating modes of the hybrid system and the dynamical transition between these modes. Based on this control strategy, an instantaneous
1 Introduction Powertrain of a parallel hybrid electric vehicle (HEV) is a hybrid system of engine and electric drive system. The drive force requested by the driver is optimally distributed between the engine and the motor under the control of the advanced vehicle control unit (VCU), which is the kernel of the real-time control strategy of the parallel HEV and also one of the key technologies in which many researchers are engaged. The goal of the real-time control strategy is to achieve high efficiency, energy saving and low emissions vehicle by controlling hybrid powertrain system coordinately. The performances of a parallel HEV strongly depend on the control strategy of the hybrid powertrain system, which consists of the engine, electric motor, electrical energy system, automatic clutch, transmissions, etc. Many research works on the control strategy of parallel HEV have been conducted in recent years. In general, these works can be roughly classified into two categories. The first is to employ heuristic control techniques such as logic threshold, fuzzy logic, neural networks and genetic algorithm for estimation and control algorithm development [1-5]. Its basic idea is that it is rule based. Advantages of this method include the ease in handling real-time control typical hybrid system operating modes, dynamic switching among these modes as well as the expandability for integrating vehicle dynamic control in the future. The second category is to use
ISSN: 1790-0832
1113
Issue 7, Volume 5, July 2008
WSEAS TRANSACTIONS on INFORMATION SCIENCE & APPLICATIONS
Yuanjun Huang, Chengliang Yin, Jianwu Zhang
optimization algorithm is introduced to perform real-time optimization for those operating modes that both the engine and the motor are working in. The purpose of the proposed control strategy is to achieve acceptable vehicle performance and drivability requirements while simultaneously maximizing the engine fuel economy and maintaining the battery state of charge (SOC) in its operational range at all times. The rest of this paper is organized as follows: In Section 2, the configuration of the powertrain system and the parameters of the PHEUB are briefly described. Then, the modeling of the PHEUB system is presented in Section 3. Next, the developed control strategy applied in this research is discussed in Section 4. After that, the simulation results for minimum fuel consumption are given in Section 5. And Section 6 is the conclusions.
Table1. Basic parameters of the PHEUB powertrain ICE Type
Diesel engine
Stroke volume
3900 cm3
Peak power
119 kW
Maximum torque
550 N m
EM Type
A.c. induction machine
Peak power
125 kW
Continuous power
45 kW
Rated speed
2500 r/min
Maximum speed
4000 r/min
Battery Type
Nickel metal hybrid (NiMH)
Capacity
55 Ah
Nominal voltage
312 V
Transmission Type
Five-speed automated manual transmission
Gear ratio
6.11/3.39/2.05/1.32/1/5.22
Final reduction gear ratio
4.875
Vehicle
2 System Configuration
Because of the complexity of engine, motor, battery, AMT and other subsystems, it is hard to describe the operating process of each component stated above accurately and thoroughly only by using the analytical method. A complex analytic model will require considerably large computation. Moreover, any simplification and hypothesis used to establish the analytic model will reduce the computation accuracy and make it have no superiority over the purely empirical models. Therefore, a modeling method combining theoretic analysis and experimental data is adopted for current PHEUB research [12-16]. In this method, the performances of the key components of the powertrain, such as the engine, the motor, the battery, etc., are mainly depicted by the experimental data, while the dynamic equation of the vehicle system is still established by using analytic method. In other words, it is essentially a quasi-linear model based on threedimensional performance map. Hybrid powertrain bench test is carried out on the test bed to obtain key component testing data. By using Matlab/Simulink, a feed-forward simulation model is developed based on the powertrain system (showed in Fig.1) and the control strategy (described in section 4). The block diagram is shown in Fig.2.
AIR PUMP
STEER PUMP
ALTERNATOR
COMPRESSOR
ENGINE
DC/DC
COUPLER
one-way clutch
MOTOR NiMH BATTERY
24V BATTERY
0.508 m
3 System Modeling
CLUTCH
BATTERY CONTROLE UNIT
0.79
Rolling radius
AMT
CONVERTER
11140kg
Drag coefficient Wheel
The schematic diagram of the specific PHEUB powertrain system is shown in Fig.1. It’s designed with a diesel engine as the main power source and an AC electric motor as a secondary power source. The motor is installed ahead of the transmission. The output torque of the engine and the motor are coupled into the torque coupler. The output torque is then transmitted into AMT through which the vehicle is propelled in the end. Gear shifting process is controlled by the AMT controller independently. There is a one-way clutch locating between the engine and the torque coupler. The parameters for the main components of the PHEUB powertrain system are listed in Table 1.
TORQUE
Vehicle Curb Weight
Fig.1 Schematic diagram of the PHEUB powertrain
ISSN: 1790-0832
1114
Issue 7, Volume 5, July 2008
WSEAS TRANSACTIONS on INFORMATION SCIENCE & APPLICATIONS
Yuanjun Huang, Chengliang Yin, Jianwu Zhang
Fig.2 Diagram of PHEUB simulation model t
The objective of the engine control for the hybrid powertrain is to keep the engine operating at its high efficiency region as much as possible, which is realized by commanding the exogenous control variables such as the control of fuel feeding system for the diesel engine. The endogenous control variables, such as the exhaust gas recirculation, the air-to-fuel ratio (A/F), etc., are regarded as precalibrated control variables and not considered in modeling. Therefore, the main task for engine modeling is to establish the relationship between the fuel control command, the torque output of the engine and the fuel consumption of the engine. The engine output torque is described as: Te = f (θ , n e )
Qe =
0
t
∫Q
e
(Te , n e )d t
(2)
0
Where Q e (⋅) is a two-dimensional look-up table function. It is constructed by establishing the relationship of the engine fuel consumption Qe versus engine torque Te and engine speed ne , which is shown in Fig.3 (b).
(1)
Where f (⋅) is a two-dimensional look-up table function. It is constructed by establishing the relationship of the engine output torque versus engine fuel control command θ and engine speed ne , which is shown in Fig.3 (a). The fuel consumption is described as: ISSN: 1790-0832
i
∫ Q e dt =
(a) Engine fuel command characteristics
1115
Issue 7, Volume 5, July 2008
WSEAS TRANSACTIONS on INFORMATION SCIENCE & APPLICATIONS
Yuanjun Huang, Chengliang Yin, Jianwu Zhang
for a short period of time. With increasing temperature of the motor, there is a requirement of reducing power output to maintain thermal balance of the motor. Tm_max = f (nm , tm ) (4) Except for the performance limitation imposed by itself, Tm_max is also limited by both the voltage U and the maximum electric current I m_max . Therefore, under the driving mode the Tm_max is determined by the following equation:
⎛ Tm_max = min ⎜ f (nm , tm ), ⎝
9.55
UI m_max ⎞ ⎟ nm ⎠
(5)
If the motor works under the charging mode then Tm_max can be expressed as:
(b) The fuel consumption characteristics of engine
⎛ Tm_max = max ⎜ f (nm , tm ), ⎝
Fig.3 Numerical models of the engine The electric drive system comprises an AC electric motor, an inverter and a motor controller. The motor controller is responsible for regulating the motor torque to meet the torque request commanded by the VCU. The voltage control signals produced by the motor controller are sent to the inverter to generate three-phase PWM voltage, which is used to manipulate the AC motor. In some previous research [17,18], an electromagnetic dynamic model of equivalent circuit was proposed for the investigation of motor’s transient behavior thoroughly. However, time-consuming requirement of the detailed model makes it not suitable for driving-cycle-based vehicle simulation. Therefore, an empirical map-based model is used in this study. The AC Electric motor, inverter and motor controller are regarded as a single system for modeling. The input parameters are motor torque command β m ([0,1]), motor operating mode
9.55
UI m_max ⎞ ⎟ nm ⎠
(6)
The motor electric current I m can be calculated from the following equations:
Pm U ⎧T n / η Pm = ⎨ m m m ⎩ Tm nm ⋅η m
Im =
(7)
Tm ≥ 0 Tm < 0
(8)
where Pm is the motor input(driving mode) or output (charging mode) power, η m is the motor efficiency regarding speed and torque and it is obtained by conducting motor performance test. It can be expressed as: η m = f (Tm , nm ) (9) where f (⋅) is two-dimentional look-up table function depending on the motor output torque and the motor rotational speed which are shown in Fig.4.
command λ m (drive mode, charging mode, racing mode, and speed regulating mode), the bus voltage of the electric source U and the motor speed nm, which is calculated from the rotational dynamic equation in the vehicle model. The output parameters are motor actual output torque Tm , inertia of the rotor shaft J m and the inverter current
I m . Under the control of the drive mode, the motor output torque Tm is described as :
Tm = β m ⋅ Tm_max
(3)
Where Tm_max is the maximum torque the motor can
Fig.4 Numerical models of the traction motor including controller
generate and it is a function of rotational speed and temperature. The motor can operate at peak power ISSN: 1790-0832
1116
Issue 7, Volume 5, July 2008
WSEAS TRANSACTIONS on INFORMATION SCIENCE & APPLICATIONS
Yuanjun Huang, Chengliang Yin, Jianwu Zhang
Fig.5 shows the numerical model of the high power battery pack. The battery model consists of a perfect open circuit voltage source ( U o ) and a resistor (internal resistance, R int ). Both U o and R are the function of the battery SOC ( S c ), battery temperature ( t B ) and the direction of current of flow ( I B ). Battery internal resistance R int can be calculated from the following equation: (10) R int = f ( I B , S C , t B ) The open circuit voltage can be calculated from the following equation: (11) U o = f (SC , tB ) Experimental data of the battery illustrated in Fig.5 (b), Fig.5 (c) and Fig.5 (d) are all used to calculate U o and R . Fig.5 (b) shows the battery pack open circuit voltage. Fig.5 (c) and Fig.5 (d) illustrate the charging and discharging resistance of the battery pack respectively.
(c) Battery pack discharge resistance
(d) Battery pack charge resistance Fig.5 Numerical models for the NiMH battery pack The VCU is the vehicle control unit model that consists of the input module, the control algorithm module, which is the core of the VCU model, and the output module. The functions of the VCU are to accept the driver command and monitor the whole vehicle operating status simultaneously. Its output commands calculated by the control algorithm are used to manipulate the hybrid system executing the corresponding action. The control algorithm is programmed using standard C and wrapped by Simulink S-Function. Therefore, the program can work after being compiled and transferred to the real controller without any modification.
(a) Electric schematic of the NiMH battery
β acc _ pedal
ud
(b) Battery pack open-circuit voltage
Δu
+
-
PI
ΔT
Pedal operation
β brake _ pedal
ua Fig. 6 Input and outputs of the driver model ISSN: 1790-0832
1117
Issue 7, Volume 5, July 2008
WSEAS TRANSACTIONS on INFORMATION SCIENCE & APPLICATIONS
Yuanjun Huang, Chengliang Yin, Jianwu Zhang
modes connected by a single arrow line can only be made by following the direction of the arrow. As for the double arrow line, the mode transition can be made back and forth between these two operating modes connected. Following the principle of mode transition shown in Fig.7, the control of the PHEUB switches between all the operating modes mutually. Which mode the system should be working in is commanded by the VCU. The driver’s accelerator pedal command, shift position, brake pedal effort, current vehicle speed, battery SOC and other vehicle state information are all used to determine the system operating mode.
4 Analysis and Design of the RealTime Control Algorithm Based upon the schematic diagram of the powertrain system shown in Fig.1, all the possible operating modes for the PHEUB are listed in Table 2. They include not only the steady operating modes but also the transient ones. The operating mode transition diagram of the PHEUB, which summarized from the operation modes, is illustrated in Fig.7. In this figure, the ellipse blocks represent the PHEUB steady operating modes; the circular blocks represent the transient ones; the arrow lines between these blocks illustrate the transfer direction of the operating modes. The transition between the two operating
Fig.7 operating mode transition control rule mentioned above whenever the vehicle is operating. It is based on the engineering empirical experiences and the analysis of components efficiency tables and charts, which is a popular and effective design approach. The objective of the LTTDCS is to realize fuel economy optimization by distributing the torque requested by the driver between the engine, the motor and the friction brake system, which can be expressed as: (12) T req = Te + ρ m T m + T b
Table 2. Operation mode classification of the PHEUB Status number
Status description
A
Vehicle stop Pure electric driving mode Start engine Hybrid driving with both engine and motor Vehicle driven by engine alone Driving while charging the battery Coating with engine on Shift gear with engine on Shutdown engine Regenerative braking Friction braking Shift gear with engine off Coasting with engine off
B C D E F G H I J K L M
ρm =
(13)
Where Treq is the torque requested by the driver; Tb ( ≤ 0) is the required torque for the friction brake system to deliver; Tm is the required torque for the motor to supply, and the motor torque is constrained
In this study, a logic threshold torque distribution control strategy (LTTDCS) is introduced to control the switches between the operating modes ISSN: 1790-0832
nm ne
1118
Issue 7, Volume 5, July 2008
WSEAS TRANSACTIONS on INFORMATION SCIENCE & APPLICATIONS
Yuanjun Huang, Chengliang Yin, Jianwu Zhang
optimal efficiency torque curve Teopt ; the engine minimum steady rotary speed working curve n em in ; the engine minimum operating torque curve Teoff . The predefined working curves are shown in Fig. 8.
by the battery security as well as the motor capability; Te is the torque required for the engine to deliver; ρ m is the speed ratio between the motor shaft and the engine shaft; n m , n e are the speed of the motor and the engine respectively. In order to guarantee the efficiency as well as the security of the battery’s charging and discharging performances whenever the parallel HEV is operating, the control strategy should keep the balance of the battery SOC. There are mainly two methods dealing with the battery SOC control for the parallel HEV [16, 17]: The first method is implemented by controlling the SOC between the lower SOC limit ( S L ) and the upper SOC limits ( S H ), which are predefined by the control strategy for the use of the battery. If the actual SOC is less than S L , the battery is actively charged by the hybrid system; If the actual SOC is greater than S H , the hybrid system stops both active charging and passive charging which is regenerated during barking and decelerating. The second method is implemented by defining a target value of SOC ( S T ). Whenever the SOC deviates from the S T , a charge or discharge command is generated by the control strategy to control the SOC closer to the S T . The more the SOC deviates from its target, the higher power the battery is required. For both methods, in order to decrease the energy losses during charging and discharging process, the SOC is always controlled in the region where both internal charge and discharge resistance is relative small. In our work, the first method is selected for battery control. According to the torque requested by the driver, the torque distribution strategy should be analyzed for two different situations: (1) The torque requested by the driver is negative which means that the vehicle is under the braking process. The motor recovers the maximum possible regenerative braking energy within the constrains imposed by the motor, the battery, the brakes and the vehicle stability considerations. The deficiency of the brake torque, if exists, is made up by the friction brakes system. (2) The torque requested by the driver is positive which means that the vehicle is under the driving process; the requested torque is distributed between the engine and the motor. In order to implement the LTTDCS, a couple of engine working curves should be predefined for the engine control [18,19]: the engine maximum torque curve Tem ax ; the engine
ISSN: 1790-0832
Fig.8 Torque distribution strategy for PHEUB Based on the defined engine working curves and the battery SOC, the torque distribution strategy of the parallel HEV can be developed according to the following rules: If n e < n em in , the clutch is disengaged and the motor drives the vehicle alone, where n e is the actual rotation speed of the engine. Under the condition that T req < Tem in : if the battery SOC is relatively high, the motor drives the vehicle individually, and Tereq = 0 ; if battery SOC is relatively low, the engine drives the vehicle and provides excess charge torque, which passes through the motor to charge the battery for keeping the balance of the battery SOC and the enhance load rate of the engine for improvement of the fuel economy, and Tm < 0 . Under the condition that Tem in < T req < Tem ax : if battery SOC is relatively low and there is torque left for the engine besides satisfying the torque requested by the driver, the battery is charged by feeding these residual torque to motor; if battery SOC is relatively high, the vehicle is just driven by engine alone, then Tm = 0 . Whenever T req > Tem ax , which means the engine torque available can not satisfy the requirement of the torque request from driver, the engine drives the vehicle at maximum torque Tem ax and the motor is
1119
Issue 7, Volume 5, July 2008
WSEAS TRANSACTIONS on INFORMATION SCIENCE & APPLICATIONS
Yuanjun Huang, Chengliang Yin, Jianwu Zhang
activated to make up the difference ( T req − Tem ax ) for assistant driving. The control strategy mentioned above is basically a rule-based control strategy. When a certain condition is satisfied, the hybrid system operates in the corresponding mode. For example, under the condition that the acceleration pedal is pressed slightly, while the vehicle velocity is low enough and the battery SOC is high enough, the hybrid system operates in electrical driving mode. Though this control strategy has many advantages, such as that it is simple and easy to be implemented into the C program language codes which makes it acceptable to real-time control application, does not require many lines of code, and computationally efficiency and robust, LTTDCS appears to have some drawbacks, such as the ability to optimize vehicle performance is limited, the engine often operates at non-optimal efficiencies and the charging of the battery is performed at times without consideration the loss paths for the particular operating point. Since the control strategy would not necessarily result in a balance of battery SOC, the battery would probably be charged or discharged over time, and the controller would eventually have to switch to a charging or discharging mode forcibly to restore the battery charge. The overall efficiency of the hybrid system will be compromised, even though the overall efficiency before is relatively high. In order to overcome these drawbacks and make the hybrid system work in the maximum overall efficiency, an instantaneous optimization algorithm is introduced to rectify the LTTDCS. The purpose is to keep the balance of the battery SOC and utilize the vehicular energy more effectively than before. The advantage of the introduced optimization algorithm is that it not only considers the efficiency losses and the free regenerative energy, but also meets the requirement of real time control [18]. Since the objective of optimization is the engine operating point, once the system enters into the operating modes where the engine is wording in, control command is generated to shift the engine operating point closer to the points, which make the overall efficiency of the hybrid system more optimal. The optimization algorithm of the engine operating points is described as the following steps: (1) Setup the fuel consumption look-up table ( Q e,t ) indexed by the engine torque and the engine
(3) Determine the feasible working range by using the following equation. T m = T m ,nm ax : Ts : T m ,pm ax
Where Tm is the motor output torque of each valid candidate operating point; Tm ,nm ax and Tm ,pm ax are the maximum negative and positive torque of the motor respectively; T s is the calculation step of the motor torque, the smaller the T s is, the better the calculation results would be. (4) Calculate the fuel consumption Q i for each candidate operating point by looking up the map of the fuel consumption table Q e , t . For the point where Tm = 0 , the fuel consumption is denoted as Q 0 .
(5) Calculate the Δ S c, i generated by Tm for each candidate operating point by looking up the battery SOC variation table Q s,t . It is noteworthy that positive motor torque generates negative Δ S c while negative one generates positive Δ S c . (6) Calculate the regenerative energy Δ S c , r based on the statistics of typical driving cycles and the past driving data. Δ S c , r is used to correct the Δ S c,
in step (5): Δ S c , i = Δ S c , i + Δ S c , r . Although the electricity energy obtained from the vehicle kinetic energy recaptured by the regenerative braking cannot be predicted beforehand, it can be estimated by tracking the regenerative energy during the driving cycle and averaging it over a certain time period. (7) Setup the look-up table Q c , Δ by establishing the relationship between Q i and Δ S c , i from step (4)~(6). (8) Calculate the actual SOC change Δ S c , a during a time step for each candidate operating points. In order to keep the battery chargesustain, the amount of the electricity energy consumed at current time step must be compensated in the future. Therefore, the amount of SOC compensation should be: Δ S c , c = − Δ S c , a . Its corresponding engine fuel consumption Q e , c can be obtained by looking up table Q c , Δ from step (7). The equivalent compensate Δ S c ,
fuel consumption used to is denoted as Q c , i , which can c
be calculated by the equation Q c , i = Q e , c − Q 0 . (9) The equivalent fuel consumption needed to compensate the equal Δ S c at different SOC level should be different. In order to regulate the price of electricity with different SOC, a penalty function
speed. (2) Setup the battery SOC variation look-up table of the ( Q s,t ) indexed by the input or output power of the battery and the battery SOC.
ISSN: 1790-0832
i
1120
Issue 7, Volume 5, July 2008
WSEAS TRANSACTIONS on INFORMATION SCIENCE & APPLICATIONS
Yuanjun Huang, Chengliang Yin, Jianwu Zhang
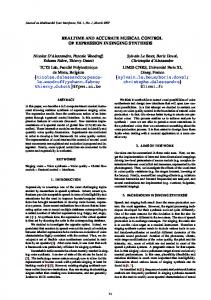
the acceleration pedal, braking pedal and the gear shift handle which represents the driver’s intention; and then, the optimization algorithm is utilized to search for the optimal working points inside the desired operation mode, and move the working point closer to the optimal operating point.
which is shown in Fig. 9 is introduced to correct the equivalent fuel consumption: Q e , r = Q c , i ⋅ f ( soc ) , where Q e , r is the corrected equivalent fuel consumption [20].
1 Start For i=1:n Define working area:
Tm,i =Tm,nmax : Ts : Tm,pmax For i=1:n Te,i=Treq-Tm,i Compute the fuel consumption for each candidate operating point:
Qi= Qe,t(Te,i ,ne)
Fig. 9 Penalty function for SOC correction total fuel (10) Calculate t he consumption Q t , i = Q i + Q e , r . (11) Repeat step (8)~(10), Calculate Q t , i for each candidate operating point. According to the operating mode transition control rule as well as vehicle current operating mode, the minimum fuel consumption operating point is selected as the most optimal operating point The flowchart of the optimization control algorithm is shown in Fig. 10. The implementation of the proposed controller within the vehicle is depicted in the control scheme shown in Fig.11. The proposed control strategy is composed of two modules: one is the LTTDCS module; the other is the instantaneous optimization algorithm module. The whole control process is described as follows: first, the LTTDCS is used to determine the desired destination operating mode based on the feedback vehicle information such as vehicle actual speed, engine actual engine, motor actual speed, battery SOC, gear location and clutch status as well as the sampled A/D information from
ISSN: 1790-0832
Determine the corresponding SOC compensation based on SOC variation:
ΔS c , c = − ΔS c , i
Compute the corresponding engine fuel consumption based on SOC variation ΔS c , c :
Qe , c = Qe , Δ (ΔS c , i )
Compute the corresponding equivalent fuel consumption corresponding to SOC variation ΔS c , c :
Tm,i==0
Qc ,i=Qe ,c-Q0
Qi=Q0
Correct the equivalent fuel consumption for each candidate operating point:
Compute SOC variation ΔS c , i generated by Tm for each candidate operating point:
ΔS c, i = Qs ,t(Tm,i , ,nm, SOC)
Correct SOC variation ΔS c , i by regenerative engergy ΔS c, r for each candidate operating point:
Qe, r = Qc, i·f(soc) Compute overall fuel consumption for each candidate operating point:
Qt, i =Qi + Qe, r
ΔS c , i = Δ S c , i + Δ S c , r
Get the minimum value of the fuel consumption and record the corresponding index: Qopt = min(Qt, i); p = i;
Establishing relationship table between fuel consumption Qi and SOC variation ΔS c , i :
Get the optimal operating point:
Qe , Δ ( ΔSc , i )
Tm=Tm, p, Te=Te, p End
1
Fig.10 Flowchart of the optimization control algorithm
1121
Issue 7, Volume 5, July 2008
Yuanjun Huang, Chengliang Yin, Jianwu Zhang
Op
era
le Ru
Driver intention
tin g
WSEAS TRANSACTIONS on INFORMATION SCIENCE & APPLICATIONS
Fig.11 Implementation of the proposed control strategy controller in applied PHEUB
5 Validation of the Control Strategy In order to use the simulation model developed in Section 3, many simulations are performed to validate the proposed control algorithm (Optimal Control Strategy, OCS). The simulation results over the China Typical Bus Driving Schedule at Urban District (CTBDS_UD) with the initial SOC of 0.5 and 0.7 are shown in Fig.12(a) and Fig.12(b) respectively, which illustrate the engine torque ( Te ), the motor torque ( Tm ) as well as the driver’s request torque ( T req ) by interpreting acceleration and brake pedal. The battery SOC and the vehicle velocity variations ( u a ) are also record and presented in the figures. Fig. 12 also reveals that the SOC remains within the operational range in spite of the initial SOC. From Fig.12(c), which presents the changes of the SOC over a long time horizon simulation (3 CTBDS_UDs), it can be observed obviously that the proposed control strategy works very well in maintaining the SOC. At the beginning, the SOC is relatively low (0.3) and the control strategy uses the engine mostly to recharge the battery in addition to satisfying the vehicle requirement. With the increase of the SOC, the electricity usage increases. The simulation results demonstrate that the proposed control strategy is effective in maintaining the SOC.
ISSN: 1790-0832
(a) With the initial SOC of 0.7
1122
Issue 7, Volume 5, July 2008
WSEAS TRANSACTIONS on INFORMATION SCIENCE & APPLICATIONS
Yuanjun Huang, Chengliang Yin, Jianwu Zhang
(b) With the initial SOC of 0.5
(b) With the initial SOC of 0.5 Fig. 13 Simulation results using LTTDCS
(c) Change of the SOC over a long time horizon simulation.
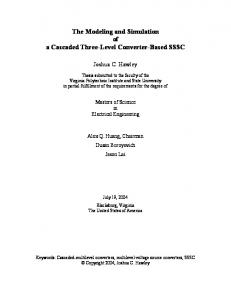
In order to investigate the behaviors of the engine, the engine operating points (sample time is 1s) are calculated and scattered into the torquespeed plane with the initial SOC value of 0.7 for two different control strategies, as shown in Fig.14. The background of the figure is made up of fuel efficiency contours and the maximum torque curve of the engine. For the OCS, the operating points of the engine are mostly concentrated in the high efficiency range; while for the LTTDCS, the operating points of the engine are spread out over the map and many of them are in the low load and low efficiency range. This indicates that the OCS is more effective in controlling the engine operating in high efficiency range. In addition, it is necessary to explain that some of the points near the coordinate axis are not the real engine working points. They are the transition points of the engine during start or stop process, which are sampled by the simulation model.
Fig. 12 Simulation results using OCS Fig.13 presents the simulation results using the logic torque distribution strategy without optimization algorithm (LTTDCS). It is observed from the comparisons between Fig.13 and Fig.12 that, the engine load is relatively high over the cycle in Fig.13, while relatively small in Fig.13. The engine probably frequently operates in non-highefficiency range using the LTTDCS .
(a) With the initial SOC of 0.7
(a) LTTDCS
ISSN: 1790-0832
1123
Issue 7, Volume 5, July 2008
WSEAS TRANSACTIONS on INFORMATION SCIENCE & APPLICATIONS
Yuanjun Huang, Chengliang Yin, Jianwu Zhang
Table 3. Fuel economy simulation comparison between LTTDCS and OCS Average efficiency
(b) OCS Fig.14 Operating points of the engine with the initial SOC of 0.7 using (a) the LTTDCS (b) OTCS on CTBDS_UD.
LTTDCS
Engine (%)
35.45
29.42
Motoring (%)
85.81
78.93
Generating (%)
86.35
82.91
Battery discharging (%)
91.84
90.24
Battery charging (%)
88.79
91.65
Drivetrain (%)
96.42
95.5
Initial SOC (%)
70
End SOC (%)
68
Fuel economy (L/100km)
25.12
23.25
Fuel economy with SOC correction Qs/(L/100km)
25.72
29.36
70 55
6 Conclusion The real-time optimal control strategy is the key technology for PHEUB. In this paper, a novel control strategy using torque distribution strategy is proposed with the corporation of instantaneous optimization algorithm. This control strategy is developed in two steps: First, logic torque distribution control rules are summarized by utilizing engineering intuition and analysis of component efficiency tables or charts; Next, an instantaneous optimization algorithm is applied to conquer the inherit deficiencies of the current torque distribution strategy and therefore achieve relatively higher overall energy efficiency. Experimental data of the engine, the motor and the battery are used for the feed-forward system modeling of PHEUB by using Matlab/Simulink. Simulation results manifest that not only the fuel economy of PHEUB is improved significantly but also the battery SOC maintains within its operating range while satisfying the requirement of the driver. In summary, the proposed method that integrating theoretical algorithm with engineering practical experiences is feasible, and the real-time control strategy presented in this paper is effective and practical. As for the future research regarding modeling and the development of the control strategy for parallel hybrid electric urban buses, two aspect contents should be added. One is for system modeling, the other is for system control. As for modeling of the hybrid powertrain system, there is a requirement to increase the precision of the existing model. Moreover, in order to investigate the dynamic control of the gear-shifting process and operating mode transfer, a transient dynamic simulation model of the HEV should be proposed to facillate the research and development of the vehicle control
The comparisons of the fuel economy results as well as the efficiencies of the main components between OCS and LTTDCS over CTBDS_UD with the initial SOC of 0.7 are summarized in Table 3. The data in Table 3 demonstrate again that the OCS is more effective than the LTTDCS in keeping the engine operating at high efficiencies. The average efficiency of the engine for the OCS is 35.45%, while that for the LTTDCS is only 29.42%. No significant difference exists between the average efficiencies of the two strategies for the motor and the battery, because the efficiencies of the motor and the battery are relatively high inherently, and the high efficiency ranges are much wider and insensitive to load. Although the fuel economy for the LTTDCS (23.25 L/100 km) is less than that for the OCS (25.12 L/100 km), the SOC drops only by 2% for the OCS while by 15% for the LTTDCS. Nine sets of fuel economy and SOC change results are obtained by simulation over the same driving cycle seven times with different initial SOC from 0.3 to 0.7 for each run. A linear regression is used to calculate the corrected fuel economy corresponding to the zero SOC change over the cycle. The corrected fuel economy for the OCS is 25.72 L/100 km and for the LTTDCS is 29.36 L/100 km. It is thus obvious that the OCS is superior to the LTTDCS in terms of fuel economy.
ISSN: 1790-0832
OCS
results
1124
Issue 7, Volume 5, July 2008
WSEAS TRANSACTIONS on INFORMATION SCIENCE & APPLICATIONS
Yuanjun Huang, Chengliang Yin, Jianwu Zhang
18 th International Electric Vehicle Symposium, Berlin, Germany, 2001. [11] Delprat, S., et al., Optimal control of a parallel powertrain: from global optimization to real time control strategy, Proceedings of the 18th International Electric Vehicle Symposium, Berlin, Germany, 2001. [12] Powell, B., et al., Dynamic modeling and control of hybrid electric vehicle powertrain system, IEEE Control System Managemnt, Vol.18, No.5, 1998, pp.17-33. [13] Karen, L., et al., Matlab-Based Modeling and Simulation Package for Electric and Hybrid Electric Vehicle Desing, IEEE Transaction of Vehicular Technology, Vol.48, No.6, 1999, pp.1 770-1 778. [14] Pu, J., et al., Modeling and development of the control strategy for a hybrid car, Journal of Shanghai Jiaotong University, Vol.38, No.11, 2004, pp.1917-1921. [15] Johnson, V. H. Battery performance models in ADVISOR, Journal of Power Sources, Vol.110, No.2, 2002, pp.321-329. [16] Dong ,Y. H., et al., A new type compositive hybrid power system-E.T.Driver and its application in HEV. WSEAS Transactions on Systems, Vol.7, No.3, 2008, pp.203-218. [17] Lee, Y. B., et al., Design and performance analysis of air blower system operated with BLDC motor for PEM FC vehicle, WSEAS Transaction on Systems, Vol.4, No9, 2005, pp.1573-1580. [18] EI-Sousy, F.M., et al., Fuzzy adaptive neuralnetwork model-following speed control for PMSM drives. WSEAS Transactions on Systems, Vol4, No4, 2005, pp.256-259. [19] Fukuo K, et al., Development of the ultra-lowfuel-consumption hybrid car-INSIGHT. JSAE Review, Vol.22, No.4, 2001, pp.95-103. [20] Sasaki, S., et al., Toyota’s newly developed electric gasoline engine hybrid powertrain system, Proceedings of the 14th International Electric Vehicle Sysmposium, Orlando, Florida, USA, 1997. [21] Niels, J. S., et al., Fuzzy logic control for parallel hybrid vehicles. IEEE Transaction on Control Systems Technology, Vol.10, No.3, 2002, pp.460-468. [22] PU, J., et al., Fuzzy torque control strategy for parallel hybrid electric vehicles. International Journal of Automotive Technology, Vol.6, No.5, 2005, pp.529-536. [23] Paganelli, G., et al., Control development for a hybrid-electric sport-utility vehicle: strategy, implementation and field test results.
strategy. Another aspect of the contents is that the function of the fault protection and processing during the vehicle driving should be add to the control strategy.
Acknowledgments This project is supported by Science and Technology Commission of Shanghai Municipality China (Key Technology Research Project for Hybrid Electric Urban Bus, No. 033012017). References: [1] Lin, C. C., et al., Integrated, feed-forward hybrid electric vehicle simulation in Simulink and its use for power management studies. SAE Paper No. 2001-01-1334, 2001. [2] Koo, E. S., et al, Torque control strategy for a parallel-hybrid vehicle using fuzzy logic, Proceedings of the 1998 IEEE Industry Application Conference, St.Louis, Missouri, USA, 1998, pp.1715-1720. [3] Lee, H. D., et al, Fuzzy-logic-based torque control strategy for parallel-type hybrid electric vehicle, IEEE Transaction on Industrial Electronics, Vol.45, No.4, 1998, pp.625-632. [4] Schouten, N. J., et al., Fuzzy logic control for parallel hybrid vehicles, IEEE Transaction on Control Systems Technology, Vol.10, No.3, 2002, pp.460-468. [5] Schouten, N. J., et al., Energy management strategies for parallel hybrid vehicles using fuzzy logic. Control Engineering Practice, Vol.11, No.2, 2003, pp.171-177. [6] Johnson, V. H., et al., HEV control strategy for real-time optimization of fuel economy and emissions. SAE Technical Paper, 2000-011543, 2000. [7] Paganelli, G., et al., General supervisory control policy for the energy optimization of charge-sustaining hybrid electric vehicles. JSAE Review, Vol.22, No.4, 2001, pp.511-518. [8] Paganelli, G., et al., Simulation and assessment of power control strategies for a parallel hybrid car. Proceeding of Institute of the Mechanical Engieers Part D: Journal of the Automobile Engineering, Vol.214, No.7, 2000, pp.705-717. [9] Lin, C. C., et al., Power management strategy for a parallel hybrid electric truck, IEEE Transaction on Control Systems Technology, Vol.11, No.6, 2003, pp.839-849. [10] Galdi, V., et al., Multiobjective optimization for fuel economy and emission of HEV using the goal-attainment method, Proceedings of the
ISSN: 1790-0832
1125
Issue 7, Volume 5, July 2008
WSEAS TRANSACTIONS on INFORMATION SCIENCE & APPLICATIONS
Yuanjun Huang, Chengliang Yin, Jianwu Zhang
Proceedings of the American Control Conference, Arlington, Virginia, USA, 2001,
ISSN: 1790-0832
pp.5064-5069.
1126
Issue 7, Volume 5, July 2008