Modeling and Querying Vague Spatial Objects Using Shapelets Daniel Zinn
Jim Bosch
Michael Gertz
Dept. of Computer Science University of California, Davis
[email protected]
Dept. of Physics University of California, Davis
[email protected]
Dept. of Computer Science University of California, Davis
[email protected]
ABSTRACT
localized and have metadata that should be associated with distinct objects, such as agricultural chemical applications, sensor coverage maps, and vegetation levels. Together, modeling such real-world phenomena motivates a new data type for spatial databases to describe these vague spatial objects. Other terms employed in the literature include uncertain or fuzzy regions. We will use vague to refer to the entire category, and reserve fuzzy regions to refer to a common and well-developed subclass. Most work on vague spatial objects to date has focused on the definition of an algebra using fuzzy set theory [1, 8, 11, 15], which generalizes the data model for standard vectorbased crisp regions. These fuzzy regions associate with each object a field, the membership function, which is one in regions inside the object, zero outside the object, and between zero and one in the fuzzy boundaries. An implementation based on contours of polygons is usually assumed in such works, though it appears no such implementation exists to date. Note that the algebra is based on a normalization of the maximum value of the field to unity; no point can belong more than 100% to a given object. The integral of the membership function is generally considered unimportant, or at least secondary. Another important way of quantifying the uncertainty or vagueness of a spatial object is by mapping it to a probability density function (c.f. [5, 17]). This may represent the probability of finding a certain object at various points in space. In this case, it is the integral of the field over all space that is normalized to one, and while the location of the peak may be important (being the mode of the distribution), the probability value at that point is not. In addition, one always integrates over some region to calculate probabilities rather than simply evaluating the function at a point. Each of these two normalization schemes – maximumnormalization and integral-normalization – has a fairly welldefined set of high-level operations that generalize the most familiar operations for standard, crisp spatial data, ranging from topological operations such as intersection and overlap to metric operations such as centroid and width. For the maximum-normalization scheme, this is the algebra developed by Schneider and others [1, 8, 11, 15], and for integralnormalization, the standard laws of probability theory apply. While a complete discussion is beyond the scope of this paper, Section 2 includes a brief review and comparison of these operations. First, however, it is important to note that most vague spatial objects do not clearly fall into one of these categories, though they can still have quantifiable fields associ-
Research in modeling and querying spatial data has primarily focused on traditional “crisp” spatial objects with exact location and spatial extent. More recent work, however, has begun to address the need for spatial data types describing spatial phenomena that cannot be modeled by objects having sharp boundaries. Other work has focused on point objects whose location is not precisely known and is typically described using a probability distribution. In this paper, we present a new technique for modeling and querying vague spatial objects. Using shapelets, an image decomposition technique developed in astronomy, as base data type, we introduce a comprehensive set of lowlevel operations that provide building blocks for versatile high-level operations on vague spatial objects. In addition, we describe an implementation of this data model as an extension to PostgreSQL, including an indexing technique for shapelet objects. Unlike existing techniques for modeling and querying vague or fuzzy data, our approach is optimized for localized, smoothly varying spatial objects, and as such is more suitable for many real-world datasets.
1. 1.1
INTRODUCTION Motivation
Spatial database systems are used to store, maintain, and process data that has an associated location and/or physical extent. Most work has focused on traditionally distinct vector and field data types. The former associates precise geometric objects, such as points, lines, and polygons, with rows in a database, while the latter is generally approached using raster image techniques. Many spatial objects blur the line between the two, however; some regions do not have crisply-defined borders that can be mapped easily to polygons. Many types of demographic regions, such as language, cultural, or even historical regions clearly fall into this category, as do ecological regions such as animal habitats. Likewise, many fields are
Permission to copy without fee all or part of this material is granted provided that the copies are not made or distributed for direct commercial advantage, the VLDB copyright notice and the title of the publication and its date appear, and notice is given that copying is by permission of the Very Large Data Base Endowment. To copy otherwise, or to republish, to post on servers or to redistribute to lists, requires a fee and/or special permission from the publisher, ACM. VLDB ‘07, September 23-28, 2007, Vienna, Austria. Copyright 2007 VLDB Endowment, ACM 978-1-59593-649-3/07/09.
567
2.
ated with them. Rainfall or windspeed can define the “location” of a tropical storm, just as a galaxy can be defined by its surface brightness, and a city or animal habitat can be defined by its population density. While many fields are not at all localized and are more appropriately dealt with using traditional raster image methods, many others (such as those mentioned above) are strongly localized, and it is often useful to associate a distinct field with each object. Furthermore, it is often useful to ask questions that involve generalizations of familiar operations on spatial data, such as “what is the radius of this hurricane?”, “what is the center of this city?”, “how much do these galaxies overlap?”, or “what is the intersection of these two species’ habitats?”. To address these questions, it is necessary to impose a normalization scheme. Which scheme to choose depends on the data and the questions being asked, but in many cases the choice is somewhat arbitrary, and either scheme will work equally well. In others it will be clearly ideal to have both available and to form some new, hybrid scheme. The choice of either of the above schemes (or the choice of a hybrid) thus amounts to a choice about how to generalize standard, non-vague operations on spatial data into operations appropriate for vague data. For each non-vague operation, such a choice defines a corresponding field operation, whether that field represents the membership function of a fuzzy region, a probability distribution, or something else entirely.
1.2
CORE OPERATIONS AND LOW LEVEL COUNTERPARTS
By focusing on the most “pure” examples of the two normalization schemes described above, fuzzy regions and spatial probability distributions, and selecting a set of “core” operations on traditional spatial data to be generalized, it is possible to define a relatively small set of low-level field operations that support a much wider range of both high-level operations and types of data. These low-level operators can then be used as building blocks for higher-level operators, whose definitions may vary for different types of vague spatial data. The definitions below are largely due to the work of Schneider and collaborators [1, 8, 11, 15] or the common results of probability theory. We refer the reader there for motivations and proofs; our goal here is to combine these definitions to produce a set of operations that includes both cases, and is thus more generally applicable. We make no claims about the ability of an implementation that supports these low-level operations on localized fields to meet all the high-level needs of any one type of vague spatial data, or its ability to support a single high-level operation for all types of data. However, an implementation that supports the low-level operations defined below will likely support most of the needs of most types of vague spatial data, and it will hence be useful at the very least as a starting point for more specialized implementations. Below, we will use capital letters (F and G) to represent high-level vague spatial objects and corresponding lowercase letters (f (x, y) and g(x, y)) to refer to their fields. A summary of our core operations and the “translations” described below is given in Fig. 1.
Contributions
Rather than representing vague spatial objects using contours, or the other obvious choice, raster images, we present a new approach. Our approach centers around a new data type, called shapelet, which is based on an image decomposition technique developed in astronomy [13]. By examining the operator definitions for both fuzzy regions and probability distributions, we develop a comprehensive set of low-level field operations on shapelets that support a set of “core” high-level operators on vague spatial objects for both normalization schemes. The operations include standard topological operations (intersection, union, and overlap), metric operations (area, width/height, and centroid), and geometric transforms (scale, center, translate, and rotate). We present an implementation of this new technique for modeling and querying vague spatial objects in PostgreSQL. Based on a new shapelet column type, we illustrate the implementation of low-level field operations and a set of highlevel “vague spatial object” operations, realized as easy-touse stored procedures that utilize the low-level operations. Using real-world astronomy data, we provide sample queries that demonstrate the versatility of this technique. In addition, we describe an indexing technique that uses the R-tree implementation in PostgreSQL for threshold-based indexing of shapelets and significantly improves query performance. The paper is organized as follows. In Section 2, we “translate” the high-level operators defined for fuzzy regions and probability distributions into a set of low-level field operations. In Section 3, we describe the mathematical details of shapelets that allow us to realize these low-level operations. Section 4 details our implementation framework in PostgreSQL and an experimental evaluation of the proposed model using different examples. We address related and future work in Section 5 and Section 6, respectively.
Topological Functions Intersection, Union, Overlap, Point Queries, Window Queries Metric Functions
Fuzzy Regions / Maximum
Probability Distributions /
Normalized Data
IntegralNormalized Data
Pointwise minimum/maximum
Pointwise arithmetic
Global minimum/maximum
Integrals
Pointwise evaluation Valuebased contours
Integralbased contours
Centroid, Height/Width, Area
Integral Moments
Geometric Transforms
Rotation, Translation, Scale
Figure 1: Core operations on fuzzy regions and probability distributions and their low-level field counterparts.
2.1
Topological Operations
While many topological operations are defined for point-, line-, and polygon-based data, the most important ones for standard two-dimensional vector objects are intersection and union. In addition, the predicate of “whether the intersection exists”, which we will call overlap, is also often quite useful in its own right, even when the intersection object itself may have no physical meaning. For vague data, one can imagine either a Boolean-valued or real-valued overlap function. Because the former merely involves comparing the latter to some threshold value, we will define the overlap as a real-valued function for vague data. For fuzzy regions, the generalization of intersection and
568
union follows the generalization of standard set theory to fuzzy set theory, and require operations that take the pointwise minimum or maximum of two fields. F ∩ G := min{f (x, y), g(x, y)}
(1)
F ∪ G := max{f (x, y), g(x, y)}
(2)
It is often useful to ask “to what degree does a point belong to a fuzzy region?”. This, of course, simply requires being able to evaluate the field at a point. The definition of intersection, union, and overlap for data that is non-normalized (like the storms, cities, or galaxies mentioned above) is more problematic, but most logical choices unsurprisingly involve one of the above definitions with a temporary normalization. Instead of normalizing the fields themselves, one could define a normalized overlap operator, for instance, as RR f (x, y) g(x, y)dx dy RR overlap(F, G) := RR (5) ( f (x, y)dx dy)( g(x, y)dx dy)
For probability distributions, the intersection is just the joint probability, which for independent distributions is just their product: F ∩ G := f (x, y)g(x, y)
(3)
The union operation (the probability of F or G) is traditionally defined as: F ∪ G := f (x, y) + g(x, y) − f (x, y)g(x, y)
or by similarly dividing the fuzzy region definition of overlap by the maximum value of f or g.1 There are other possible choices. One could define an asymmetric overlap operation by dividing by the integral of the first object squared, for instance. Most reasonable operators on unnormalized data will follow the pattern of the above examples: they will be normalizing versions of the fuzzy region or probabilistic operations and will simply require an additional min/max operation or integral to compute. The low-level operations required, in most cases, remain the same:
(4)
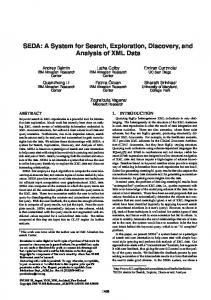
Given an intersection field, one typically defines the overlap for fuzzy regions as the global maximum of the intersection field. For probability distributions, one computes the integral of the intersection field over all space. 1
0.8
0.6
f(x) g(x) intersection union [min(f,g)] - [f·g] [f+g-f·g] - [max(f,g)]
• For fuzzy regions, pointwise min/max operations and global min/max operations. • For probability distributions, pointwise arithmetic and definite integrals (both over all space and over some finite region).
0.4
2.2 0.2
Metric Operations
One straightforward way to generalize metric quantities such as width or area is to define some threshold-based contour and measure that. For fuzzy regions, this is naturally a value threshold, producing a traditional crisp region such that the value of the field on the contour is equal to the threshold. For probability distributions, the more natural choice is a confidence contour, a region that encloses some fraction of the total integral. Determining such contours from images or through numerical sampling of a function is a large subject in its own right [6], and represents one of the more complicated low-level operations desired for a representation of vague objects. However, a less versatile but simpler approach to metric operations exists. It is applicable to both fuzzy regions and probability distributions, though its use is more familiar with regard to the latter. In a given direction, say along the x-axis, we can define a root-mean-square (rms) width, or standard deviation, as the square root of the second integral moment about the center: –1/2 » RR 2 x f (x, y)dx dy R R width(F ) := (6) f (x, y)dx dy
0
Figure 2: Comparison of min/max definitions of intersection and union with arithmetic definitions of the same for a one-dimensional field. It is also worth noting that the probabilistic definitions of intersection and union, if applied to maximum-normalized fields, yield a very good approximation to the min/max definitions for these operations, as shown in Fig. 2. Most importantly, they preserve this normalization, as the results are still bounded by zero and one if the inputs are. The converse is not true; pointwise min/max operations do not preserve the total integral. Also note that given smooth data, the min/max definitions can produce non-smooth intersections and unions, while the arithmetic definitions preserve the smoothness. This may be an important hint about the best choice of a normalization scheme, at least with regards to topological operations for data that is intrinsically smooth. It can also be useful to define topological operations between vague spatial objects and traditional regions. We can simply define a Boolean-valued field for the traditional region and proceed as above in most cases. But the overlap is more simply viewed as finding a maximum in a window for fuzzy regions, or integrating in a window for probabilities. For rectangle-shaped traditional regions, this overlap also serves as the generalization of the ubiquitous window query, which, for vague spatial data, asks “To what degree is an object inside a rectangle?” For fuzzy regions, operations between vague regions and points are also important.
To simplify notation (and computation) it is assumed that the object is centered on the origin; if it is not, the true centroid can be found from the first integral moment (the mean), and the object translated to the origin. By rotating the coordinate system (or by some equivalent operation), we can find an rms width in any direction, which, together with the centroid, defines a crisp region whose area and other 1 Here, and throughout the paper, we will omit the limits of integration if the integration is over all space.
569
properties provide a meaningful definition of the corresponding metric operations for the vague object. These definitions of metric operations add to our set of desired low-level operations:
a computationally complex, if conceptually straightforward, task. In addition, contour representations are also inefficient for inherently smooth data. Most operations here will scale with the total number of vertices, though even with this scaling some operations (such as contour-finding) are clearly easier than for image data, regardless of the number of vertices. A better choice for smooth data, and one we explore further here, is the use of generalized analytic functions that are represented by their series expansions. That is, a function f is represented by the coefficients an of its expansion onto a certain set of “basis functions” φn :
• contour construction • integral moments (or at least means and standard deviations)
2.3
Geometric Transforms
A third set of requirements for a field representation is provided by the common need for standard geometric transforms, such as rotation, scaling, and translation. At the very least, these are needed to support the vast number of map projections and coordinate systems spatial databases are expected to handle [20]. In addition, geometric transforms may provide important pieces of other operators, such as the rotations and translations desired for moment-based metric operations mentioned above. As long as individual objects are small compared with any curvature in a coordinate system (most often the radius of the Earth), support for affine transforms (those that preserve parallel lines) will often suffice, as we can approximate a full projective transform as a projective transform on the centroid and an affine transform on the object itself. An affine transform in two dimensions can be written as a matrix of the form 2 3 a11 a12 tx 4 a21 a22 ty 5 (7) 0 0 1
f (x, y) =
an φn (x, y)
(8)
n=0
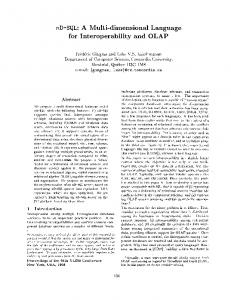
In practice, this decomposition is carried out with a finite set of coefficients an , so the challenge is to determine a suitable basis φn that allows the data to be approximated well by only a few elements in the above sum. Most operations will then scale with the number of coefficients. Both Fourier transforms and wavelet transforms are examples of this technique, and they have been shown to be extremely useful for many image processing tasks that are related to the low-level field operations mentioned above. Fourier transforms, which use sine and cosine functions as a basis, are not localized, making them a poor choice for localized objects. Wavelets, which form a basis by scaling and shifting an object with an otherwise fixed shape, transform N -dimensional images into a 2N -dimensional coefficient space (for a review of wavelet techniques see [12]). The definition of geometric transforms in this space presents a difficult obstacle. An alternative, which we will adopt here, is shapelets, a decomposition technique that defines a set of localized basis functions with a single scale and location but varying shapes. Figure 3 depicts chosen “original” data and approximations using the different representations qualitatively. The quantitative deviations from the original, high resolution, images are shown in Fig. 4. The polygon error values are admittedly less than optimal, as we could not find a vertexlimited contour algorithm to create the “best fit” polygons. We instead relied on a mostly heuristic reduction of vertices from a more complete contour. Note that the polygon and image representations tend to discretize (in different ways) smooth objects, while the shapelet method (discussed extensively below) blurs sharp objects. While the Shapelet representation is unsurprisingly good for the Gaussian image, it also outperforms the other representations in many other respects, which is particularly remarkable considering that the third and fourth images were intended to be more ideal for the image and polygon representations, respectively.
which acts on a coordinate vector [x y 1]. The tx and ty elements are purely associated with the translation part of the transform. Conveniently, a singular value decomposition of the two-by-two matrix aij yields a rotation matrix, a diagonal scaling matrix, and another rotation matrix. To represent the full set of affine transforms for our field, then, it is sufficient to be able to rotate, scale, and translate. While the definitions of most geometric transforms do not depend on the normalization scheme, the scaling operator does. When changing the physical size of a field, one can choose to either preserve the value of the field at individual points, or to preserve the total integral of the field. The former is clearly appropriate for maximum-normalized data, and the latter is clearly appropriate for integral-normalized data.
2.4
∞ X
Representations of Localized Fields
A full analysis and comparison of the many ways of representing a localized field is a huge topic in its own right, and we will not attempt to do it justice here. To motivate our new technique, however, we will present a very rudimentary survey of two other proposed approaches. A standard raster image represents a field very well in some respects, but it is limited to rectangular regions and is not as efficient for smooth data. Certainly all of the above low-level operations are well understood for raster images, and their computational and storage complexity scale with the number of pixels. A representation type often assumed in the literature is that of contour polygons, where a set of standard, “crisp” regions represent different levels of a fuzzy region [15]. In this case, the above low-level operations can be reduced to similar well-understood operations on polygons, but this may be
3.
REPRESENTING LOCALIZED FIELDS WITH SHAPELETS
The shapelet basis can be seen as a set of functions that “perturb” the standard Gaussian function (also known as the Normal distribution in statistics). The first term in the decomposition is the Gaussian function itself, and the higher-order terms involve products of the Gaussian with a special set of polynomials. Because of the “bell-shaped” Gaussian curve factor, shapelets are excellent for representing localized objects (and ideal for nearly-Normal probabil-
570
0.04 0.035 0.03 0.025 0.02 0.015 0.01 0.005 0 Gaussian
Mt. Shasta
Freehand
Polygons
(a) Average Squared Error
1 0.9 0.8 0.7 0.6 0.5 0.4 0.3 0.2 0.1 0
0.2 0.18 0.16 0.14 0.12 0.1 0.08 0.06 0.04 0.02 0 Gaussian
Mt. Shasta
Freehand
(b) Average Error
Polygons
Shapelets Polygons Pixels
Gaussian
Mt. Shasta
Freehand
Polygons
(c) Maximum Error
Figure 4: Approximation error for sample objects in different representation schemes. offset is trivial, and we will generally not include it in our formulae to simplify the notation. We will often explicitly include a scale factor β, however, as it also appears in the normalization factor at the beginning: h i−1/2 2 − x Hn (x/β)e 2β2 , φn (x|β) = 2n π 1/2 βn! (10) We can form a set of two-dimensional basis functions simply as a tensor product of one-dimensional basis functions: Bnx ny (x, y|β) = φnx (x|β) φny (y|β)
(11)
We often will use a single two-dimensional index that runs over all possible combinations of nx and ny (essentially flattening a matrix of coefficients into a vector). Because the basis functions are separable in x and y, at other times we will often give formulae for one-dimensional operators only; extending to two dimensions simply involves operating on x and y separately.
(a) Original (b) Polygons
(c) Pixels
(d) Shapelet
Figure 3: Finite representations for the objects shown in the first column (from the top: an elliptical Gaussian; an elevation map of Mount Shasta, California; and two arbitrary, hand-drawn images). Each representation is limited to the same amount of memory (36 floating-point values). ity distributions). However, the special properties of the polynomials, known as Hermite polynomials [2], allow any function to be represented using a shapelet expansion. In one dimension, the nth-order shapelet basis function is: h i−1/2 x2 φn (x) = 2n π 1/2 n! Hn (x)e− 2 , (9) where Hn (x) is the nth Hermite polynomial. These functions were originally developed as the solution to an important differential equation in physics, the quantum simple harmonic oscillator. The expansion was applied to astronomical image processing by Refregier [13] and Bernstein and Jarvis [3], and developed further by many others [4, 10, 14]. In most cases we will develop our operations by building on work from one or more of these sources. While derivations and proofs for the results we quote may be found in these papers, it should be stressed that it is not necessary for the reader to be informed of all the mathematical reasoning in order to understand how we make use of the remarkable properties of the shapelet basis. The above basis functions represent an expansion around the origin with a scale of one, and can be parameterized to include both an offset and a scale. The inclusion of an
Figure 5: Shapelet basis functions Bnx ,ny . The first few two-dimensional basis functions with their nx and ny values are show in Fig. 5. These functions are complete, meaning that any arbitrary function can be described by an infinite sum of shapelet components. The value of each coefficient is remarkably easy to determine. To expand some function f (x, y) onto a shapelet basis, yielding some coefficients fi , we only need to integrate the product of the function with each basis function: ZZ fi = Bi (x, y|β)f (x, y)dx dy (12)
571
This does not necessarily mean that a good approximation of an arbitrary function can be obtained with a relatively small number of coefficients, but it is often the case. Even more importantly, the basis is orthonormal : ZZ Bn (x, y|β)Bm (x, y|β)dx dy = δnm , (13)
min/max definitions, so this deficiency is not as limiting as it seems. In fact, using the arithmetic definition may be more appropriate for inherently smooth data, even if it is maximum-normalized. Our current implementation, detailed in Section 4, is thus best suited for integral-normalized objects, as we can support more of our “core” operators for these objects, though we also support a number of operations on maximum-normalized objects as well.
where δnm is the Kronecker delta, which is 1 if n = m and 0 otherwise (an identity matrix in tensor notation). In practice this feature means that any operation on shapelets can be formulated as a linear algebra operation. If we have a field F represented by its shapelet coefficients fi , X f (x, y) = fi Bi (x, y|β) , (14)
3.1
i
any operation on a single shapelet involves at most a matrix multiplication and an addition of a constant. For some operation that maps F to G, the form is X gj = fi Mij + Vj , (15) i
where M and V are a matrix and a vector that define the operation (in most cases, the vector V will be zero). Any binary operation that maps (F, G) to H can similarly be written as X X X hk = fi gj Tijk + fi Pik + gj Qjk + Rk (16) i,j
i
Pointwise Arithmetic and Overlap
To add or subtract two objects expanded onto a shapelet basis, we simply need to add or subtract their shapelet coefficients. In the language of (16), this amounts to setting P and Q to the identity matrix and all other terms to zero. One complication is that the objects must first be expanded onto bases with the same offset and scale factor. To do this, we must translate and scale the objects from their original coordinate systems to a new joint one (this further emphasizes the need for geometric transformations). We must also be able to multiply shapelets to meet the low-level requirements of topological operations. As this result is not developed in previous works, we will derive it here in one dimension; the two-dimensional multiplication tensor is the outer product of the one-dimensional tensor with itself. If we multiply two objects F and G, and define H as the result, at first we have a rather ugly product of sums: ! ! X X h(x) = fi φi (x|α) gj φj (x|β) (18)
j
Here, T is a three-dimensional matrix, which will often be the only nonzero term in the calculation. To compute any operation, then, all of the difficult work is in determining the elements of these matrices and tensors. Finally, operations that return scalars can be written simply as the dot product of the shapelet vector and an operation vector Si : X a= fi Si (17)
i
j
To find the components hk , we can multiply both sides by φk (x|γ) and integrate: Z X (3) hk = h(x)φk (x|γ)dx = fi gk Iijk , (19)
i
ij
In many cases, these vectors and matrices (henceforth collectively called simply tensors) can be calculated using mathematical recursion relations, formulae that relate one element of a tensor in a simple manner to the one or two previous elements. Given the first element or two, then, it is possible to compute in linear time (in the total size of the tensor) the entire tensor. The Hermite polynomials themselves can also be computed using recursion relations, allowing a shapelet expansion to be evaluated at a point by simply computing the value of the Hermite polynomial at that point and plugging into (10) and (11). This is generally much faster than constructing the full polynomials. While all of the low-level operations discussed above are possible with shapelets, not all are particularly efficient. Global min/max operations and contouring in particular are complex problems. We will not address them further here, except to note that these operations should still be faster on shapelets than on images, because shapelets are differentiable everywhere, an important feature for both minimization/maximization and contouring algorithms. Pointwise min/max operations are even more troublesome; these operations are inherently non-smooth, while a finite shapelet expansion necessarily involves some smoothing (and sharper features require higher-order expansions). As shown in Fig. 2, however, the arithmetic versions of topological operations are essentially “smoothing approximations” to the pointwise
572
(3)
Iijk (α, β, γ) =
ZZ φi (x|α)φj (x|β)φk (x|γ)dx
(20)
This triple integral tensor I (3) depends only on the scale factors (note that it is T in the form of (16)), and will appear as a key component in many binary operations. Its elements can be computed in linear time using recursion relations, but we refer the reader to Refregier and Bacon [14] for the details of this calculation. Note that the multiplication operation does not require input objects or output objects to have the same scale parameter, but they are required to have the same offset (which again can be accomplished by pre-transforming the objects). If we need only to calculate an overlap (as defined as the integral of the intersection), even this step is unnecessary. Because all the integrals (both in the multiplication operation and in the overlap itself) are over all space, we can assume one object is at the origin without loss of generality. Of course, care should be taken to define the relative offset appropriately with regard to its sign and which object is defined to be at the origin. Again working in one dimension, we can then write the full overlap operation between objects with different scales and a relative offset x0 as: ZZ f (x)g(x + x0 )dx (21)
This operation is known as the cross-correlation function of f and g. For overlap, we then only need to evaluate the cross-correlation at the offset between two objects. While a full proof is too lengthy to include here (see [21]), the threetensor Cijk that computes the cross-correlation (T in (16)) is just a slightly modified version of the triple-integral tensor I (3) , evaluated using the reciprocals of the scale factors.2 √ 3i+j+3k (3) Cijk = 2π(−1) 2 Iijk (α−1 , β −1 , γ −1 ) (22)
it with the coefficient vector to determine the pixel value. A vector of vectors, of course, is just a matrix, so we have essentially defined a matrix M that maps a vector of shapelet coefficients to a vector of pixels–a raster image. Computing shapelet components from a raster image is then a traditional linear algebra least-squares problem; given a basis matrix M and an image vector x, solve for the shapelet vector f in x = Mf
Without any geometric transforms, then, we can use (22) and (16) to compute the coefficients of the cross-correlation, and then simply evaluate it at the offset between the two input objects. The cross-correlation between two objects may be very well approximated by its first shapelet term only (or perhaps its first few terms); we then only need to evaluate the k = 0 terms of the tensor. For objects with many terms, this is a potentially dramatic improvement, and it is a tactic that may be worth exploring for other operators as well. Determining error guarantees, however, is difficult, and we will reserve a full discussion of this type of approximation technique for a future paper.
3.2
(25)
where the number of pixels is larger than the number of shapelet coefficients. For high resolution images and shapelets, this is a fairly expensive computation. However, the optimization problem is essentially a linear algebra optimization issue; a full discussion thereof goes beyond the scope of this paper. Other methods of image-based input exist as well and are discussed extensively in the astronomy literature [4, 10, 13].
3.3
Geometric Operations
Because we have parameterized the scale and origins of objects, a simple, “cheap” form of translation and uniform scaling can be computed in constant time simply by changing these parameters. These can be used, for instance, for changes in coordinate systems or map projections. For nonuniform scalings (scaling differently in different directions), however, or to translate or scale different objects to a common origin and/or scale factor, we must be able to scale and translate by changing the shapelet coefficients themselves. These finite geometric transformations are among the more complex shapelet operations we will discuss, as they cannot in general be computed using recursion relations. One can compute simple matrices that define differential geometric operators, or generators, which are valid for infinitesimal rotations and translations (these are given in [13]). To compute a matrix that defines a more useful finite transform T from a generator R for an amount v (a rotation angle, translation distance, etc.), we must compute a matrix exponential:
Integral and Moment Operations
As noted above, the Hermite polynomials obey several recursion relations. The two most important relations (which may be taken as a definition of the Hermite polynomials) are Hn (x) = 2xHn−1 (x) − 2(n − 1)Hn−2 (x) (23) and dHn (x) = 2nHn−1 (x) (24) dx The first can be used to calculate the value of a basis function φn (x) at x with a complexity at most linear in n. The second allows us to compute derivatives of the basis functions, and together with integration by parts, allows us to compute any integral or integral moment. These integrals can be over any rectangular domain (including all space and one-sided half-infinite domains). The detailed form of the derived recursion relations for simple integrals is given in [10], and we derive a recursion relation formula for general integral moments in [21]. With the ability to calculate integrals and integral moments over all space, we can now support the moment-based metric operations described in Section 2.2. Note that these recursion relations allow us to compute, for each basis function, the value of the integral or integral moment; this defines the vector Si for these operations as in (17). By computing this operation vector over a region and taking the dot product with a coefficient vector, we can compute any integral moment for any object in a given rectangular, semi-infinite, or infinite region.
T = eRv
(26)
Matrix exponentiation is not as elementary as scalar exponentiation, and is defined to involve an infinite number of matrix multiplications: eR =
∞ X Rn n! n
(27)
A solution to this problem is to diagonalize the matrix, an expensive but well-studied problem in numerical linear algebra. If U is the matrix that diagonalizes R, and D is the corresponding diagonal form, the matrix exponential of R is eR = U eD U −1 ,
Image Input and Output
(28)
where the exponential of D now involves only exponentiating its (diagonal) elements. This expensive diagonalization procedure must be applied to the generator matrices only once; we can then cache the matrices U , U −1 , and D to compute any finite transform with just a few matrix multiplications. This is the procedure used for both rotations and translation operators. A similar operation is possible for the scale geometric transform, but it is easer to use a different tactic. Because binary operations based on the triple-integral tensor I (3) do
We can also define a similar scalar-operation vector Si that computes the value of the object at a point by evaluating (10) and (11) at that point. With a choice of whether we wish to integrate over pixels as tiny rectangles or evaluate the function at the center of each, we now have the necessary ingredients to produce images from a shapelet representation: we create a basis vector Si for each pixel and dot 2 The triple integral tensor is zero unless i + j + k is even, so the correlation tensor is always real.
573
not place any restrictions on the input scale factor, we can use the cross-correlation function to perform a scaling operation. The Dirac delta function δ(x) is defined as an infinitesimally thin, infinitely tall peak with unit volume. It can be represented well by a single-coefficient shapelet with a tiny scale factor. By definition, the cross-correlation of any function with the Dirac delta function is the original function: Z f (x0 ) δ(x0 + x) dx0 = f (x) (29)
1 3 5 7
Figure 6: Definition of RawShapelet. management for the shapelet’s data stored in a RawShapelet, as well as routines for (1) input/output (ASCII String and pixel images), (2) basic arithmetic operations (addition, multiplication etc.), (3) geometric transforms (moving, scaling, rotation etc.), (4) integrals and convolutions, (5) changing resolution (smoothing/resizing of the coefficient array), and (6) determining minimal bounding boxes. Figure 7 shows the signatures of all the operations we implemented.
Input/Output
By computing the cross-correlation operator with different input and output scales, and cross-correlating our object with the delta function, we can “rescale” our shapelet object to a new scale factor parameterization. If we perform this operation but do not change the scale parameter, the result is to scale the object by βin /βout . As the cross-correlation is separable in x and y, we can apply different scalings in the different directions, and together with the rotation and translation operators above, we can thus represent the full set of affine transforms.
4.
REALIZATION AND EVALUATION
Topological
Arithmetic
Index
Info
Get/Set
Based on the concepts and techniques underlying low-level and high level operations on shapelets discussed above, we now present the implementation of our shapelet-based data and query model in PostgreSQL. We built a C++ library containing a shapelet class, which provides the backend for the new PostgreSQL data type shapelet. A few functions were also implemented temporarily in Python, using PostgreSQL’s Python-based procedure language, but these will be moved to the C++ library in the future. In this section, we outline the key design of the C++ implementation and its integration into PostgreSQL, and discuss how shapelets are indexed to significantly speed up certain types of queries. We also present experiments that illustrate (1) some shapelet representations for smooth objects, (2) the usage of the shapelet type in PostgreSQL, and (3) performance measurements for query operations we implemented.
Shapelet PostgreSQL Extension
Geometric Transforms
4.1
typedef struct RawShapelet { int size; double beta, x, y; double data; // starting element for data array } RawShapelet; // Low-level data access methods inline void setData(RawShapelet *s, int offs, double v) { (&(s->data))[offs] = v; }
The heart of the PostgreSQL extension is a C++ library containing the main class Shapelet. C stubs around the functionality of the C++ class are used to bind the library’s functionality to PostgreSQL functions. We chose the GNU Scientific Library (GSL) for performing expensive matrix multiplications and inversions. This library is a sophisticated, well-tested, and optimized framework for mathematical operations, and it supports different backend libraries for matrix inversions. We use a C struct data structure called RawShapelet as data container. The definition is shown in Fig. 6. The members beta, x, and y denote the scaling factor β and the shapelet’s center position (x, y), respectively. As the number of shapelet coefficients can vary from shapelet to shapelet, this C struct has a variable size that is always stored in size.3 All the shapelet coefficients are stored in a double array, which starts at the member position data. The C++ shapelet class is designed as a “user-friendly” interface to the shapelet library. The class provides memory
Signature
Description
importString(t):s exportString(s):t importPNG(t,p,f,i):s exportPNG(s,i,i,b,t) makeGaussian(p,f,f):s
serialized input serialized output image input (filename, center, beta, nmax) image output (shapelet,xpix,ypix,box,filename) new singlecomponent Shapelet (center,stdderivation, volume) get the center point set the center point get the scale factor set the scale factor value of the Shapelet field at a point integral of the Shapelet in a rectangular region integral of the Shapelet over all space a box that bounds the exterior integral a box that bounds the exterior maximum
getCenter(s):p setCenter(s,p) getBeta(s):f setBeta(s,f) evalAtPoint(s,p):f integrateBox(s,b):f integrateAll(s):f getIntBBox(s,f):b getMaxBBox(s,f):b getEpsBBox(s,f):b multiplyScalar(s,f):s multiply(s,s,f,i):s add(s,s):s subtract(s,s):s normalize(s):s intersection(s,s):s union(s,s):s overlap(s,s):f scale(s,f,f,bl):s uniformScale(s,f,bl):s rescale(s,f,i):s recenter(s,p):s translate(s,p):s rotate(s,f):s
a box that bounds integral and maximum multiple the field by a scalar pointwise multiplication (shapelet, shapelet, beta, nmax) pointwise addition pointwise subtraction set the integral over all space to one arithmetic intersection (automatically recenters) arithmetic union (automatically recenters and rescales) arithmetic/integral overlap nonuniform scaling (shapelet, xscale, yscale, preserve_total) “cheap” uniform scaling (shapelet, scale, preserve_total) change beta and nmax without changing the field change the center without changing the field “cheap” translation rotations about the Shapelet center (angles in CCW radians)
s:Shapelet. t:Text. f:Float. p:Point. b:Box. i:Int. bl:Bool
Figure 7: Implemented Functions.
4.2
Experimental Evaluation
The experiments described in the following demonstrate how shapelets are able to approximate various vague spatial objects, followed by some sample operations on such objects. For the selected operations, we give the SQL queries, the execution times and figures of the input or output vague spatial objects, if appropriate.
Representing Various Vague Spatial Objects
3
The convention to store the size in bytes in the first word of the data structure is also used in PostgreSQL’s variable sized data types.
Figure 8 illustrates the effects when different spatial objects are represented using a varying number of shapelet coeffi-
574
0.14
1 0.9 0.8 0.7 0.6 0.5 0.4 0.3 0.2 0.1 0
0.3 S smiley 2 boxes box smooth box star smooth smiley radiation
0.12 0.1 0.08 0.06
S smiley 2 boxes box smooth box star smooth smiley radiation
0.25 0.2 0.15 0.1
0.04
0.05
0.02 0
0 0
20
40 60 80 Number of Coefficients
100
(a) Average Squared Error
120
0
20
40 60 80 Number of Coefficients
(b) Average Error
100
120
0
20
40 60 80 Number of Coefficients
100
120
(c) Maximum Error
Figure 9: Approximation error for sample objects versus number of shapelet coefficients. the actual quantity minimized in the shapelet construction is the mean squared error.
Performance and Sample Queries For the evaluations below, we used PostgreSQL 8.1.3, compiled with the default optimization options. We use a Dualcore Intel Pentium D (2.8GHz, 1024MB of main memory) machine running the current Debian SID distribution with a 2.6.16 Linux kernel. We created 6 tables, each having 1 million shapelets with 1, 6, 15, 36, 55, and 120 coefficients. The coefficients are initialized with random numbers chosen from a uniform distribution over [0, 1]. As all the presented operators do not depend on the actual values of the coefficients but only on the number of coefficients, the performance results are representative for all smooth objects of these sizes. Figure 10(a) shows performance measures for several operations on these tables, along with the syntax for the operations themselves. The last line is a normalization operation, which sets the total integral of a shapelet to one. All of these operations, as expected, perform linearly in the number of shapelet coefficients, with the SELECT queries performing a little worse than the COUNT function. To demonstrate certain features of our implementation and data model using real data, we created a table of shapelets that represent the stars and galaxies in a 10k×10k image from the Deep Lens Survey [19]. This image contains approximately 140, 000 astronomical objects and represents only 1/45 of the full DLS (which is a fairly small survey relative to those that will be completed in the next few years). Rather than computing a full shapelet decomposition of each object, to demonstrate an alternate form of input we used the second moments and total integral of each object (computed from the image) to define an elliptical Gaussian (different from the circular Gaussian, which can be created by our makeGaussian function). We then calculated the shapelet coefficients for models (with 15 coefficients for each object), by scaling and rotating circular Gaussians into elliptical Gaussians. As they are relatively small and blurry, this simplified model is a good approximation for most stars and galaxies in the image and still captures the more important features of the data. Given a table (catalog) of center points (c), ellipse parameters (a,b,theta), and total fluxes (f), the following query creates our galaxies table:
Figure 8: Shapelet approximations with a varying number of coefficients: original, 120, 55, 36, 15, 6, and 1. Note that the last line is a 1/r2 distribution, not a Gaussian. cients. For each number of coefficients, the squared difference between the original and the representation is minimized. The experiment shows that arbitrarily shaped objects can be approximated using shapelets. If only one coefficient is used, the approximation is exactly a circular Gaussian. However, as more coefficients (i.e., more basis functions) are used, the approximations become more similar to the original objects. It is furthermore evident that the representations are naturally smooth: even for the crisp objects, the sharp boundaries are smooth and start to sharpen again with increasing resolution. This effect usually results in better approximations for smooth objects than for crisp objects using the same number of coefficients. In Fig. 9, the approximation errors for each of the objects are given as a function of the number of the shapelet coefficients used. As expected, the approximation improves with an increasing number of coefficients, and the already “smoothed” objects are generally better represented than those with sharp boundaries. This is particularly significant for larger numbers of coefficients, where the function plots in Fig. 9 clearly fall into two classes based on their smoothness. Also note that mean errors and maximum errors are quite reasonable, although
CREATE TABLE galaxies AS ( SELECT rotate(scale(makeGaussian(c,1.0,f),a,b,TRUE),theta) FROM catalog );
One of the most common queries on an astronomical database is the basic window query to find all objects in a given region. If we define “presence in a region” as having at least
575
half of an object’s flux in that region, we can formulate this query for the box ((5000,5000),(5500,5500)):
leverage the first criterion whereas operations on maximumnormalized objects typically utilize the second criterion. To support both kinds of operations, we combine these two criteria and call a box an ε-bounding box of a shapelet s iff (1) the total volume under the shapelet curve that is not inside the box is smaller than or equal to ε, and (2) all shapelet values outside the box are smaller than or equal to ε.
SELECT * FROM galaxies WHERE integrateBox(s, BOX ’((5000,5000),(5500,5500))’) > 0.5*integrateAll(s);
We exported the retrieved shapelets as a PNG image, which is shown in Fig. 10(b). If we are interested in a detailed analysis of a single galaxy, we may be concerned with any nearby objects that may contaminate our measurement (this issue in fact comes up simply when trying to compute the full shapelet decomposition for multiple objects in one image). In this case, we are interested in the overlap between our primary object and any others in the image. Because we wish to define an overlap operation that addresses “how much a neighboring object impacts a central object”, it makes sense to define an asymmetric overlap (with F our primary object and G a potential neighbor): RR f (x, y) g(x, y)dx dy (30) overlap(F, G) := `RR ´2 f (x, y)dx dy
Operations and their Error Guarantees Using ε-bounding boxes we can shortcut integral operations (including image export), shapelet-shapelet intersection and overlap, as well as pointwise evaluation queries. Pointwise Evaluation. Calculating the value of a shapelet at a certain point can be significantly sped up if the queried point is outside the bounding box: we can approximate this value by 0 with an error guarantee of ε. Integral operations. Since the total volume of the shapelet outside its bounding box is less than ε, any integral over a box that does not intersect with the bounding box can be immediately evaluated to zero with an error smaller than ε. Similarly, the same guarantee holds if shapelets are output as pixel images. Here, any pixel that does not intersect with the bounding box can be evaluated to zero. Moreover, if the image does not intersect with the bounding box, all pixels in the image can be evaluated to zero, resulting in a total error (summed over all pixels) of not greater than ε. Shapelet intersection/overlap. Consider the case that the shapelets represent probabilistic density functions (PDFs) or any other integral-normalized data. If shapelets pF and pG model the locations of two objects F and G, ε-bounding boxes can support computing the PDF p∩ of finding both objects at the same location: If the bounding boxes of pG and pF do not overlap, we can safely approximate p∩ with zero everywhere. The maximum point-wise error we would introduce here is bound by ε. Because p∩ = pG · pF , the value of p∩ will be smaller than or equal to 1 · ε in any one of the two bounding boxes and not greater than ε2 outside both bounding boxes. While our implementation currently does not support a pointwise min/max intersection definition, it should be noted that our ε-bounding boxes would also support indexing on those operations.
This is different from the probabilistic overlap function we show in Fig. 7, which assumes that the objects are normalized. Using this function and some low-level operators, however, it is easy to create a new SQL function with the desired definition: CREATE FUNCTION neighbor_overlap(shapelet,shapelet) RETURNS double precision AS ’SELECT overlap($1,$2)/integrateAll($1)^2 AS result;’ LANGUAGE SQL;
This demonstrates the ease with which specific high-level operators can be defined using our low-level building blocks.
4.3
Indexing Shapelets
One advantage of using shapelets is their local extent, which allows us to index them using conventional crisp objects such as bounding boxes, to increase query performance. In the following, we discuss how shapelets that represent fields with positive values can be indexed using “approximate” bounding boxes. We provide error guarantees for the operations supported by the indexing technique and evaluate our indexing approach by presenting the performance measures for sample queries. ε-Bounding
Finding a Tight ε-Bounding Box
Boxes
In analogy to standard indexing techniques in spatial databases we strive to construct minimum bounding boxes. Other crisp object representations, such as polygons, circles or ellipses can also be used to “bound” or circumference shapelets. In our implementation, we choose rectangular bounding boxes to leverage the existing R-tree support in PostgreSQL. Since the shapelet basis functions are polynomials scaled by a Gaussian, the shapelets’ values are guaranteed to fall off quickly at large distances from the center point relative to the scale factor β. However, the values will reach zero only asymptotically. Therefore, any finite crisp bounding region will be an approximation of the actual shapelet “extent.” It is, however, possible to construct boxes such that (1) most of the shapelet volume is inside the box, and/or (2) the values of the shapelet function outside the box are smaller than a threshold. Operations on integral-normalized objects can
576
Finding bounding boxes that respect the integral criterion (i.e., the volume under the shapelet outside the bounding box is smaller than ε) can be done using a binary search. We fix the center of the bounding box at the center coordinates of the shapelet itself. Finding a tight bounding box proceeds in two steps: we expand an initial square box until the integral criterion is met, and then shrink it to a tight rectangular bounding box. We start with a square whose √ sides have a length of 2β nmax , because at this range the polynomials usually still dominate the Gaussian, and double its size at every step. The dominating influence of the Gaussian guarantees that after a few steps a sufficiently large bounding square can be found (in all our experiments, 10 steps were sufficient.) During the second phase we perform a “two-dimensional” binary search to find a tight rectangular bounding box. After 40 integral queries we then have a tight bounding rectangle. To satisfy the second criterion (all shapelet values outside the bounding box are bound by ε) we derived an upper bound for shapelet values outside a square box around the
200 150 100 50 0
20 40 60 80 100 Number of Shapelet Coefficients of Each Shapelet
(a) Performance for 1 mill. shapelets
10 5 0
120
(b) Galaxies PNG image
with index
15 39.63
250
without index 20
Integral 1
0.207
300
0.013
SELECT COUNT(s) SELECT SUM(integrateAll(s)) SELECT SUM(integrateBox(s, Box ’...’)) UPDATE S SET s = translate(s, Point ’...’) UPDATE S SET s = s * (1.0 / integrateAll(s))
350
Query time (sec)
Query Execution Time in seconds
25
400
Integral 2
Value
PNG Export
(c) Performance with and without index
Figure 10: Performance of sample queries and sample query output. shapelet center as a function of the shapelet coefficients. Here, we strictly increase the values of the shapelet coefficients to produce a smooth, unimodal envelope function that bounds the actual shapelet from above and is symmetric about the shapelet center. We then evaluate this function at one corner of the box to have an upper bound for the original shapelet extent (more details are covered in the technical report [21]). To find an actual ε-bounding box, we use both criteria (integral bound and value bound) in our binary search algorithm.
veloped with a representation involving contour polygons in mind, however, many of the additional operations have been motivated by their simplicity in a contour-based representation, rather than their usefulness for particular realworld datasets. Thus, it may be that some of these operators are unnecessary if they can be replaced by methods that are optimized for non-contour representations such as shapelets (e.g., using moment-based metric operations instead of threshold-contour metric operations). Of course, developing a technique to compute contours for shapelets would be a major step towards supporting the full fuzzy region data model with shapelets. Work on probabilistic data in databases has generally not dealt extensively with spatial probability distributions, and thus the link between probabilistic work and fuzzy regions has thus far been somewhat tenuous. Most work on spatial probability distributions has focused on query optimization and indexing for multidimensional probability distributions (e.g. [5, 17]) that must be sampled by the database itself; the values can be calculated at any discrete point (and this sampling can then be used to compute integrals, contours, etc. numerically). This sampling is assumed to be expensive, and the goal is to reduce the amount of sampling necessary. Some of the index structures (such as the U-Tree in [17]) developed for probabilistic databases may prove useful for other integral-normalized data, as they essentially support R-tree-like indexes with multiple bounding boxes (corresponding to different thresholds) for each object. The astronomical literature describing shapelets as an image processing technique also has much more to offer than is described here. The computation of shapelet coefficients from images has many subtle details that we have not addressed, and a much more extensive discussion can be found in [4]. There are also other mathematical features of shapelets that may optimize certain operators. In particular, shapelets may be expanded into a basis in polar coordinates instead of Cartesian coordinates [3, 10], which simplifies rotation and integration over circular regions. In addition, databases are increasingly being used to store large astronomical catalogs. Because of differences between geographic and astrometric coordinate systems, and the intrinsic vagueness of stars and galaxies as spatial objects, off-the-shelf spatial data systems are often less useful for astronomy, requiring custom solutions [16]. As shapelets have already been shown to be useful in a wide variety of astronomical tasks, a shapelet data type could be an important addition to future astronomical databases, providing generic operations on vague spatial objects as well as astronomyspecific functions. It should be noted that the notion of imprecise spatial
Experimental Evaluation In the following experiments, we used the astronomical data described in Section 4.2. To simplify the definitions of the operators, we scaled the values of all the objects so that the average flux of each galaxies is 1 (this update query took 20 seconds to complete). This scaling is merely to make the appropriate values for ε more intuitive for the reader, as the native astronomical units give total integrals on the order of 106 for typical objects. All galaxies are distributed over a rectangular region from the origin to (10000,10000). We then added a new column bbox 0 005 to the table and populated it by 0.005-bounding boxes. Computing all 140,000 bounding boxes and building an Rtree took 130 and 84 seconds, respectively. The size of the bounding boxes varies from 9.26 to 273 pixels on a side with an average of 28.6; most of the created boxes are roughly square-shaped. We anticipated major speedups for expensive queries. We evaluated the index by issuing integral, pointwise evaluation (“value query”), and PNG export queries. The results are shown in Fig. 10(c). Integral 1 and 2 queries selected all shapelets that had a total volume of at least 0.01 over the boxes ((1000, 1000), (2000, 2000)) and ((1000,1000),(5000,5000)) with a volume of at least 0.05, respectively. The first query returned 14 galaxies, the second returned 46. The value query summed over the result of evalAtPoint. Without using the index, all shapelets were queried, whereas with using the R-tree an overlap with the bounding box can be used as a pre-selection criterion. As expected, the queries that use the bounding boxes as pre-selection condition outperform the queries without index support.
5.
RELATED WORK
As noted above, most work on vague spatial objects [1, 8, 11, 15] has focused exclusively on what we have called “fuzzy regions”, and the data model that has been defined for these regions is much more elaborate than the “core” operations we have described here. As this data model has been de-
577
7.
data can also be found in the context of moving object databases, e.g., [7, 18]. This work, however, is primarily concerned with query processing techniques and not underlying data models and operations for vague spatial data. The conceptual similarity of shapelets to other image processing and compression techniques, particularly the broad and well-established family of wavelet techniques (see, e.g. [12]), suggests that wavelets may also provide excellent base data types for vague spatial objects. This may be the case, and it is certainly premature to rule out any wavelet-based representation of vague spatial objects. However, it should be noted that our ability to compute many of the low-level operations with Shapelets is related more to the unique properties of Hermite polynomials than features shared by most basis-expansion image processing techniques. The computation of integrals and geometric transforms for wavelets are particularly large obstacles in generalizing our techniques to wavelets.
6.
REFERENCES
[1] D. Altman. Fuzzy Set Theoretic Approaches to Handling Imprecision in Spatial Analysis. Int. Journal of Geographical Inf. Systems, 8(3):271–289, 1994. [2] G. B. Arfken, H. J. Weber. Mathematical Methods For Physicists (4th ed). Academic Press, 1995. [3] G. Bernstein, M. Jarvis. Shapes and Shears, Stars and Smears: Optimal Measurements for Weak Lensing. The Astronomical Journal 123(2), 2002. [4] R. H. Berry, M. P. Hobson, S. Withington. Modal Decomposition of Astronomical Images with Application to Shapelets. Monthly Notices of the Royal Astronomical Society (MNRAS), 354(1), 2004. [5] R. Cheng, S. Prabhakar. Managing Uncertainty in Sensor Databases. SIGMOD Record, 32(4), 2003. [6] P.H. Christensen. Contour rendering. SIGGRAPH Comput. Graph. 33(1):58–61, 1999. [7] V.T. de Almeida, R.H. G¨ uting. Supporting uncertainty in moving objects in network databases. ACMGIS, 31–40, 2005. [8] M. Erwig, M. Schneider. Vague Regions. In Symposium on Large Spatial Databases, LNCS 1262, 298–320, 1997. [9] R.H. G¨ uting, M. Schneider. Moving Objects Databases. Morgan Kaufman, 2005. [10] R. Massey, A. Refregier. Polar Shapelets. MNRAS, 363:197, 2005. [11] A. Pauly, M. Schneider. Topological Predicates Between Vague Spatial Objects. In Advances in Spatial and Temporal Databases, 9th International Symposium (SSTD’05), LNCS 3633, 418–432, 2005. [12] R.M. Rao, A.S. Bopardikar. Wavelet Transforms: Introduction to Theory & Applications. Prentice Hall, 1998. [13] A. Refregier. Shapelets: I. A Method for Image Analysis. MNRAS, 338:35–47, 2003. [14] A. Refregier, D. Bacon Shapelets: II. A Method for Weak Lensing Analysis. MNRAS, 338:48–56, 2003. [15] M. Schneider. Design and Implementation of Finite Resolution Crisp and Fuzzy Spatial Objects. Data & Knowl. Eng. 44(1):81-108, 2003. [16] A. Szalay, P. Kunzt, A. Thakar, J. Gray, D. Slutz, R. Brunner. Designing and mining multi-terabyte astronomy archives: the Sloan Digital Sky Survey SIGMOD Record, 451–462, 2000. [17] Y. Tao, R. Cheng, X. Xiao, W. K. Ngai, B. Kao, S. Prabhakar. Indexing Multi-dimensional Uncertain Data with Arbitrary Probability Density Functions. Proc. 31st VLDB Conference, 922–933, 2005. [18] G. Trajcevski, O. Wolfson, K. Hinrichs, S. Chamberlain. Managing uncertainty in moving objects databases. ACM Trans. Database Syst., 29(3):463-507, 2004. [19] J.A. Tyson, D. Wittman, I. Dell’Antonio, A. Becker, V. Magoniner, and DLS Team. The Deep Lens Survey: Overview. Bulletin of the AAS, 33:1464, 2001. [20] Q. Yang, J. Snyder. Map Projection Transformation: Principles and Applications. CRC Publisher, 1999. [21] D. Zinn, J. Bosch, M. Gertz. Modeling and Querying Vague Spatial Objects Using Shapelets. Technical Report, University of California at Davis, April 2007.
CONCLUSIONS AND FUTURE WORK
The prototype implementation described above is, to our knowledge, the first for vague spatial objects, and the lowlevel building blocks it provides allow it to support a variety of higher-level data models. While certain functions should be optimized (caching certain operation matrices is an obvious start) and others implemented (notably integral moments) before we can consider it to be functionally complete, it already demonstrates the versatility of our approach. Many of the topics we have mentioned briefly above bear further examination, however. An optimized contouring algorithm for shapelets is a realistic goal. Together with a complete library for standard vector-based objects, this would greatly enhance our ability to support operations on maximum-normalized objects. As all of our operators take the form of matrices, function composition often takes the form of matrix multiplication. This suggests an interface based on object-oriented functionals (and perhaps even table-based storage of operators), which could make our “building blocks” even more powerful. The possibility of using only a few coefficients of objects to calculate approximate results for complicated operations, introduced in Section 3.1, shows great promise. However, providing error guarantees for these approximations appears to be a difficult and intensely mathematical task. While the threshold-based indexing scheme we developed is quite effective, it may be worthwhile to explore index structures designed exclusively for vague spatial objects. The most obvious approach would take the form of some “multiple concentric bounding box” index structure, but there may also be possibilities involving simple analytic functions. Although some of these topics are potentially difficult, their potential as well as the work we have described earlier, suggest that shapelets may be an ideal starting point for future work on vague spatial objects. Acknowledgment This work is in part supported by the National Science Foundation under Awards No. IIS-0326517 and ATM-0619139, as well as an NSF Graduate Research Fellowship.
578