convenient alternative power source to traditional sources in various applications. In this work we compare the PMPG modeling and simulation results obtained ...
Excerpt from the Proceedings of the COMSOL Conference 2010 Boston
Modeling and Simulation of a Piezoelectric Micro-Power Generator Manu Pallapa*, Mohamed Aly Saad Aly, Albert I. H. Chen, Lawrence Wong, Ka Wai Wong, Eihab M. Abdel-Rahman and John Tze-Wei Yeow University of Waterloo, Waterloo, Ontario, Canada * Department of Systems Design Engineering, University of Waterloo,
Abstract: Piezoelectric Micro-Power Generators (PMPGs) convert the deformations produced by kinetic energy harvested from mechanical vibrations to an electrical charge via the direct piezoelectric effect. The current surge in micro- scale and lowpower devices allows PMPGs to provide a convenient alternative power source to traditional sources in various applications. In this work we compare the PMPG modeling and simulation results obtained using four different approaches; (i) COMSOL Multiphysics 3.5a, (ii) Coventor, (iii) ANSYS and (iv) Lumped element analysis. Firstly, static deflection of the mass and the maximum stress in the support beams are obtained as functions of the voltage. Then, the eigenvalue problem of the MPG is solved to obtain the lowest four natural frequencies and mode shapes of the MPG. Finally the transient response of the PMPG is determined along with its power generation capacity. It is found that the four approaches closely agree with each other. The simulations provide the basis for optimal design and fabrication of the PMPG. Keywords: Piezoelectric Micro-Power Generator (PMPG), static analysis, eigenfrequency, transient response, power generation.
1. Introduction Energy harvesting materials and systems are an attractive research area that is growing at a fast pace. Macro energy harvesters have been in use for a long time. On the other hand, the increasing number of independent miniature electronic devices and their need for sufficient, reliable power supply make micro energy harvesting more appealing. While micro and macro energy harvesting are similar in principle, their scope and applications are fundamentally different. In the last decade, energy scavengers
have been utilized by a vast number of applications, including embedded and implanted sensor nodes for medical applications, distributed wireless sensor nodes for structural health monitoring, battery recharging, monitoring tire pressure in automobiles, powering unmanned vehicles, and running security systems in household conditions [1]. This trend has driven the development and advancement in energy harvesting materials, electronics, and integration. Human motion, low-frequency seismic vibrations, and acoustic noise are some of the sources which can be exploited to harvest energy. There are three major energy transduction mechanisms to harvest energy from vibrations, namely electrostatic, electromagnetic and piezoelectric approaches. Electrostatic (capacitive) energy harvesting is based on the phenomenon of changing capacitance of vibration-dependent varactors (variable capacitors). The initially charged varactors are separated by vibrations, thereby transducing the mechanical energy into electrical energy. Vibrations are also transduced into electrical energy by electro-magnetic induction [2, 3]. A magnet induces current in a coil as it moves and magnetic field lines cross the coil. Piezoelectric energy harvesting operates using the direct piezoelectric effect that converts mechanical strain into electrical current. The scope of this paper is to investigate a nominal design of the PMPG and analyze its response with a view to arrive at an optimal design. It also seeks to compare the relative merits of using four different methods to analyze the PMPG response, namely (i) COMSOL Multiphysics 3.5a, (ii) CoventorWare, (iii) ANSYS and (iv) Lumped element analysis.
2. Theory and Model The PMPG is designed to harvest energy from vertical environmental vibrations. It is
composed of two identical microcantilever beams and a seismic mass, gold, at the free ends of the beams. Each beam is made of a piezoelectric layer, aluminum nitride, deposited on top of a structural layer, polysilicon. The gold mass is also deposited on top of the polysilicon structural layer. The material properties [4, 5] and dimensions of the PMPG are listed in the appendix. A schematic and a cross-sectional view of the PMPG are shown in Figure 1. Conducting electrodes are placed above and below the piezoelectric layer. The electrodes are made of thin metal layers (less than 50nm) and therefore are neglected in this analysis.
Figure 1. Schematic of the PMPG
The piezoelectric strain-charge constitutive equations were utilized in this work. They are represented in COMSOL as follows: 1 2 where and are stress and strain tensors, is the elastic compliance matrix, E and D are the electric field and electric displacement vectors, d is the is the piezoelectric coupling matrix, relative permittivity matrix. COMSOL uses the linear piezoelectric equations coupled with linear strains for relatively small deformations. To solve the eigenvalue problem, the geometric non-linearity has to be employed. Large deformation piezoelectric equations are used [6] and the strains are calculated using Green-Lagrange strain given by: 1 2
3
The electrical field in the piezoelectric layer was determined by solving Poisson’s equation: .
4
2.1 Meshing Tetrahedral elements were used to mesh all three materials in Coventor. The element order is parabolic and the average element size was set to 15. Manhattan Bricks were also used as mesh elements. However, that effort was abandoned since the element size had to be fine tuned in each dimension, especially at the corners of the structure. Because of its versatility, tetrahedral elements were found a better choice for this structure. The volume mesh had 10254 nodes and 5818elements. Analysis in ANSYS started with a coarsely divided mesh, which was then gradually reduced in size as the simulation results were tracked. Element size reduction was terminated when the results were found to asymptotically converge. The size of the element or the number of division along a boundary was specified using the “esize” command. Tetrahedral elements were used since they provide better fit for curved and pointed surfaces. Since the PMPG is made up of rectangular blocks, hexahedral were also used to mesh the structure. No significant difference was found in the results obtained using the two types of elements. In COMSOL, the Free Mesh Parameter was used to set the mesh. The quality of the mesh, in terms of the predefined mesh size, is set to a coarser integer value of 7, where the quality of the mesh ranges from the extremely fine (1) to the extremely coarse (9). The z-direction scale factor which allows for anisotropic mesh generation was set to 3. This ratio of meshing reduces the density of the mesh to give 1043 nodes and 3310 tetrahedral elements with 19766 degrees of freedom, an element quality of 0.1148 and an element volume ratio of 6.59e-4. Lumped-element model reduces the PMPG into a spring, mass and damper. The system was reduced to a single degree-of-freedom located at the seismic mass center where the effective mass of the beams was also applied. The cantilever beams were reduced to a single linear spring.
3. Simulation Results 3.1 Static Analysis The deflection range of the seismic mass is important because it determines the required clearance of the PMPG above the substrate. To
obtain a representative range of the seismic mass deflections, the PMPG was configured as a piezoelectric actuator and an external voltage was applied across the electrodes sandwiching the piezoelectric layer. As a result, the beams deflected under the weight of the seismic mass and a moment generated by the piezoelectric force. The boundary conditions for the static problem were set such that the fixed supports at the beam ends were assumed ideal, that is an infinite stiffness wall, while the rest of the structure had no constraints. Static analysis of the PMPG was performed to obtain the deflection of the seismic mass center as a function of the applied voltage. In ANSYS and Coventor – Analyzer we obtained the static deflection of the seismic mass center as a function of voltage. The lumpedelement model balances the spring (beam) deflection against the lumped mass weight to obtain the deflection at zero voltage. As the voltage increases, it uses the formula developed by Huang et al. [7] is used to account for further deflection due to the piezoelectric force. In COMSOL, the weight of the seismic mass was applied as a static load to the top surface of the seismic mass. The static parametric solver was used to find the deflection for the voltage range 0 - 30 V.
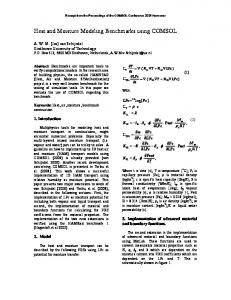
identical across all five models. The curves start from approximately 0.18 um deflection at 0V and end with approximately 0.7 um deflection at 30V. A discrepancy is observed consistently between the static deflection results obtained from ANSYS and Coventor, and those obtained using COMSOL and the lumped-element model. The maximum stress in PMPG was also determined. It was found to occur at the fixed support with maximum tensile stress occurring on the top layer of the beams and maximum compressive stress occurring at the bottom layer of the beams. The maximum stress obtained using ANSYS, COMSOL and Coventor was found to be 6 MPa with the variation among them limited to less than 2%. The lumpedelement result was 30% larger than those values. This results show that the maximum stresses are well below the allowable stress (less than 2%), which indicates that the nominal PMPG has been over-designed. 3.2 Modal Analysis This section focuses on determination of the natural frequencies and mode shape of the PMPG during free vibration. It also reports the variation of the natural frequency with the actuator voltage across the piezoelectric electrodes.
0.8
ANSYS COMSOL Coventor Lumped Mass
ws(m)
0.6
(a)
(b)
0.4
0.2
(c)
(d)
Figure 2. Deflection of the seismic mass center as a function of the actuator voltage
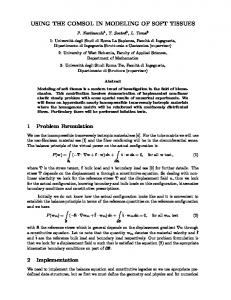
Figure 3. The first four modes of the PMPG obtained using COMSOL (a) First out-of-plane bending, (b) First in-plane bending (c) First torsional (d) Second out-of-plane bending
All four models show similar variation of deflection with voltage, Figure 2, which indicates that the piezoelectric coupling is
The mode shapes obtained from modal analysis at zero voltage in ANSYS, COMSOL and Coventor were similar. The mode shapes
0
10
20
30
VDC(V)
Table 1. Natural frequencies of the first four modes at 0V 1 2 3 4
CoventorWare 1139 2617 4599 16916
ANSYS 1162 2682 4713 18257
COMSOL 1195 2821 4792 18481
Lumped 1104 NA NA 14330
The natural frequency of the second mode was found to be more than a 100% above the PMPG center frequency. This is advantageous for energy harvesting since it means that most kinetic energy will be absorbed by the energyharvesting efficient first mode rather than the inefficient second mode. Activation of the torsional mode can be particularly damaging to the PMPG. Since the seismic mass is very wide, even 1 degree of rotation can cause it to impact on the substrate. This can lead to energy loss and failure due to stiction or fatigue. However, the natural frequency of the third (torsional mode) is more than 300% above the PMPG center frequency indicating that the nominal PMPG design is robust enough to exclude these degradation and failure modes. The variation of the fundamental natural frequency with actuator voltage is shown in Figure 4. These results correspond to the free vibration natural frequency around the deflected positions shown in Figure 2. The increase in the natural frequency with voltage indicates that the PMPG response hardens as the support beams deflection increases. This effect is consistent
with the fact that the relatively large seismic mass at the end of the beams will lead to hardening due to middle-plane stretching as the beams deflect. 1600 ANSYS COMSOL Coventor Lumped Mass
1500
1400
(Hz)
obtained from COMSOL are shown in Figure 3. The first and second modes are: the first out-ofplane bending and the first in-plane bending. The third and forth modes are, the first torsional and the second out-of-plane bending. The natural frequencies at 0 V are listed in Table 1 as found from ANSYS, COMSOL, Coventor and the lumped-element model [8] for the two out-of-plane bending modes. The fundamental natural frequency is of particular interest since it represents the center frequency of the PMPG where optimal energy harvesting occurs. The fact that the fundamental mode was found to be the out-of-plane bending mode and that the average center frequency was found to be relatively low, at 1165 Hz, indicate that the nominal design of the PMPG meets the functional criteria.
1300
1200
1100 0
10
20
30
VDC(V)
Figure 4. The fundamental natural frequency of the PMPG as a function of actuator voltage
Coventor and ANSYS reported hardening on the order of 1% frequency increase per volt, while the lumped-element model reports that to be 0.33% per volt. In COMSOL, the eigenvalue problem solved using nonlinear geometry. was insensitive to the electric potential change in the piezoelectric layer. This appears to be a shortcoming in COMOSL’s modal analysis routine. 3.3 Transient Analysis Transient analysis was undertaken to estimate the power output of the PMPG under a base acceleration representing a typical environmental vibration signal a(t) = 4.9·cos(Ωt)
(m/s2)
A load resistance (10kΩ) was connected between the electrodes of the piezoelectric layer. The quality factor, corresponding to mechanical damping in the MPMG, was estimated conservatively at Q = 15. While the PMPG realizes maximum displacement amplitude and output power in the neighborhood of the center frequency, the fundamental natural frequency obtained using the four modeling techniques adopted here did
from the fact that under the current configuration, the PMPG does not account for energy dissipated in the load resistance. ANSYS COMSOL Coventor Lumped Mass
2
1
V(V)
not match exactly. In order to perform a meaningful comparison, a common frequency of base acceleration was set to about Ω = 1200 Hz, close but not equal to the center frequency of the PMPG. Starting from rest, the time-histories of the seismic mass center and the voltage across the load resistance were acquired for excitation 20 periods as the PMPG settled to steady-state response. In COMSOL, the resistive load was not defined explicitly. Rather, the surface charge on piezo-electrodes was determined and then differentiated over time to obtain the current. The voltage drop across the load resistance is then calculated. In Coventor, the Architect module was used to obtain the time-histories. The lumped-element model developed by Renaud et al. [9] was integrated for the timehistories of the seismic mass displacement and resistive load voltage.
0
-1
-2 ANSYS COMSOL Coventor Lumped Mass
0
0.004
0.008
0.012
0.016
t (s)
Figure 6. Time history of the voltage across the load resistance
1
w(m)
4. Discussion and Conclusions
0
-1
0
0.004
0.008
0.012
0.016
t (s)
Figure 5. Time-history of the seismic mass center displacement
The displacement of the seismic mass center is shown in Figure 5. The differences among the various techniques are due to the discrepancy among the fundamental natural frequency in each model and errors in setting the damping in the three software models. The transient voltage results, shown in Figure 6, are more consistent with all approaches converging to similar steadystate peak-to-peak values (+/- 2uV). The overshoot in COMSOL result appear to result
We modeled the PMPG and simulated its response using four different approaches. The results are in qualitative agreement. They indicate that while the nominal design of the PMPG is sound, it is quite conservative and inefficient. The primary shortcomings are the thickness of the piezoelectric layer and the selection of Aluminum Nitride as a piezoelectric material. The thick beam sections lead to very low strains and as result low accumulated charges in the piezoelectric layer. The fact that the piezoelectric coefficient of Aluminum Nitride is low exacerbate this shortcoming leading to undesirably low output power (around 10 nW). Table 1 evaluates and compares the performance of these techniques using a set of six criteria we identified. The various approaches are rated from the more suitable (xxx) to the less suitable (x) to a particular purpose. The criteria used were: 1) Simulation time: the time required to run the simulation on an average desktop computer.
2) Robustness: stability of the numerical solver. 3) Controllability: the ability to configure the code to run a given simulation. 4) Vertical integration: the ability to define circuit layout and fabrication processes within the same platform. 5) System integration: the ability to simulate the device in conjunction with other system components such as resistive loads and rectification circuits. Table 2: Comparison of the modeling techniques with respect to performance criteria ANSYS
COMSOL
Coventor
Lumped
Simulation Time
x
xx
xxx
xxx
Robustness
x
xx
xx
xxx
xx
xx
xx
xxx
Vertical Integration
x
xx
xxx
-
System Integration
xx
x
xxx
xxx
Controllability
5. References 1. S. Priya and D. J. Inman, “Energy Harvesting Technologies”, Springer, New York, 2009. 2. C.B. Williams and R.B. Yates, “Analysis of a micro-electric generator for Microsystems”, Sensors and Actuators A, Vol. 52, pp. 8-11, 1996. 3. N. N. H. Ching, H. Y. Wong, W. J.. Li, P. H. W. Leong and Z. Wen, “A laser-micromachined multi-modal resonating power transducer for wireless sensing systems”, Sensors and Actuators A, Vol. 97-98, pp. 685–690, 2002. 4. K. Tonisch, V. Cimalla, Ch. Foerster, H. Romanusa, O. Ambachera, and D. Dontsov, “Piezoelectric properties of polycrystalline AlN thin films for MEMS application”, Sensors and Actuators A, Vol. 132, 658-663, 2006. 5. V. Mortet, M. Nesladek, K. Haenen, A. Morel, M. D’Olieslaeger, and M. Vanecek, “Physical properties of polycrystalline aluminum nitride
films deposited by magnetron sputtering”, Diamond and Related Materials, Vol. 13, pp. 1120-1124, 2004. 6. MEMS Module User’s Guide, COMSOL 3.5a, COMSOL AB, 2008. 7. C. Huang, Y. Y. Lin, T. A. Tang, “Study on the tip-deflection of a piezoelectric bimorph cantilever in the static state”, Journal of Micromechanics and Microengineering, Vol. 14, pp. 530-534, 2004. 8. T. Seuaciuc-Osorio and M. F. Daqaq, “On the reduced-order modeling of energy harvesters”, Journal of Intelligent Material Systems and Structures, Vol. 20, pp. 2002-2016, 2009. 9. M. Renaud, K. Karakaya, T. Sterken, P. Fiorini, C. Van Hoof, and R. Puers, “Fabrication, modelling and characterization of MEMS piezoelectric vibration harvesters,” Sensors and Actuators A, Vol. 145-146, pp. 380-386, 2008.
6. Appendix Symbol
Represents Beam Length
Value 350 µm 5 µm
ρp
Beam Width Thickness of the poly-Si layer Thickness of AlN layer Seismic mass length Seismic mass width Seismic mass thickness Density, Poly-Si
ρAiN
Density, AlN
3300 Kg/m³
ρAu
Density, Au
19 300 Kg/m³
Ep
Young’s Modulus, Poly-Si Young’s Modulus, AlN
L b hp hAlN Ls bs hs
EAlN
2 µm 3 µm 50 µm 500 µm 50 µm 2330 Kg/m³
169 GPa 300 GPa
υp υAiN σp σAiN εAlN ε0 d31 Vapp
Poisson's ratio, Poly-Si Poisson's ratio, AlN Allowable stress, Poly-Si Allowable stress, AlN Relative permittivity of AlN Permittivity of air Piezoelectric electromechanical coefficient Actuator voltage
Q
Amplitude of base acceleration Quality Factor
RL
Load resistance
Ao
0.22 0.22 1200 MPa 320 MPa 9.2 8.85e-12 F/m 3e-12m/V 0, 10, 20 and 30 volts 0.5g m/s² 15 10 kΩ